What Does Lowest Population Growth In US History Mean For Employment?
Authored by Chris Hamliton via Econimica blog,
2019 saw US population growth at its lowest percentage level in US history aside from the pandemic years of 1918/1919 (when the Spanish flu took the lives of nearly 700,000 Americans). The 0.5% annual growth meant US population grew by approx. 1.55 million persons in 2019.
Today, I just wanted to focus on the implications of low population growth on US employment. To set-up this article, I think it’s important you see the raw population and employment data, by age groups. No highly gamed unemployment percentages or in labor force or out of labor force. Just raw population data and employment data.
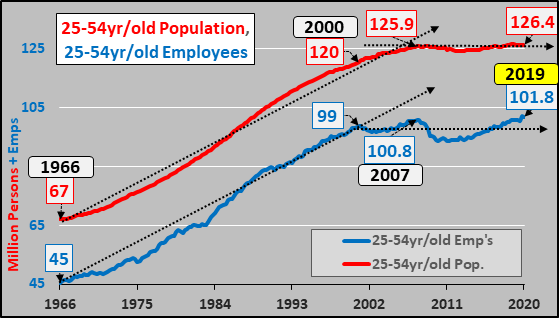
25 to 54 Year-Old Population, 25 to 54 Year-Old Employees
First, the population and those employed among the largest and most influential segment of the US population, the 25 to 54 year old’s. They make up about 60% of the 15 to 64 year old population and 70 percent of those employed among the same group. They are the engine that drives US consumption. Their population added 59 million from 1966 through 2007 but since 2007, this segment has added just a half million. Employment among them rose 54 million from 1966 through 2000…but has essentially stalled since 2000, adding just 3 million employees over the last two decades.
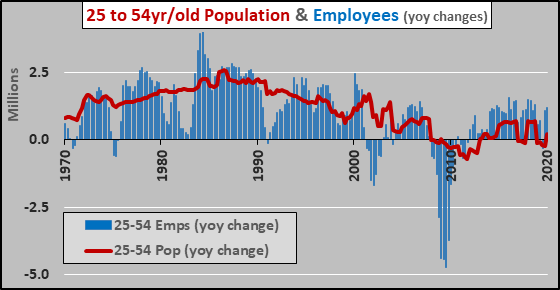
Below, the 25 to 54 year-old population (red line) and employees (blue columns) both on a year over year basis. The growth of the population has always been a governor on the potential for employment growth.
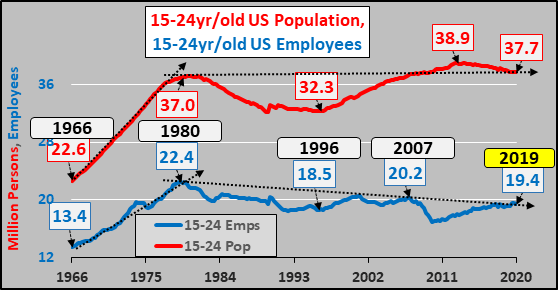
15 to 24 Year-Old Population, 15 to 24 Year-Old Employees
To understand America, the chart below is so important. You reap what you sow, and if your young adult population ceased growing four decades ago, you can only fake economic growth for so long. The population of young adults has risen less than one million persons over four decades and those employed among them has declined by three million. This population is busy attending university, at record proportions, and is once again likely at peak employment.
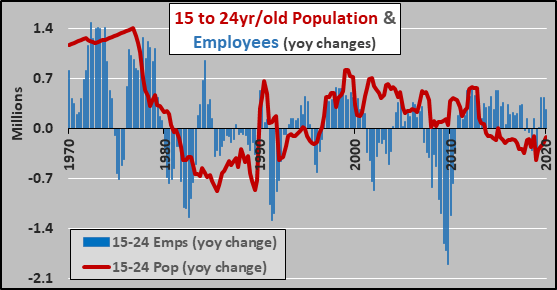
Below, the 15 to 24 year-old population (red line) and employees (blue columns) both on a year over year basis. Note the current period of declining population versus rising employment.
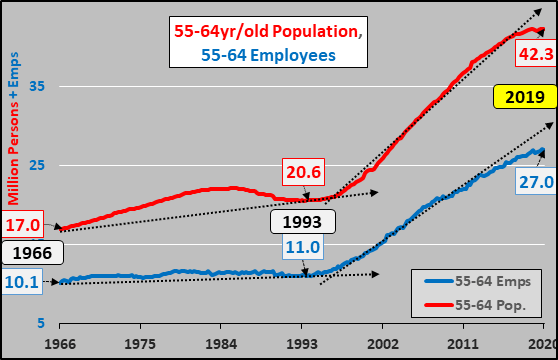
55 to 64 Year-Old Population, 55 to 64 Year-Old Employees
It is the growth of the 55 to 64 year-old population and employment among them that has driven the US economy since the mid 1990’s. The population more than doubled from 1993 to present (21+ million) and those employed rose by 16 million.
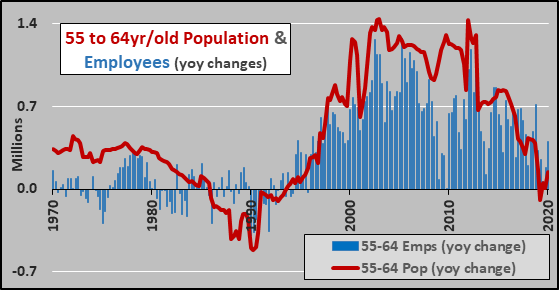
However, looking at both the 55 to 64 year-old population (red line) and employees (blue columns) on a year over year basis, the end of growth is upon us.
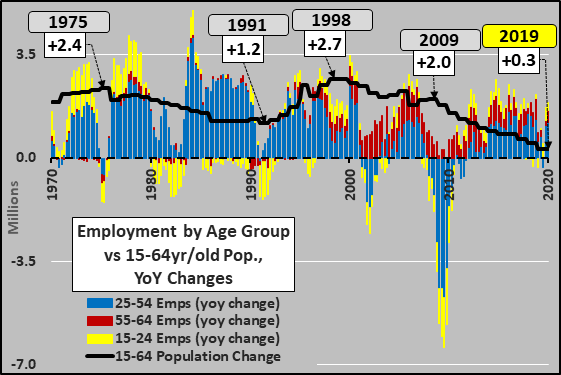
Pulling it all together, the black line below is the annual growth of the 15 to 64 year-old population versus the columns representing annual employment change, by age groups (blue 25-54, yellow 15-24, red 55-64). Three things to note here, (1) the decelerating 15-64 year-old population growth, (2) the shifting employment growth from the young adults to the 55-64 year-olds over the course of fifty years, and (3) it was the huge loss of employment in ’08/’09 that provided the fuel for the current incredibly long period of employment growth despite the decelerating working age population growth.
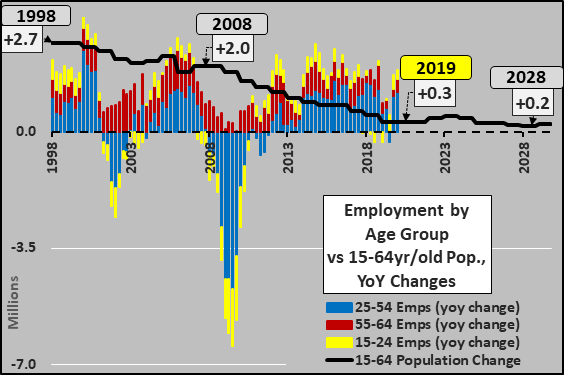
Over the next decade, the annual working age population growth will be about 10% of what it was from 1970 through 2010. So, to gauge potential employment growth or the fuel for employment growth…getting clear proportions of the population employed is pretty important.
I’m going to focus on the 25 to 64 year-old age segment, as they represent 87% of the employed among the 15-64 segment and they are the segment with the highest median incomes. The chart below shows the periods of recession followed by employment growth (blue columns) above population growth (red columns). This employment growth taking place faster than population growth has happened every time since 1970 until a ceiling, about 76%, is hit in the percentage of persons working.
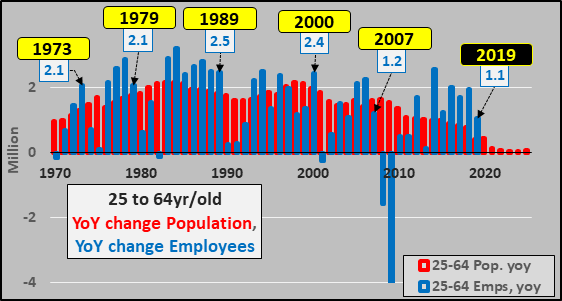
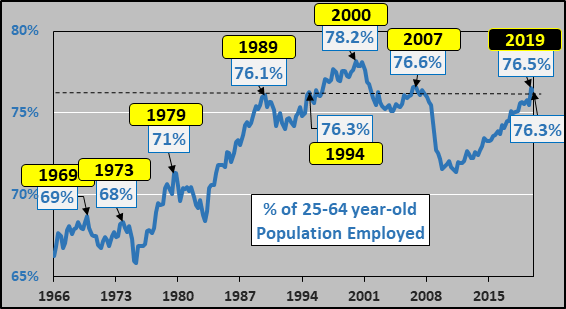
Checking the proportion employed among the 25-64 population, that ceiling of potential employment appears to exist around 76%…which was hit in 1989, 1994 (but pushed through to 78% in 2000), 2007, and again in 2019.
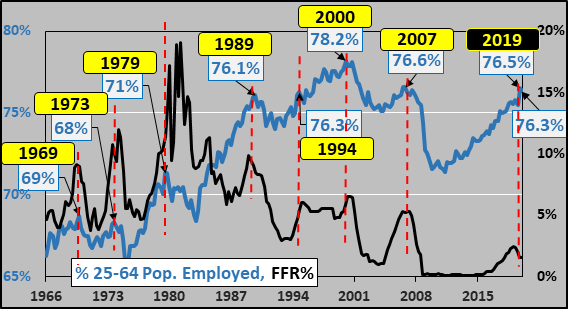
How important is peak employment among the 25 to 64 year-olds? Check the chart below showing the federal funds rate (black line) and the amazing correlation with the portion of 25 to 64 year-olds at work. The pre-1981 employment peaks were considerably lower as this was before women had employment rates comparable to men…but the post-1981 period saw progressively higher integration of women into the workforce, eventually surpassing male participation rates. So, the 76% ceiling appears to be the point of peak employable persons and the point at which growth in employment ceases, triggering the Federal Reserve to begin a new interest rate cut cycle as the recession is imminent.
But to be fully transparent, the chart below shows each age groups employment as a percentage of their population. 25 to 54 year-olds are essentially at peak employment, 55 to 64 year-olds are at record employment, and 15 to 24 year-olds regaining about half the ground they lost in the last great recession but still over 10% from all time highs. However, due to structural reasons, this is probably about as high as the 15 to 24 year-olds will get.

All this is to say that the federal government and Federal Reserve have shot the works (tax cuts, deficit spending, QE, Not-QE?!?, etc. etc.) to get the economy well past a sustainable level…and now the lack of further potential growth among employees means a lack of growth among consumers. The Fed has already begun the rate cuts and acknowledged there is no further fuel (population growth) to power any further economic growth.
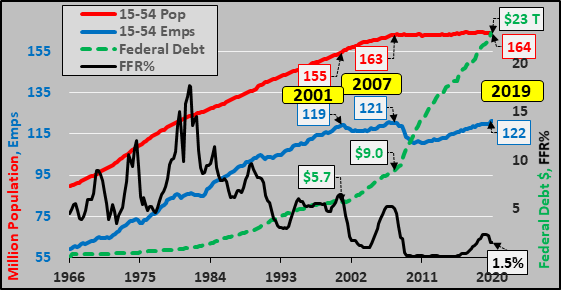
Finally, just to offer a few more viewpoints on what has taken place…the chart below is the 15 to 54 year-old population, employees, federal funds rate, and federal debt.
Or, below, looking at declining annual US births (inclusive of all births to legal and/or illegal parents) versus surging federal debt.
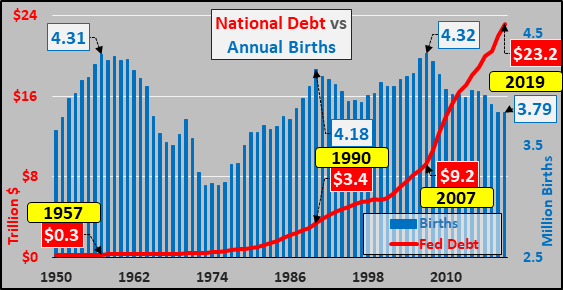
Clearly, the only thing growing is debt.
Tyler Durden
Sat, 02/01/2020 – 13:05
via ZeroHedge News https://ift.tt/2Uhb13V Tyler Durden