Here It Is: One Bank Finally Explains How The Fed’s Balance Sheet Expansion Pushes Stocks Higher
One month ago, in a bizarre attempt to mock “QE Conspiracists” such as his current colleague and former Goldman co-worker Robert Kaplan, Trump’s chief economist Larry Kudlow and Morgan Stanley CEO James Gorman – Minneapolis Fed president and 2020 FOMC voter Neel Kashkari, also known as “Chump” for his role in arranging a bailout of his former employer Goldman Sachs alongside all US commercial banks and sticking the US taxpayers with the bill, asked “someone” to explain to him “how swapping one short term risk free instrument (reserves) for another short term risk free instrument (t-bills) leads to equity repricing.”
To help the confused Kashkari, we did just that using examples from none other than his own regulator, the Bank of International Settlements, although he appears not to have understood anything we said, because just a few days later, his former Fed and Goldman colleague, Bill Dudley, echoed Kashkari and confirmed he has no clue how monetary policy actually operates, when he wrote that the Fed’s balance sheet expansion has no effect on the stock market (we wonder if a prerequisite for working at Goldman Sachs is the complete inability to grasp how financial and monetary plumbing actually operates).
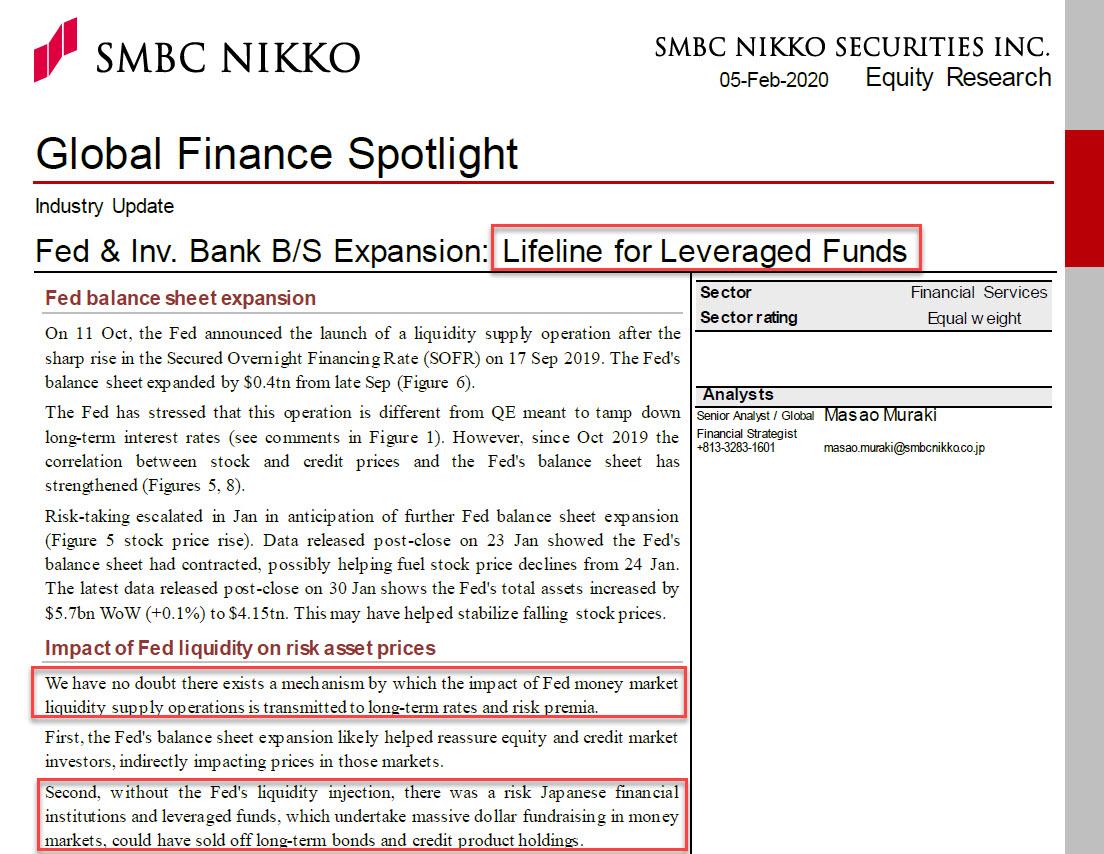
In any case, just because a couple of Fed hacks and their assorted croneys fail to grasp how monetary policy works, or are unable to comprehend what we wrote in “The Fed Was Suddenly Facing Multiple LTCMs”: BIS Offers A Stunning Explanation Of What Really Happened On Repocalypse Day“, doesn’t mean that all financial professionals are in the same boat. And sure enough, overnight SMBC Nikko’s Masao Muraki, formerly one of Deutsche Bank’s most respected strategists, has written the definitive report paraphrasing everything we have said over the past ten years on this topic in easy to comprehend – even for career economists, twitter “finance professionals” and, yes, central bankers – report, titled “Fed & Investment Bank Balance Sheet Expansion: Lifeline for Leveraged Funds” in which Muraki writes “we have no doubt there exists a mechanism by which the impact of Fed money market liquidity supply operations is transmitted to long-term rates and risk premia. First, the Fed’s balance sheet expansion likely helped reassure equity and credit market investors, indirectly impacting prices in those markets. Second, without the Fed’s liquidity injection, there was a risk Japanese financial institutions and leveraged funds, which undertake massive dollar fundraising in money markets, could have sold off long-term bonds and credit product holdings.”
Since have written on this topic over and over and over, and frankly are now tired of addressing an audience that is either mentally handicapped, or its paycheck depends on simply being unable to grasp what is actually going on, we will pull the main highlights from Muraki’s report which we urge anyone who has an even passing interest in how the Fed really manipulates markets, to read.
Today’s content is about the mechanism the markets haven’t quite recognized yet. I have been monitoring entities that undertake massive dollar fundraising through repos and derivatives in money markets and invest in long-term bonds and risk assets, such as leveraged funds and banks and lifers.
Excessive risk-taking activities of those players could have possibly been one of the causes of the interest rate spike in money markets. This suggests once the Fed decreases the liquidity injection, their leverage level would no longer be maintained and therefore they could sell off long-term bonds and risk asset holdings

This also explains why Bill Dudley was so eager to “explain” why the Fed’s tapering of QE4 won’t have an impact on markets – precisely because it will. But back to Muraki:
Costs & benefits of Fed balance sheet expansion
Impact of Fed liquidity on risk asset prices
We have no doubt there exists a mechanism by which the impact of Fed money market liquidity supply operations is transmitted to long-term rates and risk premia. First, the Fed’s balance sheet expansion likely helped reassure equity and credit market investors, indirectly impacting prices in those markets. Second, without the Fed’s liquidity injection, there was a risk that leveraged funds and Japanese financial institutions, which undertake massive dollar fundraising in money markets, could have sold off long-term bonds and credit product holdings.
Key indicators for gauging Fed balance sheet policy
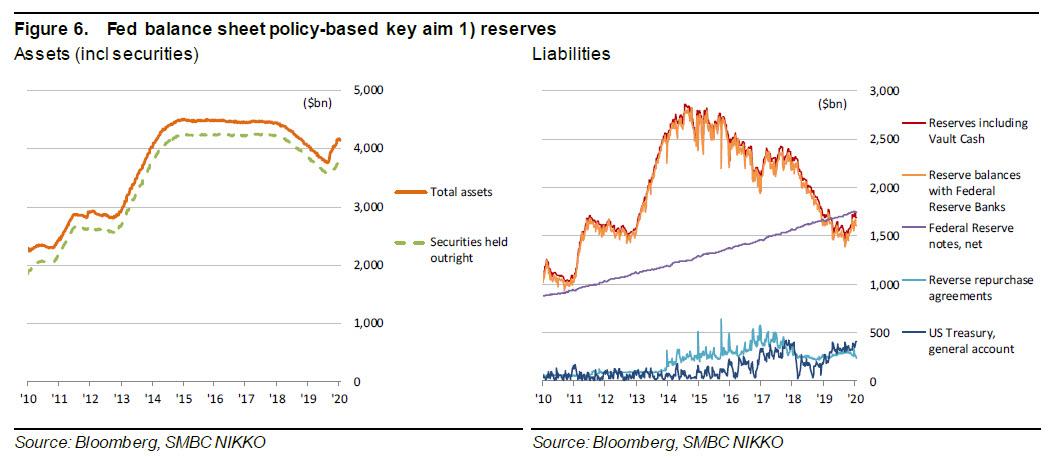
The Fed likely faces a difficult choice when weighing the costs and benefits of liquidity supply operations (and the associated balance sheet expansion). We will monitor the following three factors, which we think the Fed looks to in determining policy. The outlook for liquidity (especially non-reserve liability; Figure 6)…
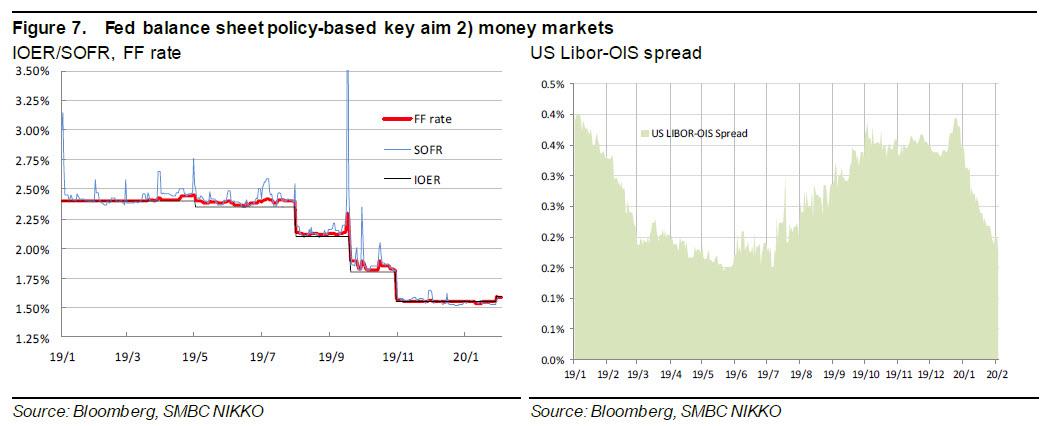
… volatility and tightening in money markets (Figure 7)….
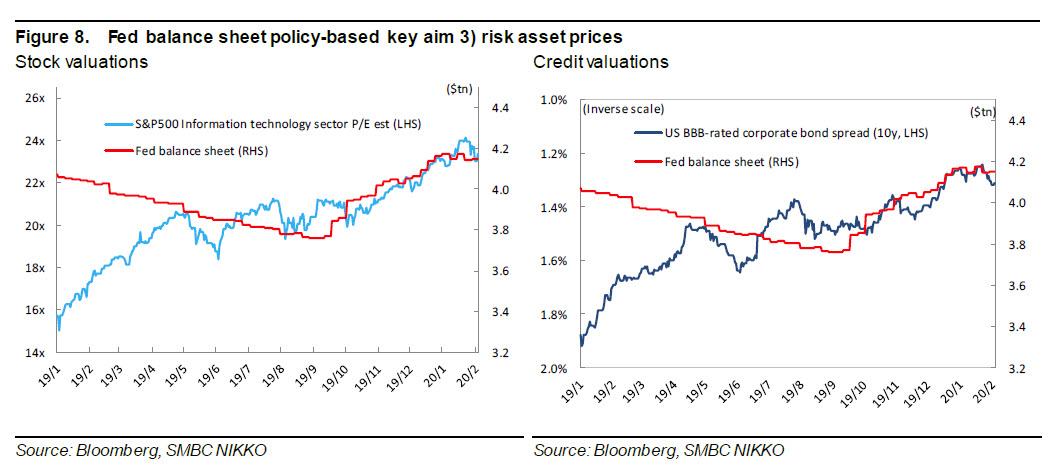
… and the side effects on risk asset prices (Figure 8).
Consequences of dollar liquidity shortage
Dollar crunch in money markets
Apart from seasonality (timing of tax payments, etc), we think the surge in repo rates reflected the following structural changes.
1) Decrease in liquidity owing to monetary policy (Fed balance sheet tapering), 2) decrease in liquidity owing to financial regulations like liquidity regulations (LCR), liquidity stress tests (CLAR), recovery & resolution plans (RRP), and money market fund (MMF) reforms, 3) increased demand for liquidity owing to the stepped-up hunt for yield.
Risk-taking by leveraged funds and Japanese financial institutions
Regarding point 3 above, amid the climate of falling interest rates and credit spreads, the hunt for yield has spurred activity in the “carry trade” (Note 2), ie investing short-term money in long-term bonds in order to make money on long-short interest rate differentials (incl non-liquidity premium/term spread). The Bank for International Settlements (BIS) has highlighted the role of leveraged funds in that regard (comments in Figure 2).
In our view, massive dollar fundraising in money markets by A) US-based leveraged funds and B) Japanese financial institutions has heightened demand for short-term money.
- A) US-based leveraged funds take on high amounts of leverage by repeating the following: use equity sales proceeds to buy long-term bonds and use them as collateral to raise money in repo markets to fund purchases of other long-term bonds, which are re-collateralized for more long-term bond purchases, and so on (Figure 19).

- B) Japanese financial institutions, specifically life insurers and non-GSIB banks, have few stable sources of dollar funding. For these entities to invest in dollar-denominated bonds, they often first raise dollars in swap/forward/repo markets (forex hedged; mostly 3-month maturities). This money is then invested in 5-10y bonds (Treasuries, munis, mortgage bonds, corporate bonds, etc).
Note 2: In general, liquidity is high for short-duration funding and low for longer-duration investments like long-term bonds (liquidity and maturity transformation).
Risk of “negative carry” and asset selloffs
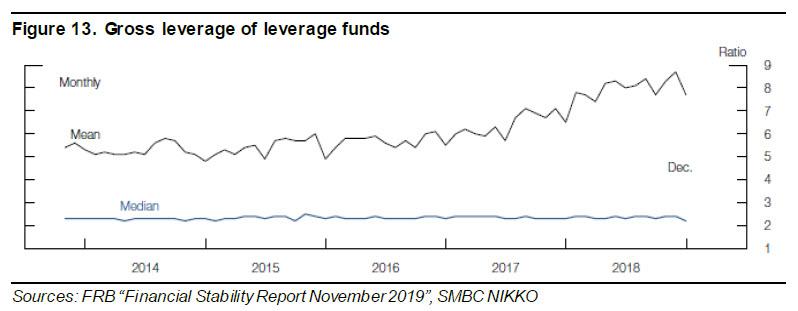
Leverage is being used to amplify yields, and so is trending higher (Figure 13).
Use of derivatives is spreading as well (Figures 14-15).
![]()
This has been enabled by ample dollar liquidity and low volatility in markets (Figure 18).

The above described trades are subject to uncertainty (risk) in that future liability funding costs are unknown. There is risk of “negative carry” when rolling over liabilities, ie funding costs exceed yield (returns) on assets. If the kind of repo market volatility seen in Sep 2019 and rising costs continue, there is a real risk some investors could be forced to sell off long-term bond holdings.
* * *
REITs with 10% yields: Ultra-leveraged vehicles
Spread: 1% x leverage 10x
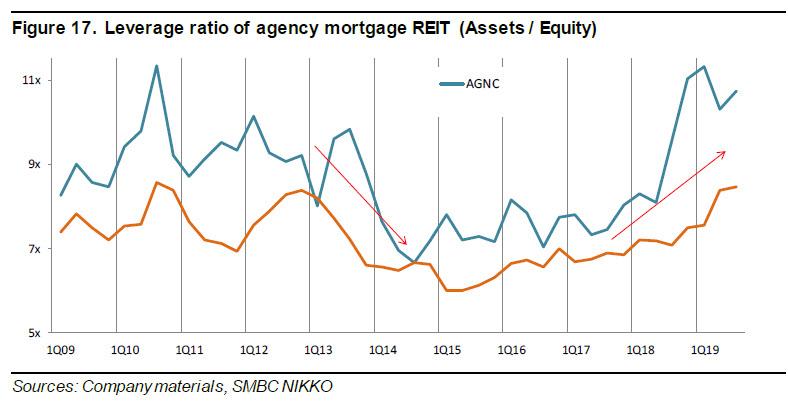
Figures 16 and 17 show total assets and leverage (total assets / capital) for Annaly Capital and AGNC, listed agency mortgage REITs (Note 3) that are typical examples of leverage funds. Both have extremely high dividend yields at around 10% and are popular funds with individual investors. Spreads (ROA) are around 1%, but leverage is roughly 10x equity procured from the market, which has boosted dividend yield on equity to approx 10% (Figure 19).
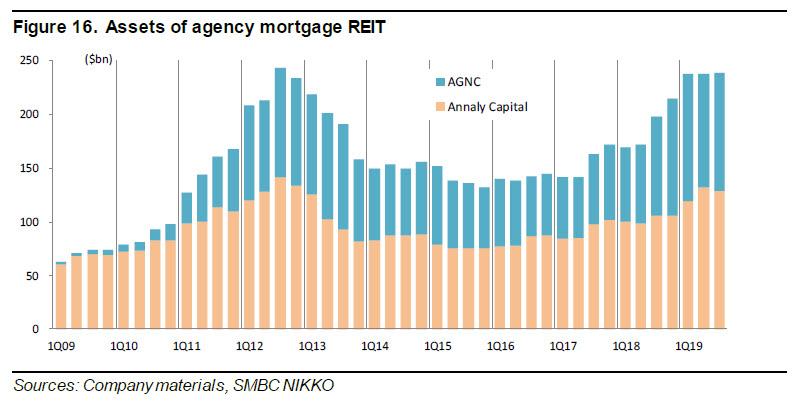
Around 90% of liabilities are from short-term (within 6 months) repo funding (70-80% within 3 months). 80-90% of assets consist of 30-year MBS (residential mortgage-backed securities). They have worked to control interest risks (asset & liabilities duration mismatch risk) mainly using swaps, but mismatch risk tends to rise rapidly when MBS convexity risk prompts sharp interest rate fluctuations.
Leverage absorbs major dollar liquidity
These REITs operated at leverage of around 9x through 2012 but incurred damage to capital after an interest rate jump from the “Bernanke shock” caused a fall in asset holdings in 2013. Providers of repo funding became cautious about extending credit to these REITs, which subsequently operated at a leverage of around 7x for some time.
From 2H 2018, however, these REITs rapidly hiked leverage (Figure 17), and we think they and other types of leveraged funds absorbed a large amount of dollar funding in money markets, reflecting surging repo rates on 17 Sep 2019.
Note 3: Agency mortgage REITs are a type of mortgage REIT (mREIT) that invests in mortgage securities and are called this since they invest mainly in agency MBS. In recent years, they have expanded their investments to credit products (mainly BB rating or below), including RMBS, CMBS, and leveraged loans (total assets: from several % to approx 10%). Being classified as REITs, over 90% of agency mortgage REIT profits are distributed but are also tax exempt.
Figure 1. Collected comments (Fed balance sheet policy)
Balance sheet expansion comes with side effects
Minutes from 10-11 Dec 2019 FOMC, released on 3 Jan 2020: “A few participants raised the concern that keeping interest rates low over a long period might encourage excessive risk-taking, which could exacerbate imbalances in the financial sector. These participants offered various perspectives on the relationship between financial stability and policies that keep interest rates persistently low. They remarked that such policies could be inconsistent with sustaining maximum employment, could make the next recession more severe than otherwise, or could strengthen the case for the active use of macroprudential tools to guard against emerging imbalances.”
15 Jan 2020, Federal Reserve Bank of Dallas President Robert Kaplan: “Many market participants believe that growth in the Fed balance sheet is supportive of higher valuations and risk assets.” “The Fed balance sheet is not free and growing the balance sheet has costs.” “All three of those actions are contributing to elevated risk-asset valuations,” “And I think we ought to be sensitive to that.” “It’s a derivative of QE when we buy bills and we inject more liquidity; it affects risk assets. This is why I say growth in the balance sheet is not free. There is a cost to it.” “I think we’ve done what we need to do up until now. But I think it’s very important that we come up with a plan and communicate a plan for winding this down and tempering balance sheet growth.” “It would be healthy to get to a point where, certainly, we don’t need to do these daily and term [repo] operations. But I also want to do that in a way that has a structure and mechanisms in place that will again temper, limit, restrain the growth in the balance sheet overall.”
Sources: FRB, SMBC NIKKO
Figure 2. Collected comments (US & Japanese financial institution balance sheet policies)
Role of leverage funds
8 Dec 2019, BIS “September stress in dollar repo markets: passing or structural?” “Yet none of these temporary factors can fully explain the exceptional jump in repo rates.” “The four largest US banks specifically turned into key players: their net lending position (reverse repo assets minus repo liabilities) increased quickly, reaching about $300 billion at end-June 2019.” ”The big four banks appear to have turned into the marginal lender, possibly as other banks do not have the scale and non-bank cash suppliers such as money market funds (MMFs) hit exposure limits. “At the same time, increased demand for funding from leveraged financial institutions (eg hedge funds) via Treasury repos appears to have compounded the strains of the temporary factors.” “Shifts in repo borrowing and lending by non-bank participants may have also played a role in the repo rate spike. Market commentary suggests that, in preceding quarters, leveraged players (eg hedge funds) were increasing their demand for Treasury repos to fund arbitrage trades between cash bonds and derivatives. Since 2017, MMFs have been lending to a broader range of repo counterparties, including hedge funds, potentially obtaining higher returns. These transactions are cleared by the Fixed Income Clearing Corporation (FICC), with a dealer sponsor (usually a bank or broker-dealer) taking on the credit risk. The resulting remarkable rise in FICC-cleared repos indirectly connected these players. During September, however, quantities dropped and rates rose, suggesting a reluctance, also on the part of MMFs, to lend into these markets. Market intelligence suggests MMFs were concerned by potential large redemptions given strong prior inflows. Counterparty exposure limits may have contributed to the drop in quantities, as these repos now account for almost 20% of the total provided by MMFs. ”
“Some asset managers use derivatives to manage their risk or replicate a portfolio. For instance, ETFs may use derivatives to help their return track a particular target. Funds which invest in fixed income securities may naturally have use for IRD products. Such funds have also been expanding in terms of AUM, with an increasing share of them in the form of ETFs. Gross derivatives positions for asset managers and leveraged funds are increasing faster than those of dealers. They were 37% larger from April 2016 to April 2019 for three-month eurodollar contracts on the Chicago Mercantile Exchange, as compared with 18% for dealers.”
Sources: FRB, BIS, Teleconferences, Company materials, SMBC NIKKO
* * *
If after all this Neel Kashkari and his band of fintwit halfwits still needs “QE Conspiracists” to explain to him “how swapping one short term risk free instrument (reserves) for another short term risk free instrument (t-bills) leads to equity repricing” it’s clear that the inventor of TARP is either an idiot, along with everyone else who claims the Fed’s massive balance sheet expansion has no impact on stock prices, or simply has no interest in actually understanding the process he has helped create.
Tyler Durden
Thu, 02/06/2020 – 19:51
via ZeroHedge News https://ift.tt/2UynFf4 Tyler Durden