Goldman: This Is How The Selloff Changed On Thursday
Dip-buyers tried – and failed – yesterday to bring an end to the avalanche of stock market losses, but the moves in bonds, FX, and commodities are just as stunning and in an overnight note, Goldman Sachs explains how the cross-asset sell-off changed on Thursday… and what they are watching.
Via Goldman Sachs,
As we look across moves in equity, credit, rates, commodities, China equities, US Health Care and volatility, we believe the timing of moves in each asset helps us to estimate how sentiment has shifted. We believe that understanding these sentiment shifts has implications for asymmetric moves around upcoming political and macro catalysts as well as the steady stream of COVID-19 updates. We detail these shifts and our favorite options trades below.
Exhibit 1: How the sell-off developed and what we are watching now
Total return of FXI, SPX, CDX IG 5Y, VXX, TLT, USO
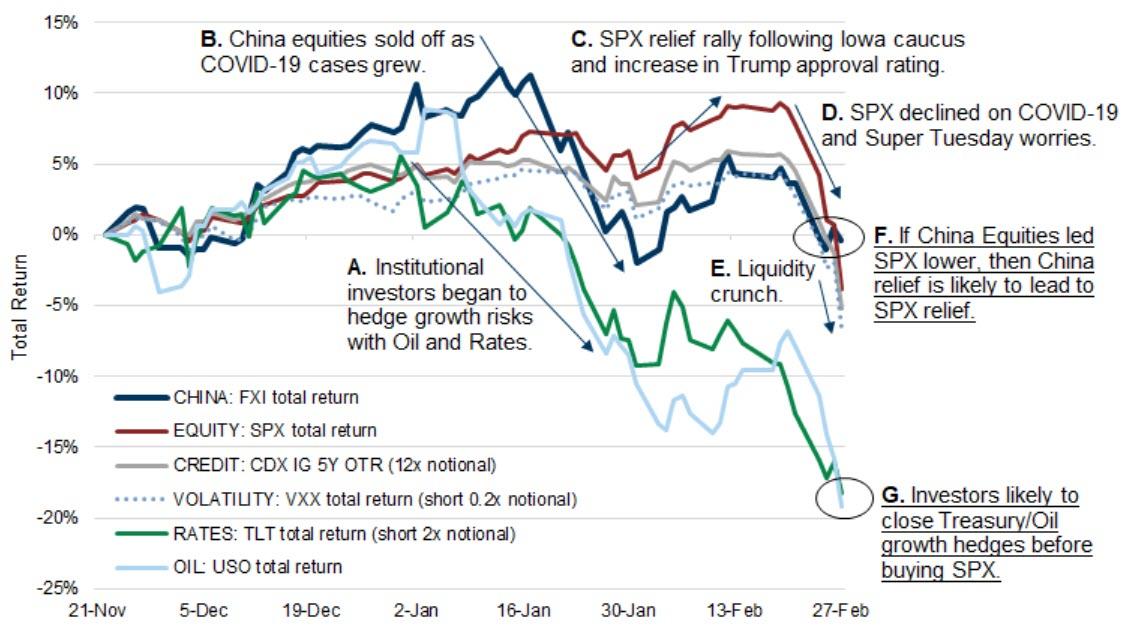
How the cross-asset selloff developed:
A. Early January: Treasuries rallied and oil declined as institutional investors used these assets to reduce the risk of multi-asset portfolios to a global growth slowdown.
B. Late January: China Equities began to decline in late January as COVID-19 cases increased in China. US Health Care stocks sold off more than SPX in anticipation of the Iowa Caucus (not shown).
C. Early February: Broad US equities rallied as individual investors bought ETFs and select Tech/Consumer stocks as the Iowa catalyst passed. China equities rallied as the rate of growth of COVID-19 cases in China seemed to plateau.
D. Monday-Wednesday of this week: US Equities, US Credit, Treasuries and Oil all declined in a correlated sell-off. This pushed Treasuries and Oil to even further extremes. US Health Care Equities sold off more than the SPX demonstrating that political risk was a significant driver of selling pressure.
E. Thursday of this week: The VIX spiked to its highest level since February 2018 and SPX futures liquidity dropped to near all-time lows. Low liquidity likely amplified the price impact of equity selling flow. This marked a significant change in the velocity of the sell-off.
What we are watching now:
F. China Equities were up 2% in the month of February as of yesterday’s close, outperforming the SPX by 9%. Some underperformance of the SPX vs FXI during a period when investors have become more concerned about the impact of COVID-19 on the broader global economy was understandable; however, the resilience of FXI in recent days seems inconsistent with a view that global growth risk has significantly accelerated. We will be closely watching equity performance in China looking for opportunities to buy puts on FXI or calls on US/European markets.
G. Treasuries and Oil prices were leading indicators heading into this broad equity decline; we will be closely watching these markets for evidence that investors are removing these hedges and positioning for a rebound in growth sentiment. We have yet to see investors reduce these hedges. This indicator is not yet supportive of buying calls on US equities. Buying TLT puts appears attractive for investors that expect global growth sentiment to improve.
Four Notable Derivatives Market Developments:
1. SPX futures liquidity declined significantly on Thursday, reaching its lowest level since December 2018.
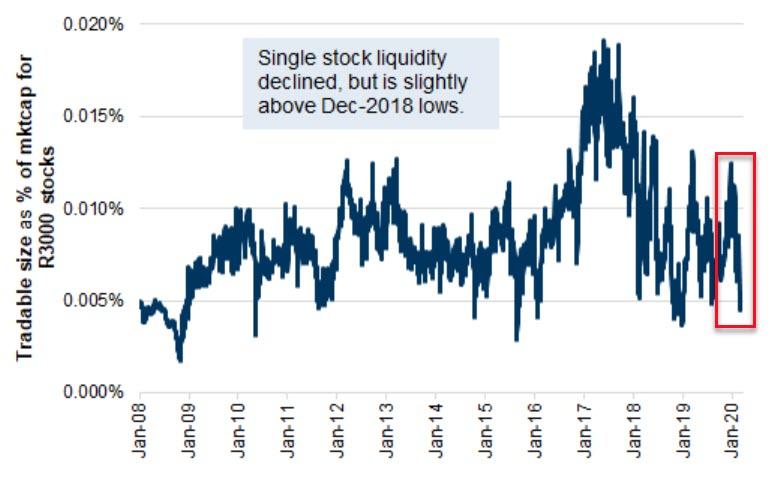
This supports the idea that the sell-off accelerated due to a lack of liquidity rather than an increase in fundamental investors selling. Single stock liquidity also declined, but is at less extreme levels.
Exhibit 2 : S&P Futures liquidity declined to near all-time-lows yesterday
Daily median E-mini future bid-ask depth ($mm notional), based on 5-minute intraday snapshots
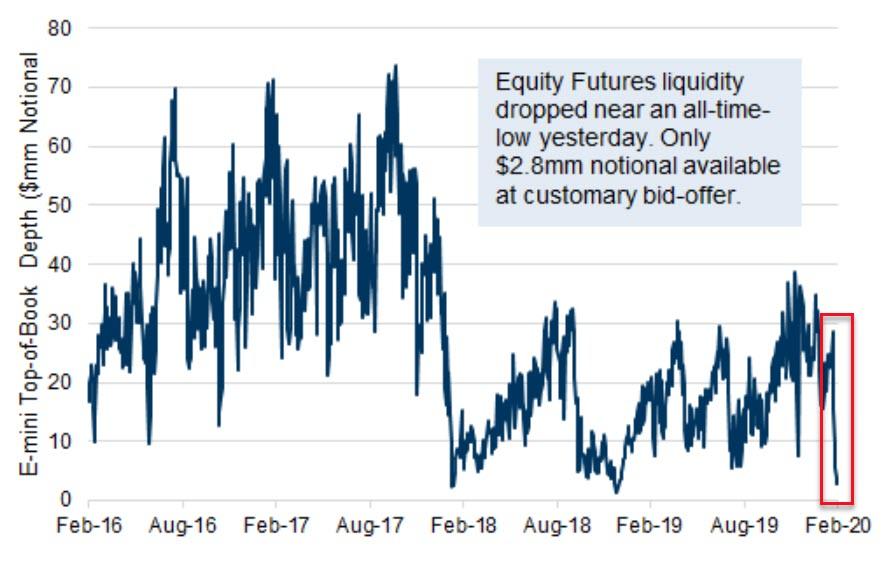
Exhibit 3 : Single Stock liquidity has declined, but is slightly above Dec-2018 lows
% of market cap tradable while only expecting to move the stock 10bps for Russell 3000 companies
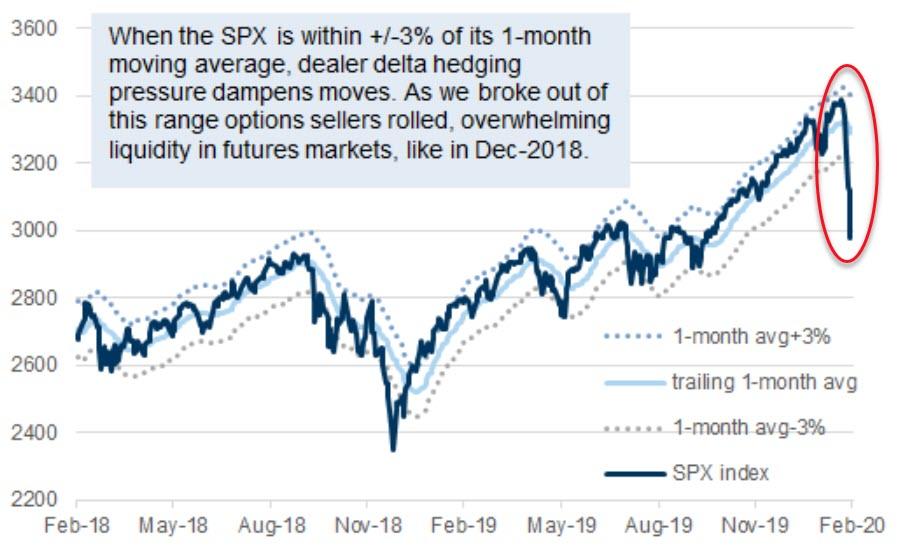
2. Systematic Options selling flows: Rolling of short put positions likely exacerbated SPX moves on Thursday.
As of Wednesday, the SPX broke out of the +/-3% range relative to its 1 month moving average. We estimate, there are over $100b of AUM in systematic SPX 1 month put and strangle selling strategies. These portfolio managers generally sell 1-month puts and strangles and only adjust positions if the options sold trade significantly in-the-money. We use the 1-month moving average of the SPX as a proxy for the SPX level when they initiated their positions. On Wednesday, the SPX traded to 5.7% below the 1-month moving average, likely beginning to trigger rolling activity (these investors would buy back their in-the-money-puts and sell new out-of-the-money puts). This activity is visible as excess selling pressure on SPX futures and pressure on SPX option put-call skew. On Thursday, we believe this rolling activity combined with lower SPX futures liquidity than in prior days, likely exacerbated price moves as the SPX declined to 9.5% below its 1-month moving average.
Exhibit 4 : Rolling of short options positions outsized underlying equity liquidity
SPX relative to its 1 month moving average
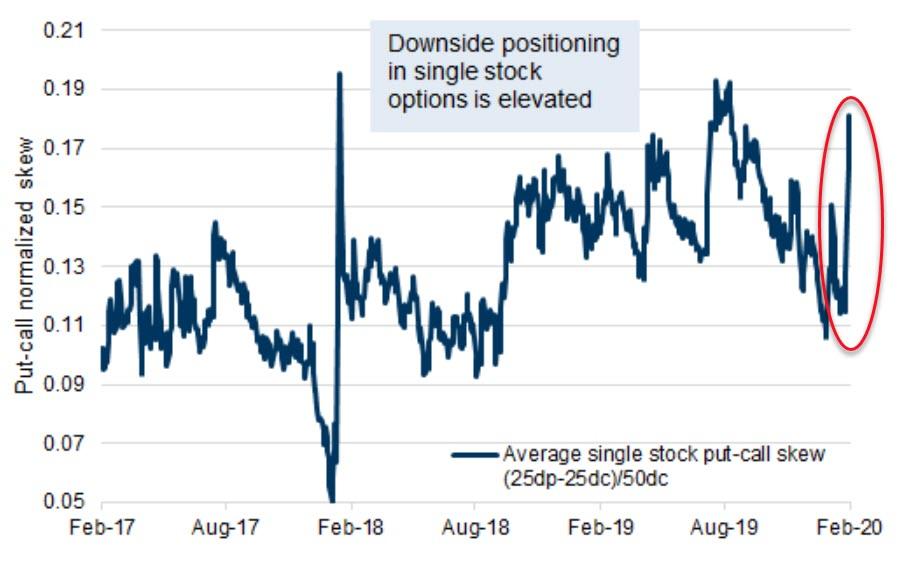
3. Investors have rushed to hedge single stocks, showing a fear of further sell-off acceleration.
We find S&P 500 average stock put-call skew has been statistically more useful than index put-call skew as a contrarian indicator for predicting forward returns of the SPX over a two-month period (R-squared of 12% over the past 3 years). Ahead of earnings season, this signal suggested muted returns for stocks. Single stock skew is calculated using the volatility surfaces of all individual stocks in the S&P 500 and it is more likely to be indicative of broad positioning across the market and less likely to be influenced by a few large trades by macro investors in index options.
Exhibit 5 : Elevated concerns are priced into single stock options
S&P 500 average stock put-call skew
4. Healthcare stocks underperformed the SPX early this week showing that investor worries about political risk increased sharply following the results from Nevada on Saturday.
Weakness in Health Care stocks as we approach Super Tuesday looks similar to the last week of January when political concerns led investors to reduce risk ahead of the Iowa Caucus. We see unusually high potential for a relief rally in Health Care stocks next week as investor concerns are likely to be relieved in the short term by the passing of Super Tuesday.
Exhibit 6: Options pricing suggests Health Care sentiment is at bearish extremes
XLV total return relative to the 1 year rolling percentile rank of 3 month implied volatility and put-call normalized skew
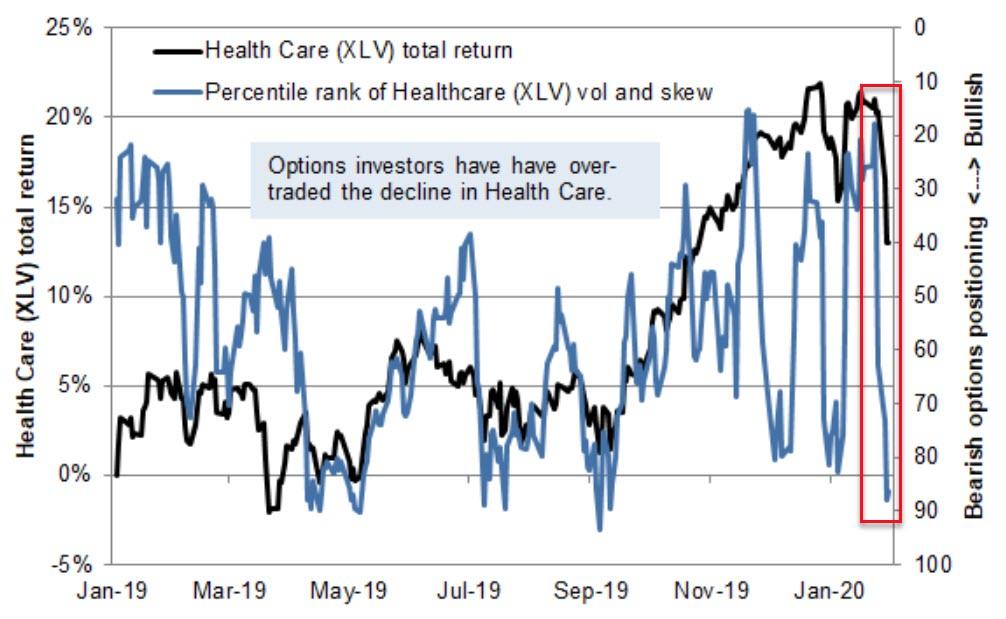
We believe that investors have reduced Health Care exposure and implemented hedges this week in anticipation of Super Tuesday as a catalyst and will see fewer near-term catalysts after we pass Super Tuesday. To be clear, we are not taking a view on the result of Super Tuesday as we believe a wide variety of potential outcomes are likely to lead to an improvement in sentiment for Health Care stocks.
However, amid all this chaos, NorthmanTrader.com’s Sven Henrich, highlights the real tragedy in all this…
…the real message will likely get lost in all this. Most likely the popular narrative will be to blame the coronavirus as the unforeseen event, nobody could have seen this coming, this was not something anyone could have prepared for.
While that’s true on the surface it completely misses the larger point: The Fed, with it liquidity operations masked all the underlying issues in the markets over the past year. We had no earnings growth in 2019, we had multiple expansion. The bond market never confirmed the reflation trade, Gold had been rallying for months signaling something was amiss. And now the Fed left itself vulnerable to not being able to deal with a real crisis and basically openly invited people to TINA chase stocks into high valuations.
The Fed gave no warning to investors, instead it cheerlead investors off the cliff. Even last week Fed officials defended valuations and saw nothing wrong with anything adding to the atmosphere of complacency.
And now everyone will blame the virus, but not the reckless chase into stocks into historic valuations to begin with.
But, as Nomura’s Charlie McElligott warned, the fear of this potentially imminent – and likely coordinated – central bank “interventionary” response (let’s call it: this upcoming Sunday night, before the Asian open) will keep markets in a dangerous space, because strategies and traders which are potentially “pressing” shorts 1) either directionally (CTA model now “in play” of outright “short SPX”) or 2) pressing-shorts to managed “net exposures” or hedge long books, will be exposed to a surge squeeze higher, while investors who have been “grossed-down” by their risk management VaR models won’t be exposed to an “up-trade” in risk and likely feel obligated to “grab into” a short squeeze.
Trade accordingly.
Tyler Durden
Fri, 02/28/2020 – 09:20
via ZeroHedge News https://ift.tt/2wfoFKC Tyler Durden