Crash Alarm Flashing Red As Cross-Asset Correlation Soars
On Sunday, just hours before a torrid, desperation-inspired wave of buying sent the Dow Jones nearly 1,300 points higher, its biggest one day gain ever, we warned that the market is on a precipice, with both short interest…
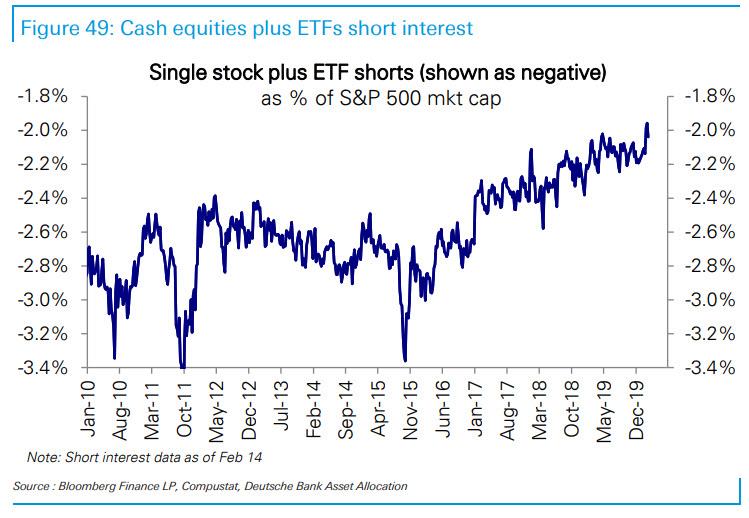
… and overall futures liquidity…

… at all times lows.
It took one day to see just why this was a huge problem: just minutes after the Fed cuts rates by 50bps in its first emergency intermeeting rate cut since the financial crisis, one which the market priced in on Monday (yet wasn’t enough) sentiment reversed as if on a dime, and with no liquidity or short overhang to absorb the selling stocks crashed, resulting in the worst market reaction to a Fed easing, in history. This prompted many to wonder if the Fed “knows something we don’t”, and more ominously, if the Fed has lost all credibility and will now be forced to cut to zero (and and below) while launching QE5 just to keeps stocks from plunging further.
Unfortunately, for the Fed, there is now another flashing-red alert, and in addition to record low liquidity and short interest, we can also add a surge in cross-asset correlations – which in recent years seen as a far more accurate of rising market risk than the manipulated VIX – to the pre-crash indicators that are keeping traders up at night.
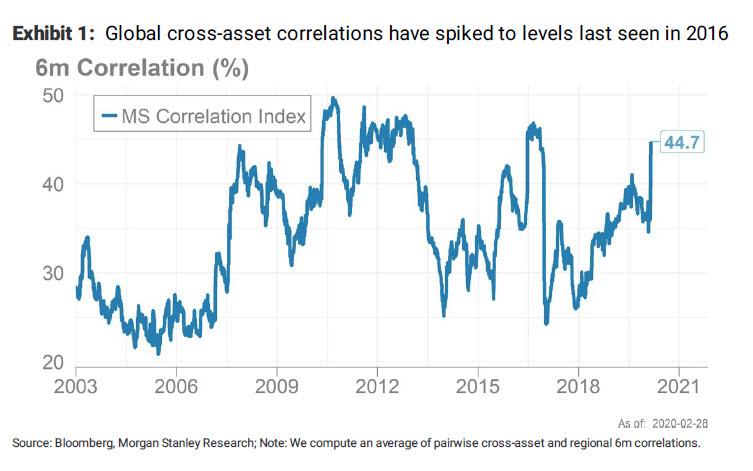
Commenting on the recent extreme surge in correlation within and between asset classes, Morgan Stanley writes that global “cross-asset correlations have spiked higher this week, to levels last seen in 2016” noting that within this, “regional correlations, cross-asset correlations and individual stock correlations have all risen simultaneously.”
Some more details:
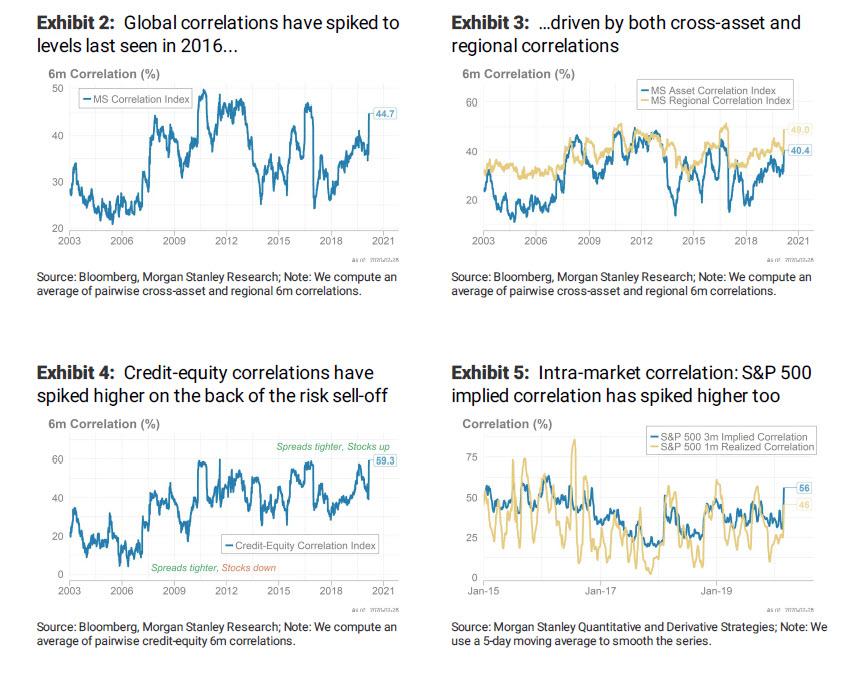
This sharp increase in global correlations represents a rise in correlations at each of the three key ‘levels’ that we care about – cross-asset, cross-market and intra-market: Our correlation indices (Exhibit 2) focus on the first two of these, while the last is an important addition. For more details on the components which go into our global correlations index, see Appendix: Global correlation index components.
Cross-asset correlation (50% of our index): This refers to how closely prices in different assets are moving relative to each other (credit versus equities, equities versus rates, equities versus FX, etc.). While cross-market correlations have broadly risen across the board, credit-equity correlation, in particular, is now near a 20-year high and has only been higher in 2011.
Regional correlation (50% of our index): This refers to how closely prices in different regions of the same asset class are moving relative to each other (i.e., US versus European equities, US versus Japanese rates, EUR versus GBP). The increase here has been sharp as well, largely driven by a spike in regional equity and credit correlations. On the other hand, intra-FX correlations have remained rather subdued.
Intra-market correlation: This refers to how closely prices of different securities within an index are moving (i.e., are the stocks within the S&P 500 all moving together, or not). Notably, S&P 500 3m implied correlation has spiked higher on the back of the risk-off move. A spike in intra-market correlation is common in market stress environments, as ‘idiosyncratic’ stories (company-specific M&A, tweets) matter less than overall economic or earnings fears.
Explaining what regular readers know all too well, MS notes that correlation spikes typically happen in market stress scenarios, and observes that with growing concern about the impact of the COVID-19 outbreak, risk assets saw the sharpest decline over the past week since the global financial crisis. This is apparent in correlation moves too.
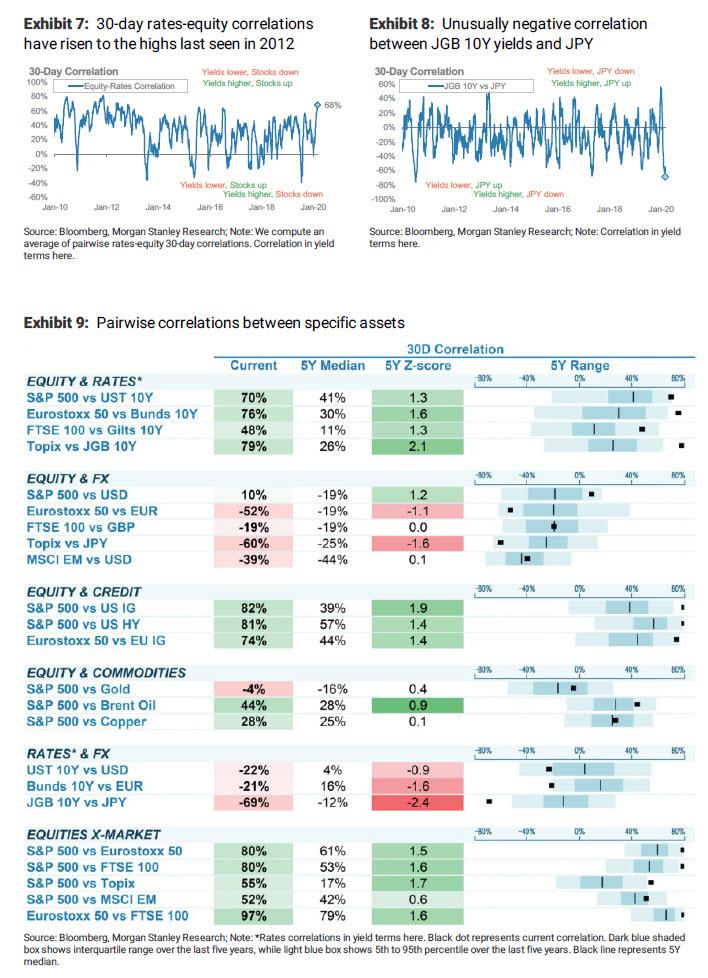
So one day after Morgan Stanley laid out the cheapest crash hedges ahead of today’s plunge (for those who put them on, congratulations), the bank looks at just where correlations look most extreme, and finds that equity-rates correlation is now extremely positive as government bond yields fall in tandem with equity markets, particularly in Europe and Japan. There are also unusually high correlations between US and European stocks, and extremely negative correlation between JGB yields and JPY, as JGB yields fall alongside a rally in JPY in the sell-off. Some more details:
- Equity-rates correlation: Across the G4 regions, equity-rates correlation are now extremely positive, specifically in Europe and Japan. A positive correlation here means falling stocks and falling yields.
- Rates-FX correlation: While FX correlations have remained subdued, we note that rates-FX correlations have declined sharply. Specifically, JGB yields and JPY correlations are very negative now, as yields have fallen while JPY has rallied in the
- sell-off.
- Equity-commodities correlation: Notably, the usual negative correlation of gold to stocks is less negative now. Gold has worked less well as a hedge in the sell-off last week, with gold falling by 4.9% on the week.
- Regional equity correlation: The correlation between US and European stocks is now unusually high.
That said, not every cross-asset correlation is surging: it’s worth noting that gold’s correlation to stocks has become less negative, which means that as stocks plunge – assuming the Fed has indeed lost control – the pet rock will soon be the best performing asset in the world.
Tyler Durden
Wed, 03/04/2020 – 14:05
via ZeroHedge News https://ift.tt/38tKrrO Tyler Durden