How Much Further Can Markets Fall? Here Is One Bank’s Answer
On Friday, March 6, Goldman’s chief US equity strategist, David Kostin, who bizarrely still holds held the view that the S&P will close the year at 3,200, despite now expecting an earnings recession, and Gldman economists calling for an economic recession in Q2 and a -5% GDP crash in Q2, laid out a binomial “downside case” scenario (i.e., a coin toss because as he admitted, he has no idea if the S&P would go up or go down) that saw the S&P plunging from the mid-2,900 level (where it was trading then) to 2,450 in a “coronavirus recession” case.
One week, and three-limit down sessions later, the S&P traded at 2,401.

So having been stopped out again by the market, Kostin – who realized he clearly wasn’t bearish enough to preserve client credibility – was forced to come up with even more dire downside cases, which he did over the weekend in his latest Weekly Kickstart where he said that while he still expects the S&P to magically rebound to 3,200, he admitted that there is a case where the US stock market could drop to 2,000 and even as low as 1,700, or laughably a 50% drawdown from Goldman’s year-end forecast, a move which Fed-backstopped issuers of subprime loans such as Goldman may afford, but none of Goldman’s clients would be able to live with such a wide range of outcomes.
Here’s more on how Goldman’s top economist comes up with a hilarious 1500 range for the S&P:
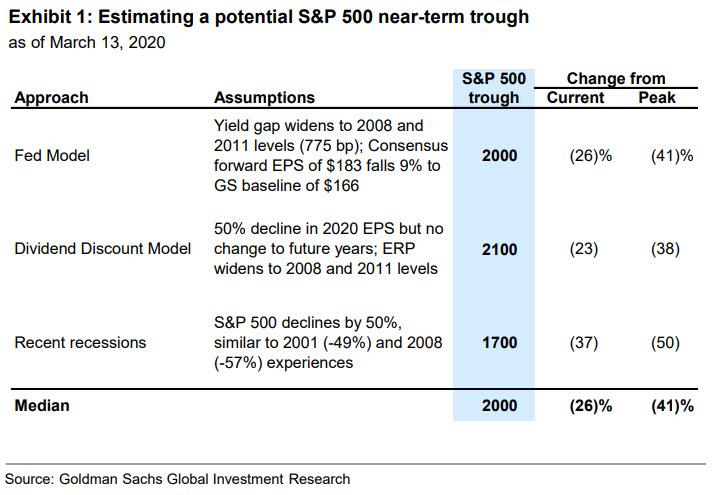
The “Fed Model” is our preferred valuation approach given the low interest rate environment. The yield gap is a proxy for the equity risk premium and measures the difference between the earnings yield and the 10-year US Treasury yield. Based on our macro model, the combination of lower consumer sentiment, higher policy uncertainty, and depressed breakeven inflation corresponds with a yield gap of 665 bp, which would rank in the 99th percentile vs. the last 20 years. Assuming a 10-year Treasury yield of 0.5%, the earnings yield would equal 7.2%, translating to a forward P/E of 14x and a S&P 500 level of 2450.
The yield gap peaked at 770 bp in late 2008 during the Financial Crisis and in mid-2011 during the Euro Crisis. A Treasury yield of 0.5% coupled with a yield gap of 770 bp equates to a earnings yield of 8.25% and a P/E multiple of 12x. Although the absolute P/E multiple bottomed at 9x in 2008 and 10x in 2011, Treasury yields were much higher then (3% and 2%, respectively). Assuming consensus EPS estimates eventually decline by 9% to our top-down forecast, applying a 12x multiple to a blended next-four-quarter EPS of $166 results in a S&P 500 trough of 2000 (26% below the current level and 41% below the high).
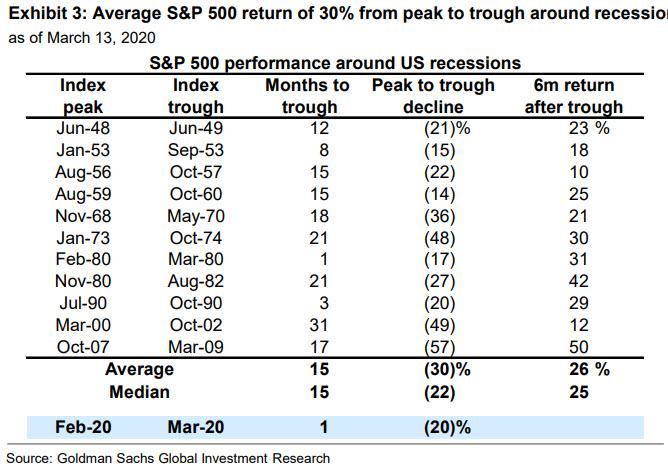
History represents another approach to estimating an index trough. During the 11 recessions since World War II, S&P 500 experienced an average peak-to-trough decline of 30%. A similar-sized decline from the recent peak of 3386 translates into a trough index level of 2370. However, the decline was larger during the last two recessions than during prior downturns. The S&P 500 fell by 49% after the Tech Bubble burst in 2000 and by 57% during the Financial Crisis. These recessions also included abnormally large EPS declines (-23% and -45%, respectively, compared to a median drop of 13% across all 11 recessions). A 50% decline from the February high suggests an index level of 1700, 37% below the current market level. Taking the median of the trough levels implied by the Fed Model (2000), DDM (2100), and historical example (1700) indicates a potential S&P 500 trough of 2000.
The combination of thin liquidity, high uncertainty, and positioning could cause the S&P 500 to fall below our 2450 base case estimate of fair value and closer to a trough of 2000. Investor positioning remained elevated during the first weeks of the correction and explains why we anticipated it would become a bear market. Our Sentiment Indicator, which combines nine different measures of positioning, read +1.7 standard deviations above average at the market’s peak in mid-February and declined to just 0.8 standard deviations below average one week ago. The Indicator has registered between 2 to 3 standard deviations below average at the trough of other major corrections this cycle
And visually?
So what is Kostin’s summary?
Here things get complicated. Here is part one of his summary:
The combination of thin liquidity, high uncertainty, and positioning could cause the S&P 500 to fall below our 2450 base case estimate of fair value and closer to a trough of 2000.
Then there is part two:
“During the 11 recessions since World War II, S&P 500 experienced an average peak-to-trough decline of 30%. However, the decline was larger during the last two recessions than during prior downturns. The S&P 500 fell by 49% after the Tech Bubble burst in 2000 and by 57% during the Financial Crisis. A 50% decline from the February high suggests an index level of 1700, 37% below the current market level.“
And finally, just to make sure he covered absolutely all bases, Kostin is still holding on to this (and yes, it’s all from the same report):
We expect the S&P 500 will end 2020 at 3200 (+18%).
Got all that? Great.
So what was the point of this particular garbage “analysis” which sees the S&P trading between 1700 to 3200 based on this or that? None really, except to show that in a time when the market is moving in a way that nobody has observed in over a decade, i.e., crashing and not even the Fed can halt it, even the smartest people in the room start to sound like idiots.
Tyler Durden
Mon, 03/16/2020 – 12:40
via ZeroHedge News https://ift.tt/2QkhqIG Tyler Durden