Distressed Debt In The US Doubles In 2 Weeks To $500BN As BofA Expects Surge In Defaults
Last week, in the aftermath of the historic oil price collapse, we warned that the long-awaited “fallen angel” day has arrived, as $140 billion in oil producer (and up to $360 if one includes the mid-stream companies) investment grade debt was on the verge of being downgraded to junk and throwing the entire high yield market in turmoil.
Fast forward to today when Bloomberg calculates that since we published out article, the amount of distressed debt – a term that describes borrowings likely to default – in the U.S. alone has doubled to a half-trillion dollars as the collapse of oil prices and the fallout from the coronavirus shutters entire industries.
While rating agencies have been slow to respond to the total collapse in cash flow generation across most US industries as long as the US economy remains paralyzed due to the spreading lock downs across the nation, markets have been far faster, and the result has been a plunge in the price of countless bonds. As a result, corporate bonds – which according to BofA are no longer properly functioning – that yield at least 10% points above Treasuries, as well as loans that trade for less than 80 cents on the dollar, have swelled to $533 billion. This is more than double from the March 6 total of only $214 billion. And, according to UBS, if one adds across all company debt globally, including loans to small- and mid-sized companies that rarely if ever trade, the distressed pile could top $1 trillion. And yes, that number is only going to surge.
An analysis via Trace shows that the amount of distressed bonds has surged to the highest level since the financial crisis, surpassing the oil/manufacturing recession of 2016.
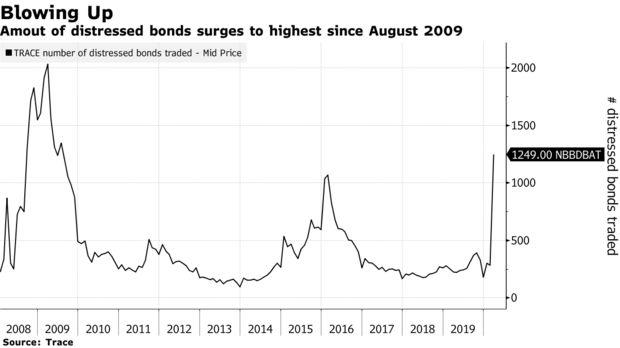
“We could see this be worse than 2008,” said Bloomberg Intelligence analyst Philip Brendel, in what may be the understatement of the day.
While currently most of the distressed debt comes from U.S. shale companies that have been pummeled by the all-out price war between Saudi Arabia and Russia as most companies are now cash flow negative and unable to service their debt obligations, analysts expect this solvency (and liquidity) crisis to spread to all industries the longer the US economy remains in a state of shutdown.
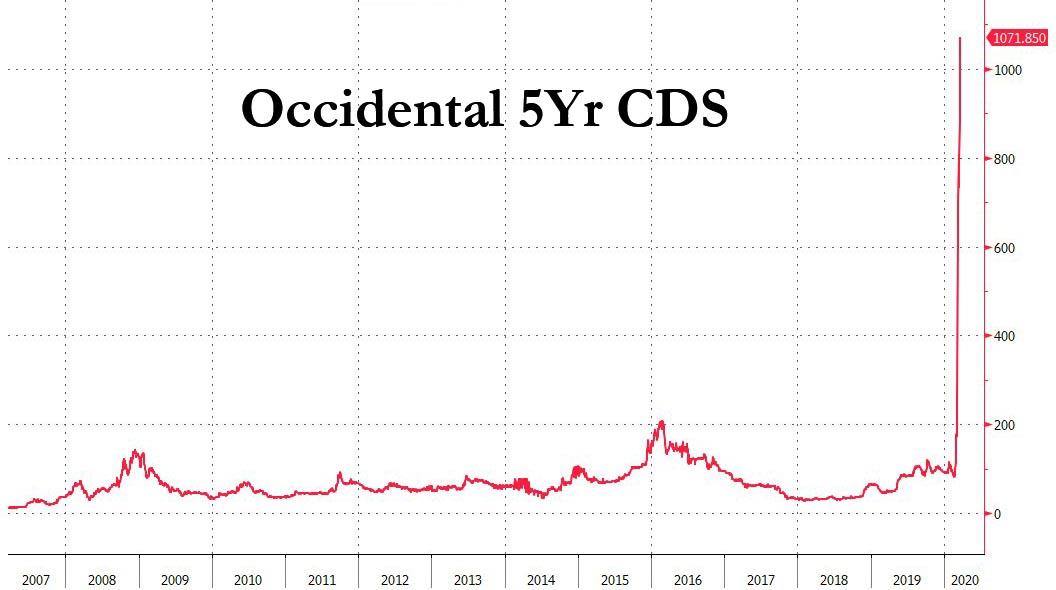
The amount of the oil and gas sector’s distressed debt now stands at over $128 billion, and is expected to rise substantially higher. One of the biggest casualties has been Occidental Petroleum Corp., which has seen its funding costs skyrocket and its credit rating cut to junk; its bonds due in 2024 now yield 18.6% and trade at just 54 cents on the dollar. In early March, they sold for above par. Meanwhile OXY’s CDS trade as if there is a 65% chance the company will go bankrupt in 5 years.
Energy is just the harbinger however, and the amount of distressed debt in the retail, entertainment and lodging industries, among others, has also surged as economic activity comes to the virtual standstill because of the coronavirus.
“The speed of change is definitely unprecedented,” said UBS credit strategist Matthew Mish. “It’s obviously consistent with the change in investor perception around mobility and essentially the fact that the economy, particularly in the U.S., but globally has ground to a halt.”
Bank of America agrees, and in a report published this morning, its credit analyst Oleg Melentyev says “we think this credit cycle has turned and expecting default rates to rise meaningfully in coming months.”
Only a week ago, we summarized all key leading indicators of credit stress in a table below, where we compared the current level on each one of them, to the point in time closest to it going into the two previous credit cycles. Marking Apr 2001 and Sept 2008 as the points of no return corresponding to 1,000bps levels on the HY index, we argued that the whole collection of indicators was about 3-4 months away from such threshold, where a turn in the credit cycle becomes inevitable and irreversible.
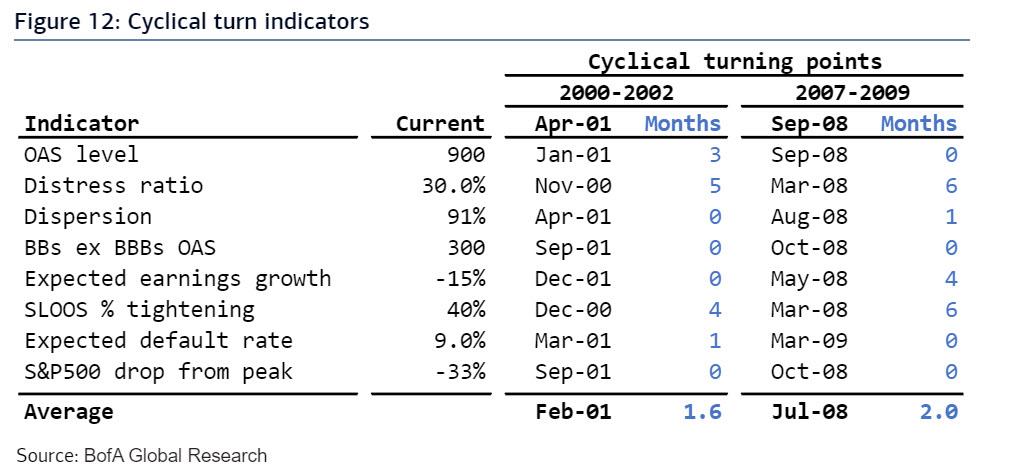
BofA’s conclusion: “As things continued to move at lightning speed over the past several days, those same indicators are now averaging only 1.5-2 months of cushion before they reach such a point. Based on those timelines, today’s market environment is equivalent to Feb 2001 and Jul 2008.“
Tyler Durden
Fri, 03/20/2020 – 12:20
via ZeroHedge News https://ift.tt/2WvIvww Tyler Durden