Taleb’s Turkey Gets The Chop: Equity Positioning Crashes To Lowest On Record
Once upon a time, Nasem Taleb famously showed a chart showing phase discontinuity as represented by the well-being of a turkey, which has a delightful life for 1000 days, and then on day 1,001, i.e., Thanksgiving… “surprise.”
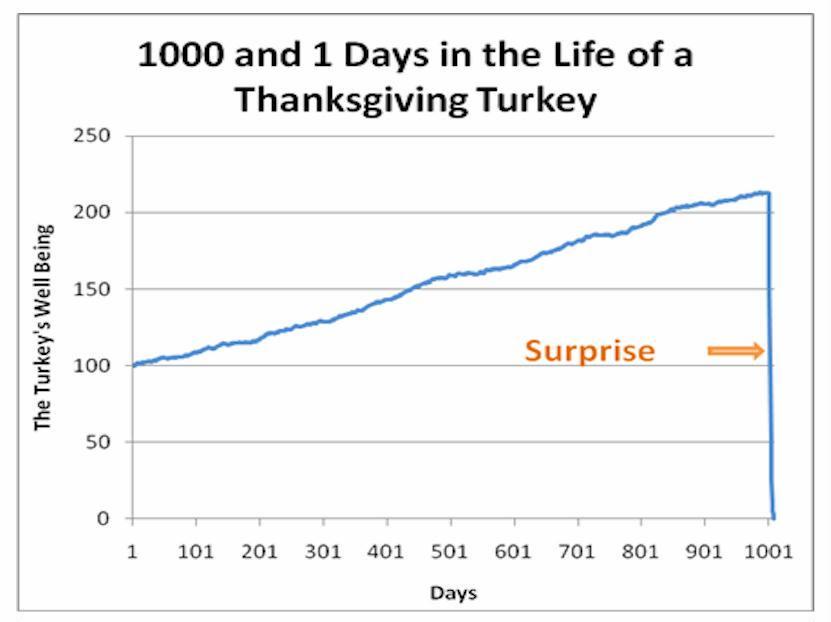
The exact same thing just took place in the market.
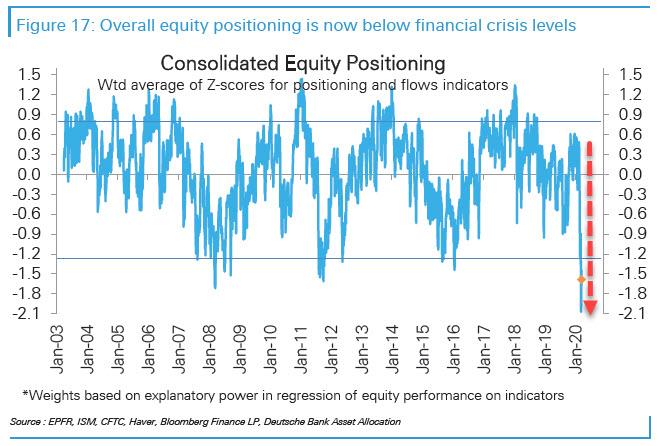
Two months ago, in mid-January, we lamented the fact that everyone had gone all in – a clear warning that a reversal was imminent- and pointed at Deutsche Bank’s tracker of consolidated equity positioning which had just hit an all time high.

Fast forward to this week when Thanksgiving struck, and as DB’s Parag Thatte writes in his latest Investor Positioning and Flows report, “last week our consolidated equity positioning indicator had fallen to financial crisis lows. It has now fallen further and is the lowest in our data going back to 2003.”

… and a longer-term picture.
In light of last week’s unprecedented market moves, the arrival of the “Taleb turkey moment” will hardly come as a surprise, although when seen in charts, it is nothing short of stunning.
First, some preliminary thoughts from Thatte who notes that “rising volatility and correlations across all asset classes have
seen leverage being cut, with positions moving towards neutral from both the long and short side.”

As a result, Thatte calculates that for CTAs, net exposures are now in the 5th percentile…
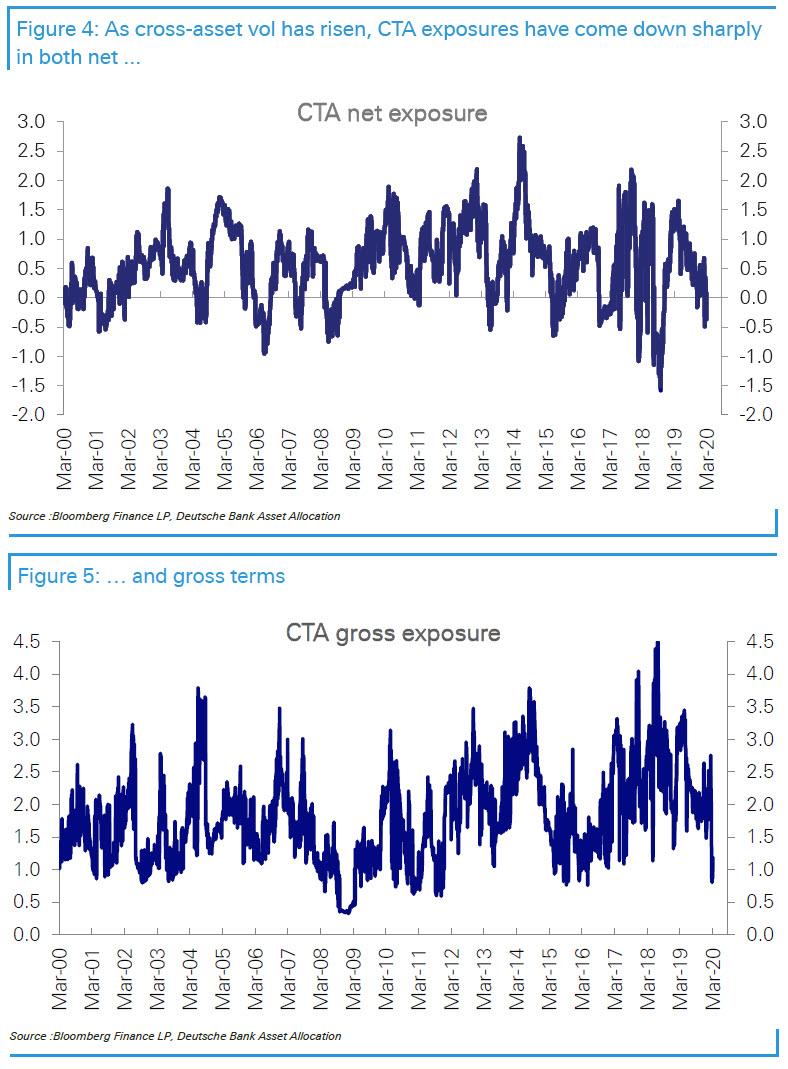
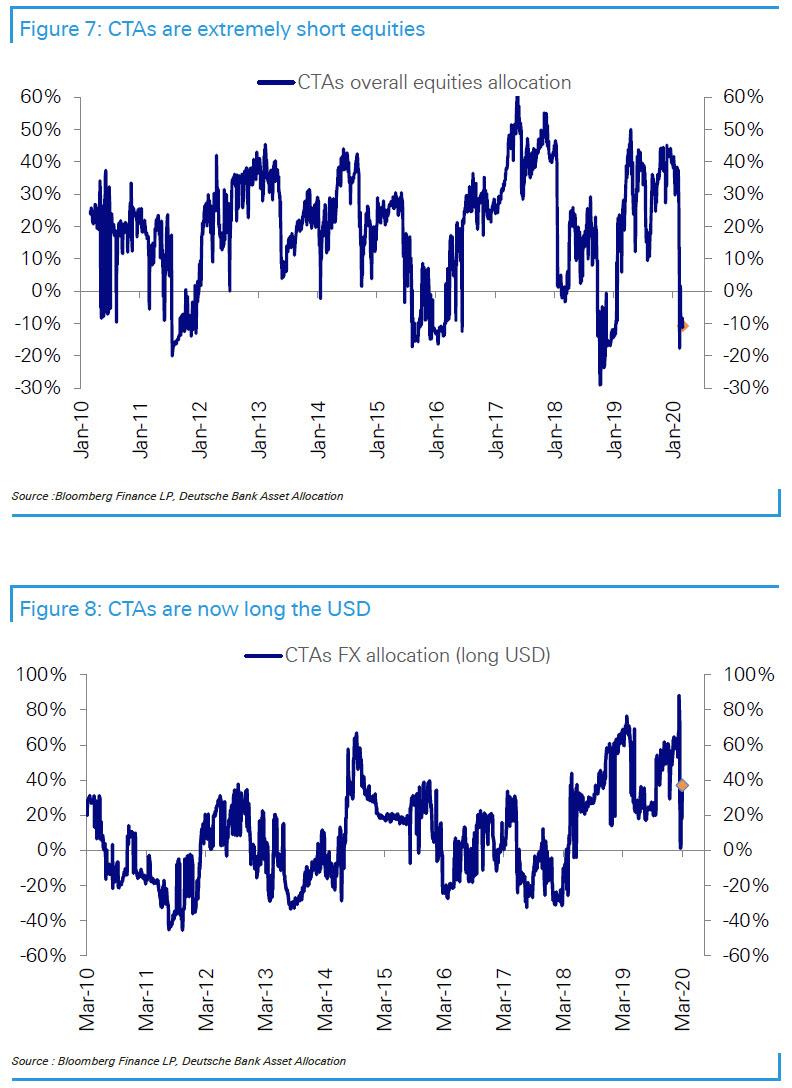
… while gross exposures are in the 20th percentile.” In fact, according to DB, CTAs are now very short equities, neutral bonds and Gold, and long the USD, which explains why they have been making money as the market continues to plunge.
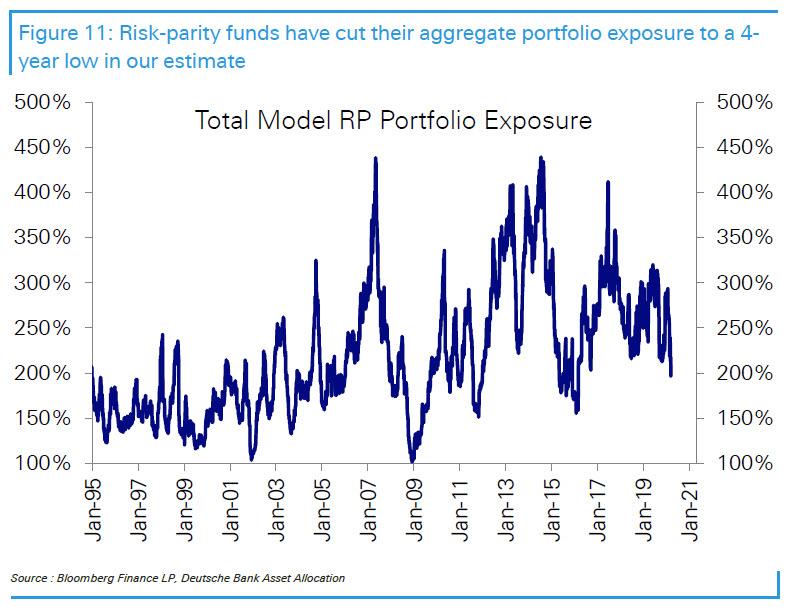
At the same time, Risk-parity gross exposure – which got hammered after the biggest ever VaR shock in history – is now “at its lowest since early 2016 and in the 20th percentile looking back to 2005.”
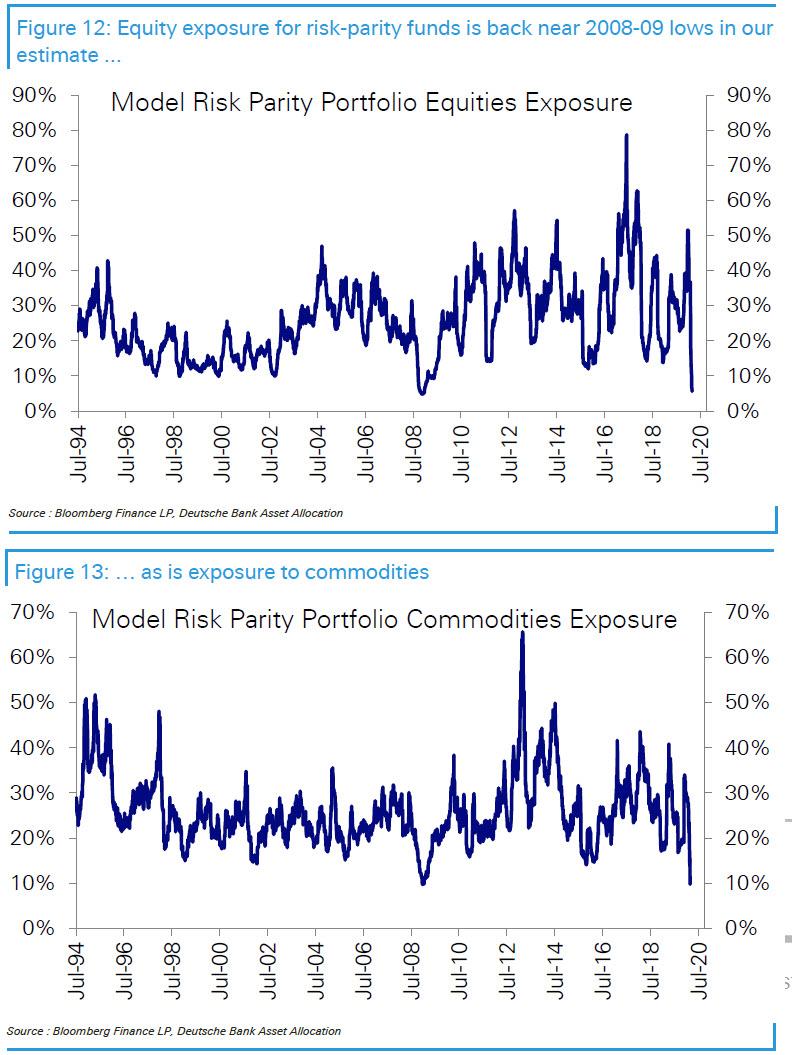
Separately, risk-parity equity and commodity exposures “are now at financial crisis lows, while bond exposure is near the lows of this cycle”, according to DB.
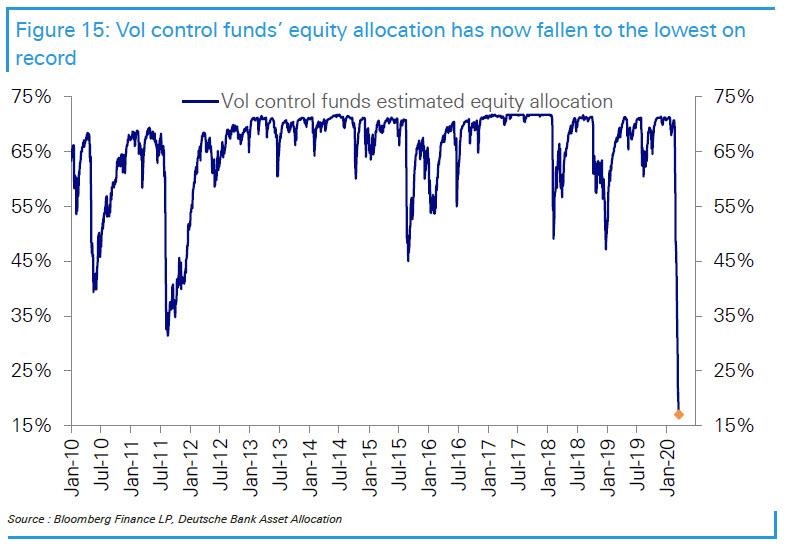
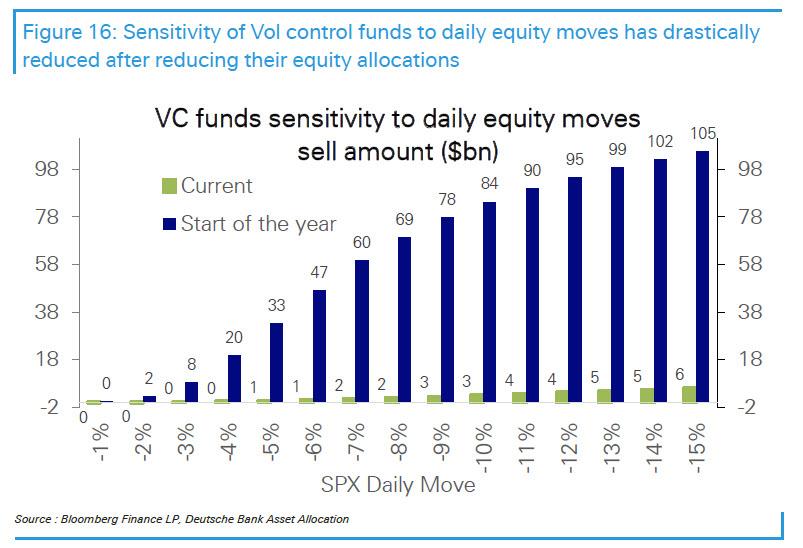
But that is nothing compared to the sheer implosion of vol control-fund equity allocations, which as a result of the record spike in the VIX is now at just 15%…
… the result of an unprecedented surge in observed equity vol vs implied target vol…
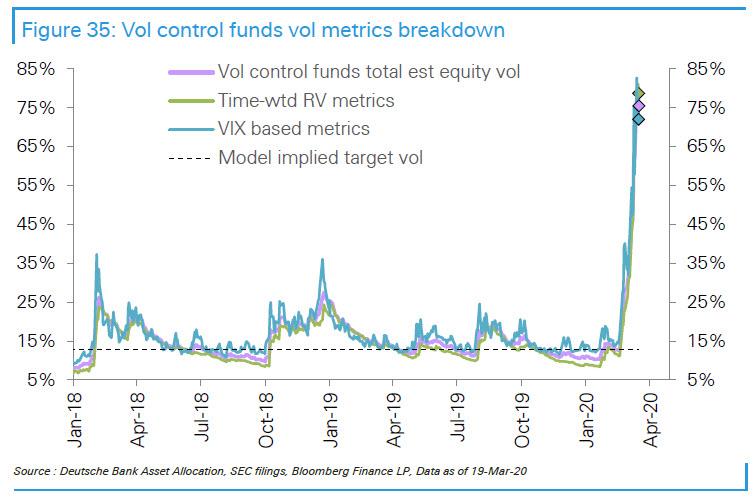
… and as such, vol control equity positions are now so low that it would take a -6% equity selloff for them to incrementally sell $1bn in exposure, a far cry from the beginning of the year when such a selloff would have prompted them to sell fifty times more.
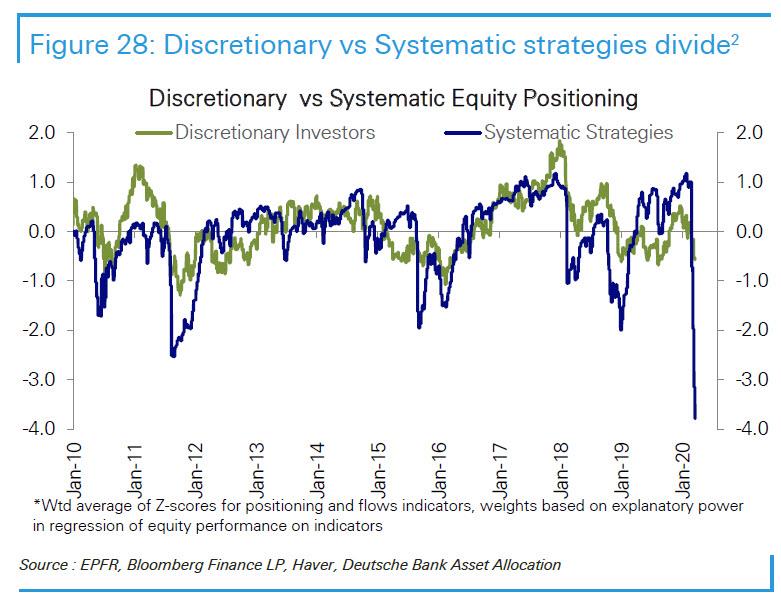
In short, for once all those complaining about the “algos”, i.e., systematic funds dumping everything, were right, as the following comparison between discretionary and systematic positioning shows:
Aside from systematic funds, the puke can be seen in plain vanilla retail funds as well, which we highlighted on Friday showing the record redemptions from virtually every asset class, but for those who missed it, here it is again.
As DB notes, amongst several records recently, one that has stood out is the enormous outflow from bond funds at -$109bn this week, bringing outflows over the last 3 weeks to almost -$150bn.
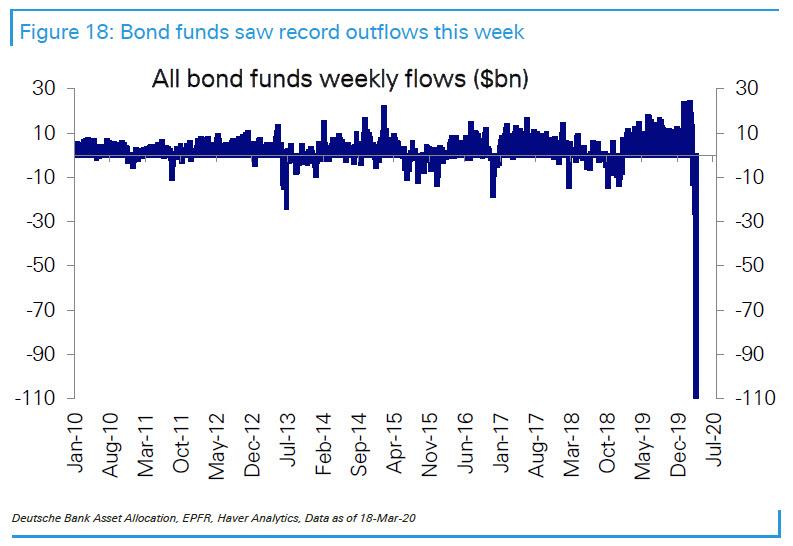
Apart from short-term government bond funds (+$9.2bn) almost every other category of funds saw outflows including intermediate- (-$3.6bn) and long-term government bond funds (-$5.4bn).
Credit funds especially suffered with IG (-$18.4bn) as well as HY (-$11.9bn) seeing record outflows.
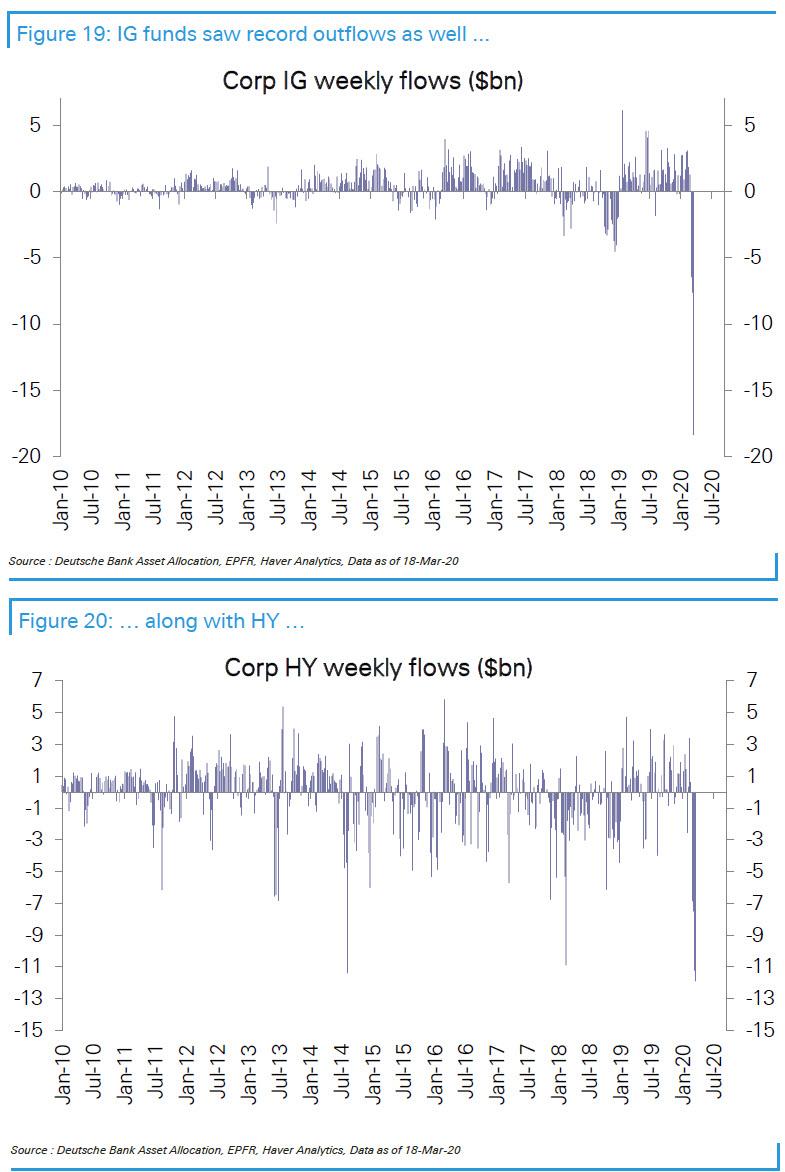
HY had also seen large outflows during the 2015-16 slowdown and cumulative flows over this cycle (since 2009) are now net negative (-$29bn). IG funds, on the other hand, had been the biggest beneficiary of inflows in this cycle, and the recent record outflows have barely scratched the surface with cumulative inflows still at an enormous $312bn.

Not everyone is being redeemed out of existence. Assets in money-market funds – which the Fed backstopped last week – have surged over the last 3 weeks by a record $300bn, including $160bn just this week, also a record. The overall figures hide a wide divergence between money-market funds dedicated to government securities, which have seen almost +$400bn flow in over 3 weeks ($250bn this week), compared to prime funds, which have seen outflows of -$89bn (-$85bn this week).
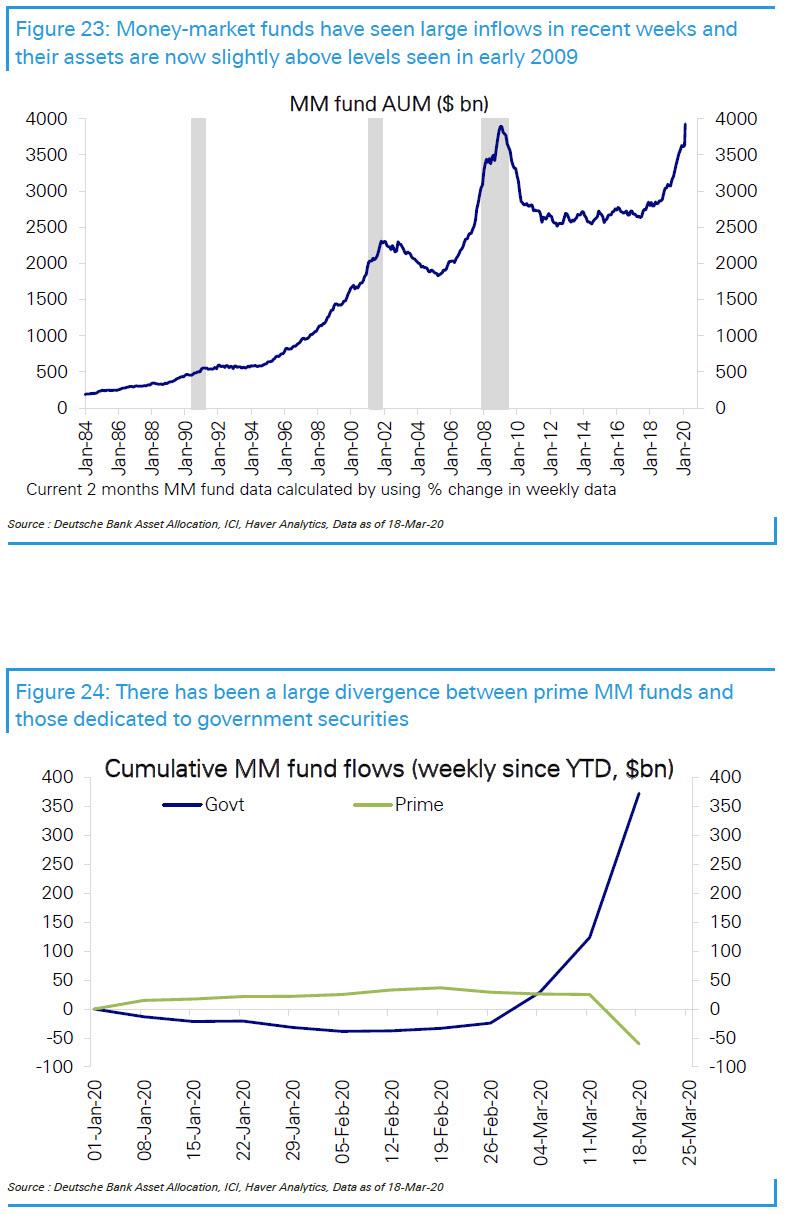
This divergence is reflected in the extreme stress in commercial paper markets. Overall money-market fund assets at over $3.9 trillion now slightly exceed the level seen at the last peak during the financial crisis in early 2009. However, as a proportion of personal income or GDP, it is well below the highs seen during the last 2 recessions, suggesting that the inflows into MM funds could go further as the panic “run” away from all other asset classes accelerates.
We saved the worst for last: two weeks ago we warned that liquidity and short interest are at all time lows just as buybacks are plunging. Unfortunately, since then, while there has been some covering in marketwide shorts…

… liquidity…
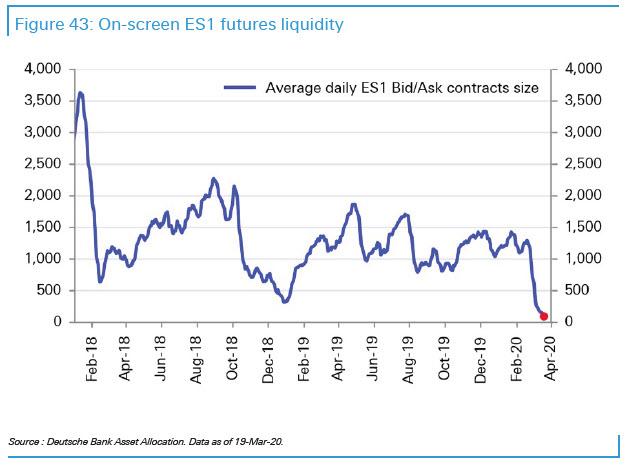
… and stock buybacks…
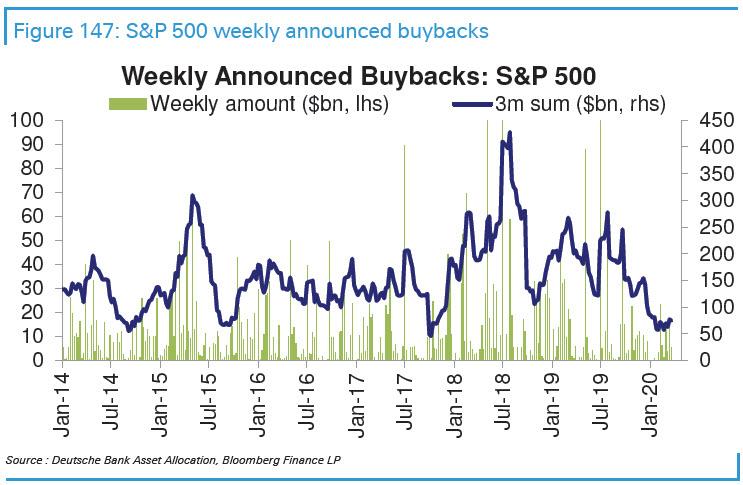
… have only gotten much worse and until there is a clear reversal in any of these trends, the bottom in the market will be a long way off.
Tyler Durden
Sun, 03/22/2020 – 14:20
via ZeroHedge News https://ift.tt/2J4nkcU Tyler Durden