The State-By-State Toll Of Coronavirus On The Job Market
Courtesy of Joseph Brusuelas of the Real Economy Blog and Wallet Hub
The widespread layoffs of American workers worsened in the third week of the coronavirus shutdown, with all states (with the exception of the Virgin Islands) now having reported a significant increase in initial jobless claims at some point during the three-week period.
This strongly suggests that Congress will have to make state and municipal finance a policy priority to prevent a spillover of the recent carnage in the labor market into the public sector.
Nationally, there were 6.6 million initial jobless claims for the week ending March 28 on a seasonally adjusted basis. That amounts to a nearly 300-standard-deviation shock to the labor force that is likely to have a long-run impact on consumer spending and the economy as a whole.
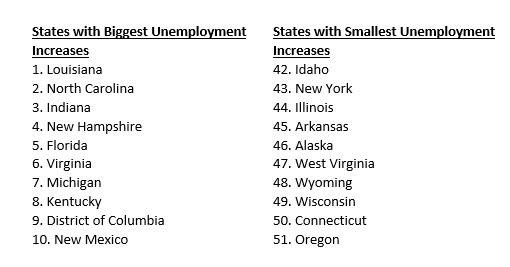
To identify which states have experienced the largest unemployment increases, WalletHub compared the 50 states and the District of Columbia across two key metrics. These metrics compare initial unemployment claim increases for the week of March 23, 2020 to both the same week in 2019 and the first week of 2020. Below, you can see highlights from the report, along with a WalletHub Q&A.
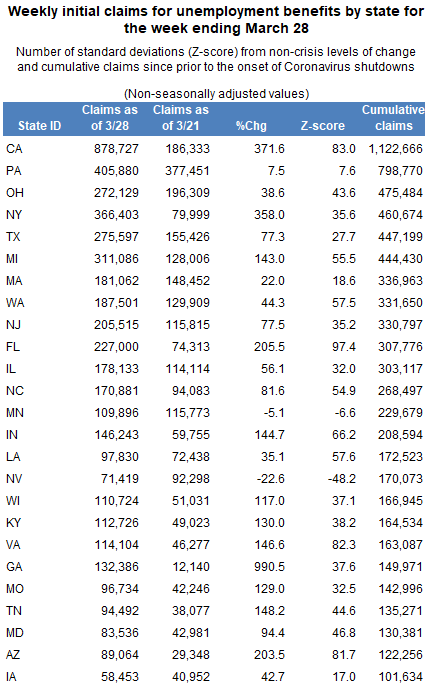
Nevada, Minnesota, New Hampshire and Rhode Island reported fewer claims in the latest week of reporting (March 28) than in the first week of widespread layoffs, but that’s not to say things are getting better.
For example, Nevada reported 71,000 initial claims in the week ending March 28, versus 92,000 in the week ending March 21. By comparison, the average number of claims in Nevada was 2,900 per week in the pre-crisis period.
And Minnesota reported 110,000 initial claims in the week ending March 28, versus 116,000 in the week ending March 21. By comparison, the average number of claims in Minnesota was 4,300 per week in the pre-crisis period.
Also discouraging is that 6,000 of those claims involved plant closings during the month of March, as reported by Minnesota Department of Employment and Economic Development, which suggests that the impact of the virus is moving beyond the service sector.
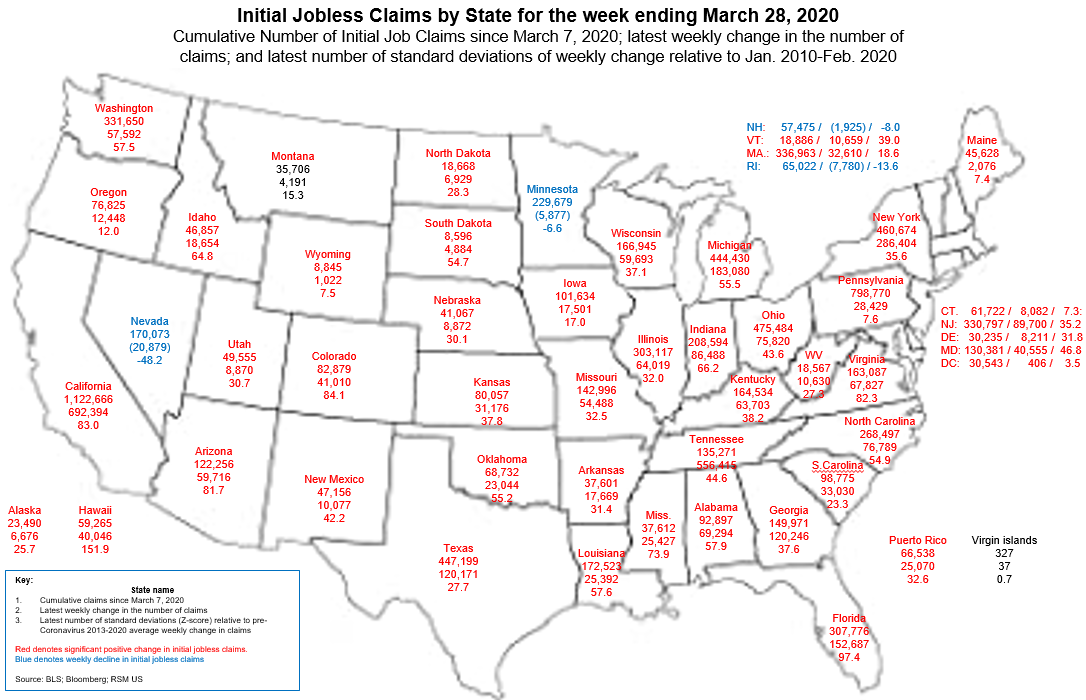
The map below shows three numbers below the state name:
- The cumulative number of initial unemployment claims since March 7, the before the effect of shutdowns began in earnest.
- The latest increase (decrease) in the number of claims.
- The Z-score of the latest increase (decrease) in claims, which is the number of standard deviations above (below) the pre-coronavirus average.
The first number indicates the depth of the impact of the virus on the labor force.
The second number indicates the direction of the claims (i.e., a first derivative of sorts): Positive numbers indicate an increase in claims and labor market distress; positive numbers approaching zero indicate the deceleration in new filings; zero would suggest a plateauing of claims; while negative numbers are an indication that businesses and employees are returning to normal.
The third number shows the unprecedented degree of the shock, with Z-scores outside the range of plus-or-minus two standard deviations considered to be outside of normal occurrences.
Tyler Durden
Thu, 04/02/2020 – 23:40
via ZeroHedge News https://ift.tt/3aQgfcp Tyler Durden