Will The S&P Retest The Lows? It Depends On Whether This “Battle Line” Is Breached
Until today’s catastrophic economic data – which saw industrial production, housing, retail sales, and New York manufacturing all plunging at or near record levels and which sent stocks sliding – some Wall Street strategists had become confident that the worst of the crisis is behind us and the market lows are in, if for now other reason than last week’s 10% torrid rally in the S&P, almost as if those retail traders who were caught in the most vicious short squeeze in history “knew” something instead of merely scrambling to close out losing positions.
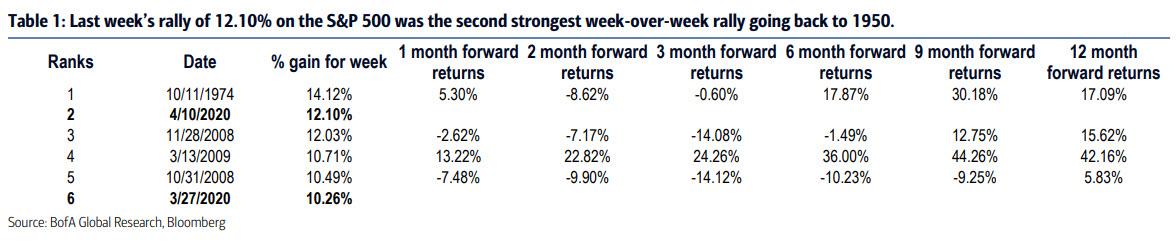
Whatever the reason, however, last week’s rally of 12.10% on the SPX was the strongest since October 1974 using data back to 1950. And while price always makes the narrative, it is worth noting that weekly rallies of 10% or more from 1974 and 2009 came on the moves off of the lows, while the 2008 rallies were part of a larger bottoming process that saw undercuts of the lows. Yet one reason why in this case the recent torrid rallies may not be the full story is because as Bank of America’s chief technician, Stephen Suttmeier writes, “the two weekly rallies of 10% or more over the last three weeks resemble the two 10% up weeks from October and November 2008, which were part of a bottoming process with the ultimate low not seen until March 2009.”
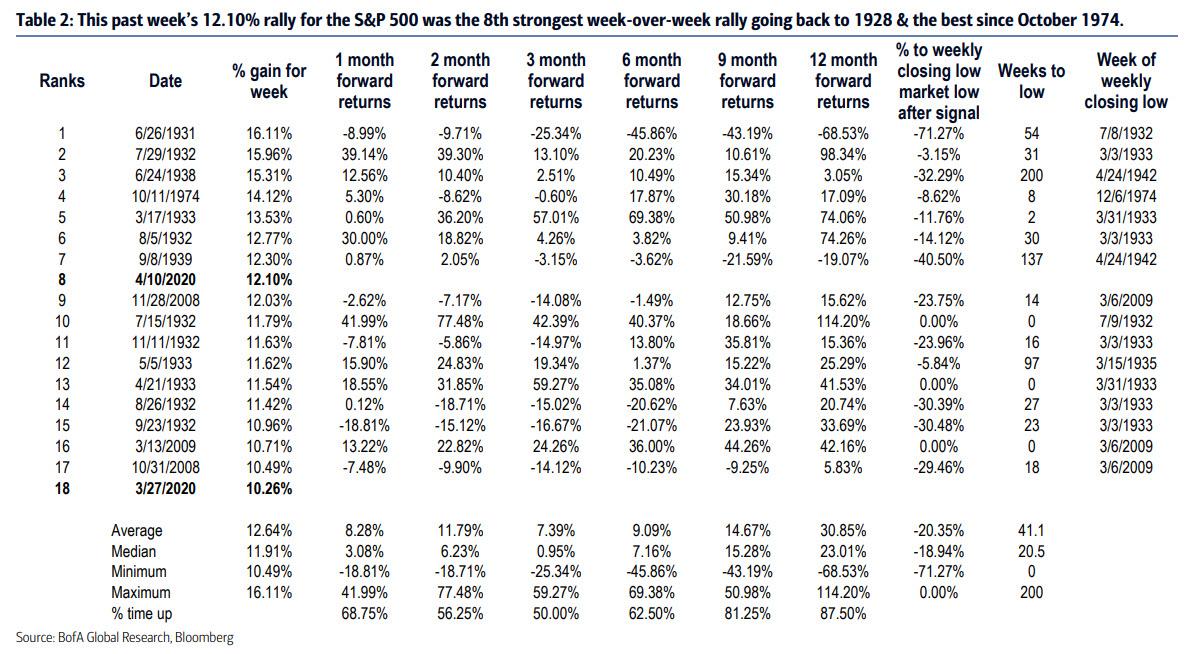
Some more bad news for the optimistic bottom callers: since 1928, the SPX has had 18 week-over-week rallies of at least 10%. Last week was the 8th strongest week for the SPX. These 10% rallies can occur as part of a bottoming process, but as BofA notes, do not mark the ultimate low most of the time. While the forward returns after a 10% up week are strong going out to nine and 12 months, 13 out of the prior 16 observations (many of which were during the Great Depression) experienced drawdowns. Furthermore, ten out of the 16 signals prior to 2020 saw double digit drawdowns after the signal and only three did not experience a drawdown. Average and median declines into the weekly closing lows after 10% up weeks were -20.35% and -18.94%, respectively.
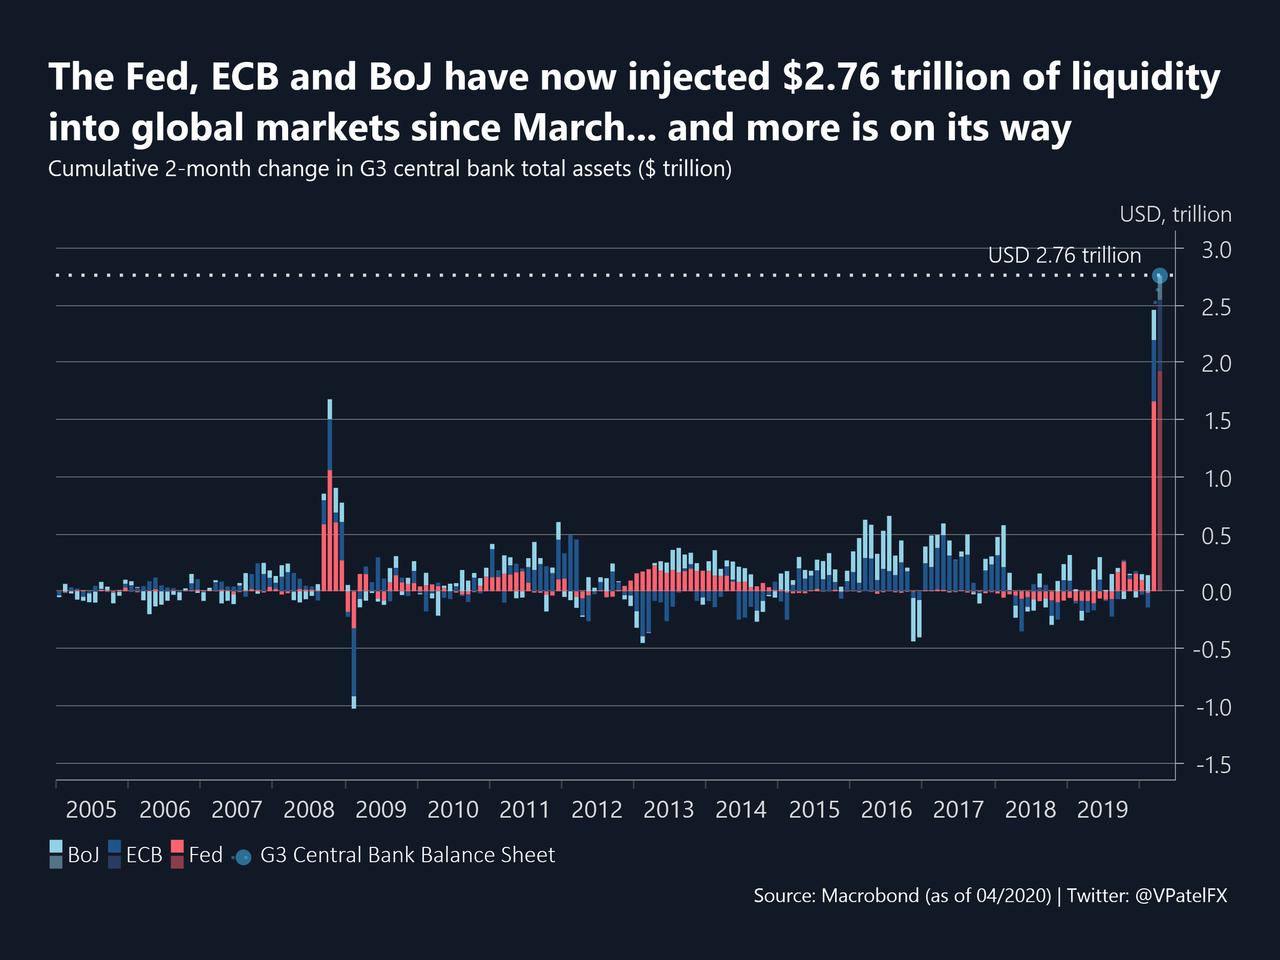
Of course, with just the big 3 central banks injecting a record $2.8 trillion since March (and much more coming) it is safe to say that this time will be different.
And while the simplest “investing” decision at this point is to simply follow what the Fed does, as Blackrock has decided to do for the foreseeable future, for those who instead believe that the future can be predicted by looking at charts, BofA’s Suttmeier writes that while the SPX tests 50% retracement, a major clash will emerge as the S&P hits big resistance around 2800-3027.
As Suttmeier explains, after a second 90% up day on the rally from late March pushed the S&P 500 above its 200-week moving average (MA) near 2652, the next target is resistance at 2792-2880 (50% of the 2020 decline and 100-week MA). While the SPX achieved this level last week, the 2800-3027 area, which was where the S&P 500 built its bullish triangle ahead of the 4Q breakout and rally into mid 1Q 2020, it is the” big battle line resistance that may offer a powerful source of supply as those who bought the SPX in late 2019 seek to get out of the market closer to even.”
And while stocks will have big trouble breaking out above the major resistance zone, the question remains whether the SPX will or will not retest the lows. The answer, according to Suttmeier, is that if investors sell into the 2800 to 3027 resistance zone, “the potential for a retracement of the 20%+ rally from 3/23 increases.”
The best case would be that the SPX holds its 200-week MA near 2650 (4% from the 4/13 close), but a retest or undercut down to the December 2018 and March 2020 lows near 2346-2191 (15-20% from the 4/13 close) and even to the 2016 Presidential Election and UK Brexit vote lows in the 2083-1991 (24-28% from 4/13 close) is not ruled out. Tactical supports: 2571-2522 (4/6 upside gap), 2450 (chart support) and 2344-2300 (upside price gap from the 90% up day on 3/24)d
Of course, we live in a world where fthe Fed has just made sure that undamentals no longer matter; so if anyone out there actually believes that some squiggles on a chart can launch the next war with the US central planners, more power to them.
Tyler Durden
Wed, 04/15/2020 – 13:50
via ZeroHedge News https://ift.tt/34Erz8S Tyler Durden