This Is Where The World Is On The “Corona Curve” At This Moment: Over The Hump
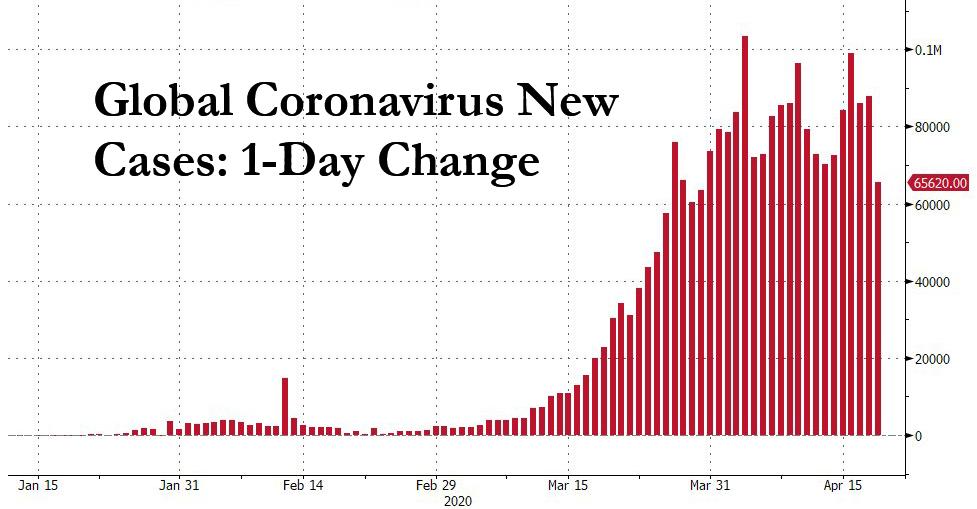
After weeks of “climbing the coronacurve“, we finally have some good news – we are now officially over the hump “tipping point.” The global infection growth slowed from 90% W/W to just 38% W/W in the last fortnight (total infections: 2,157,108, deaths: 143,844, 6.7% mortality rate), and the number of global new daily cases has dropped to 65.6K, the lowest since the end of March.
This means that according to JPMorgan, most early entrants have now passed or are nearing, the infection peak. The following three charts show the snapshot of the “curve” over the past three weeks.
First, this is what the curve looked like on March 24, when only China was in the recovery phase (at least according to its fabricated data).
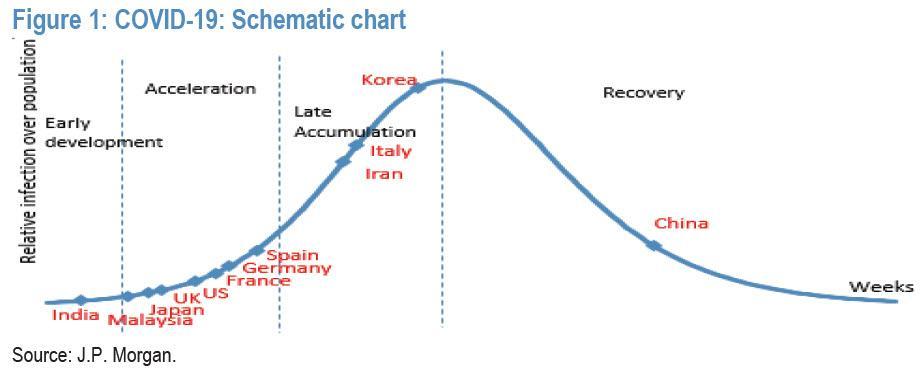
Then last week, both Korea and Germany had passed over the curve apex.

Fast forward to today, when the number of countries in the recovery phase has jumped and now includes also Australia, Malaysia, Spain and Thailand, with Italy just shy of apexing.
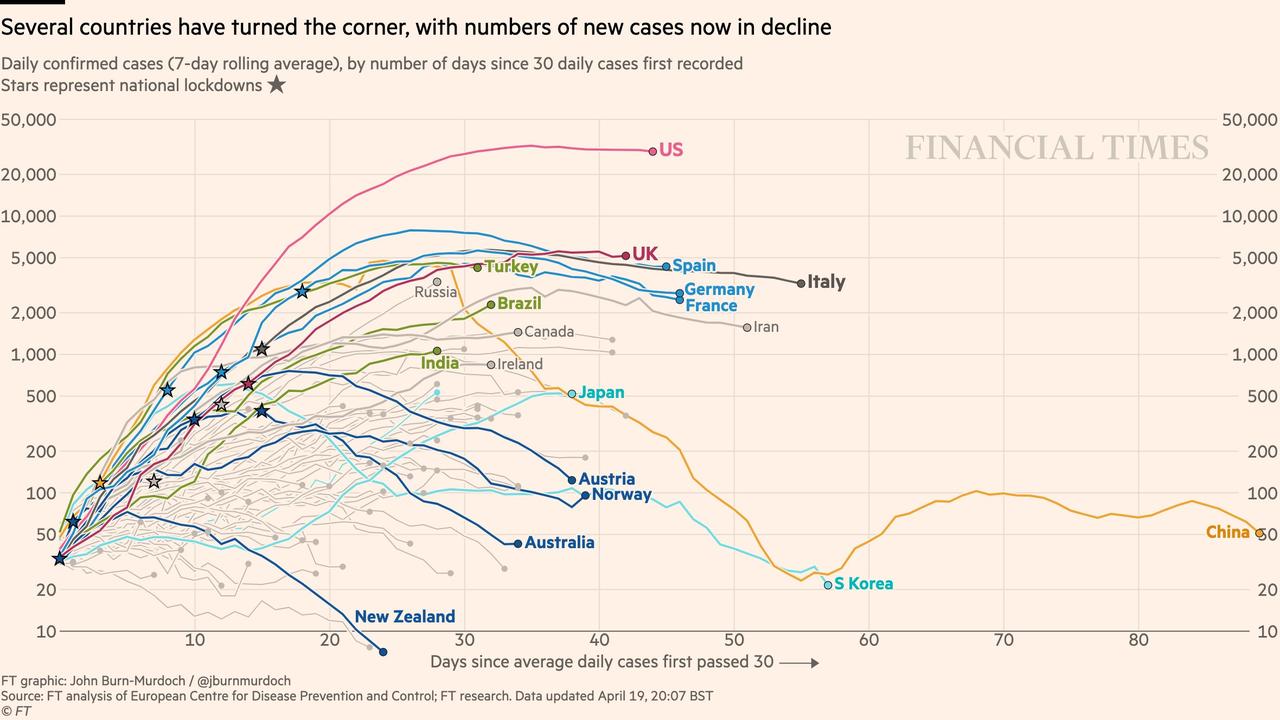
Showing the number of new cases on a log chart confirms the good news that a plateau appears to have been reached.
And so with many of the world’s countries in or near recovery, the focus shifts to the “exit plan.”
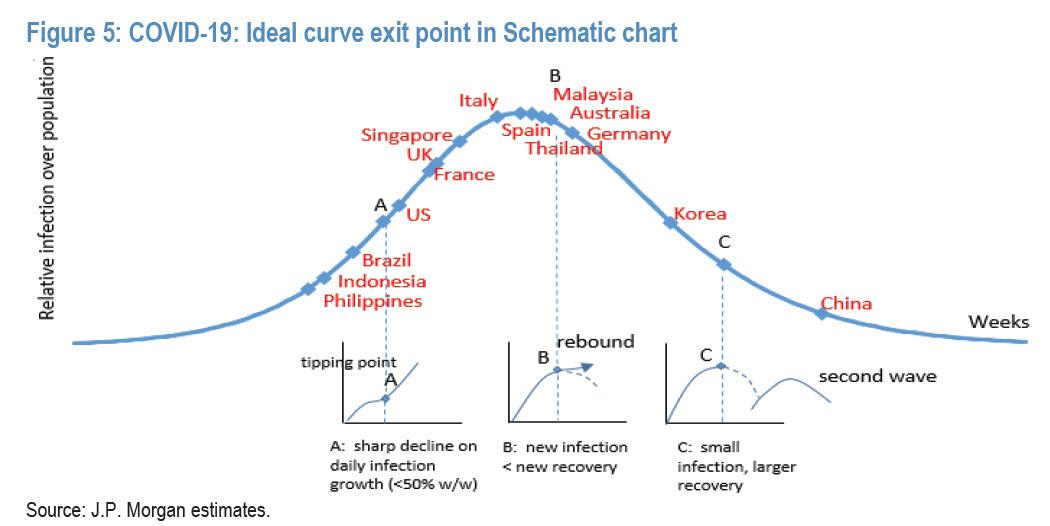
As JPMorgan’s MW Kim writes in his weekly update, emergency treatments such as lockdowns and strict social-distancing have been strong curve control solutions, but are proving costly. As a result, he proposes considering three social distancing relaxing checkpoints:
- infection growth rate slowdown (checkpoint A),
- net infections start to decline (checkpoint B),
- midpoint of recovery stage (checkpoint C).
These are shown in the chart below:

The optimal stakeholder/social “utility function” determines which of the three is the most plausible economic re-opening checkpoint. In Kim’s view, point C is safest, but point B could be acceptable as long as infections are managed within hospital capacity.
- Point A: This is the spot where growth of net infections (= total infections – total recoveries – total death) consistently stays below 50% W/W. Based on backward calculation on the secondary infection rate in China and Korea, JPM estimates an average secondary rate (Ro) is around 2.0. Thus, once the net infection growth rate for a week has stayed below 50% W/W, it would imply high single-digit daily infection growth rate potential. In other words, new infections become small and recoveries are developing. Considering about 2-3 weeks of the virus cycle from symptoms to release, it would be viewed that the curve is in early control stage. Under the assumption that the trend would continue, discussion on relaxed forms of social distancing could be started. The risk of point A is that as daily recoveries are small and new infections are in early control, increasing social activities through the relaxation of social distancing would create possible “acceleration” of the infection curve which would put great pressure on hospital capacity and future public healthcare interventions as a “U-turn” on policy that re-introduces stricter social distancing until the curve is in better shape is deemed to be more costly. This sudden jump of the infection tally amidst the curve control stage is called a “tipping point”, recent infection statistics in Singapore could be good evidence, although we could see soon if the curve is to be in better control again.
- Point B: This is the spot where total infection growth is below low single-digits or when net infections start to decline (i.e., new infections < new recoveries). As this suggests that a smaller population has newly been in contact with infections and more infections are in the stage of recovery, with aggressive virus testing and a certain degree of social distancing, the curve could continue to move toward a recovery trend. In this curve stage the utility function could be optimised with relatively milder disagreement among stakeholders. At this stage, as total infections/ susceptible is largely under control, the curve could face potential acceleration of the infection tally, and risk would be a possible "rebound" on the curve.
- Point C: This is the curve in the full recovery stage (i.e., very few new infections, more recoveries). If there is a strong conviction that infection is only a one-time event with one curve, this could be the ideal strategy. Closing the curve clearly means that the society could remove future uncertainties related to infection risk. However, as most view that COVID-19 could last in society until a vaccine is fully available to the public with a possible series of infection waves, this could be a relatively safe point to resume the economy, although the overall level of hospital capacity and guidance on relaxed forms of social distancing would be of added importance. Compared to point A or B, the risk on curve control should be lower at point C. The caveat is that, even though re-opening of the economy resumes at this point, it does not mean that society would fully close the curve. Thus, the risk of a second wave could be a possible scenario. Perhaps, the infection curve in the real world would be similar to the one below.
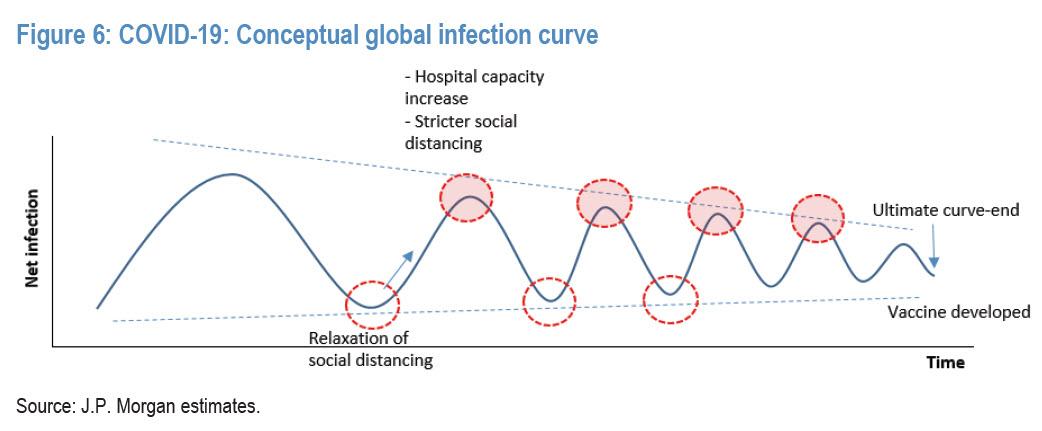
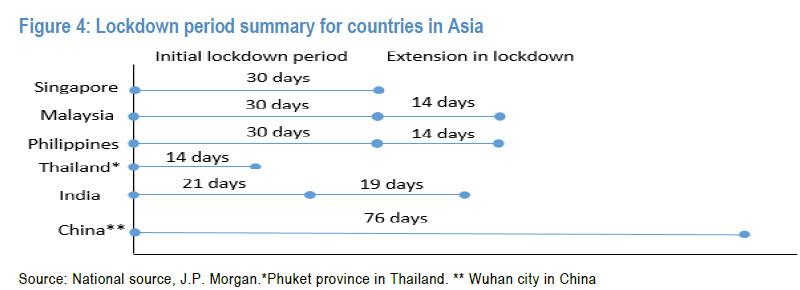
Once society takes the underlying assumption that the risk of a series of waves persists, navigating the ideal exit point for reopening the economy (or relaxation of social distancing) should be needed. It should be noted that, particularly in Asia, overall lockdown periods are now generally matching with COVID-19’s life cycle (i.e., up to 2 weeks incubation + 3 weeks from symptoms to recovery) and many countries are in the recovery stage. China and Korea are heading to the first curve end. Malaysia and Thailand have just passed the peak point.
JPM also writes that it believes that a COVID-19 vaccine could potentially be under mass production and maybe available to the public in the next 12-18 months even under an optimistic scenario. This suggests that, for a while, the community would bear certain risks on COVID-19’s existence considering the asymptomatic nature, no exact drugs/therapies, and longer latent periods. In that perspective, the strategy of curve flattening should move from costly “closing the first infection curve” to “managing infections within small numbers below hospital capacity factoring in series of outbreak scenarios”. In this way, potential mortality spikes due to limited hospital capacity (i.e., ICU beds) could be partially solved.
Tyler Durden
Sun, 04/19/2020 – 19:20
via ZeroHedge News https://ift.tt/3bnpeC0 Tyler Durden