In 2020 Oil-Exporters’ Income Will Plunge By Over $1 Trillion, Forcing Widespread Stock Liquidations
While any other time the plunge of WTI prices into negative territory last Monday would have been the story of the year, the fact that the financial press has already moved on and is focusing on whatever 100-sigma event du jour has hit, merely shows just how insane 2020 has been as a decade of central planning slowly comes unglued thanks to a black swan bat trigger that has shut down the global economy and cash flows while keeping stocks just shy of all time highs.
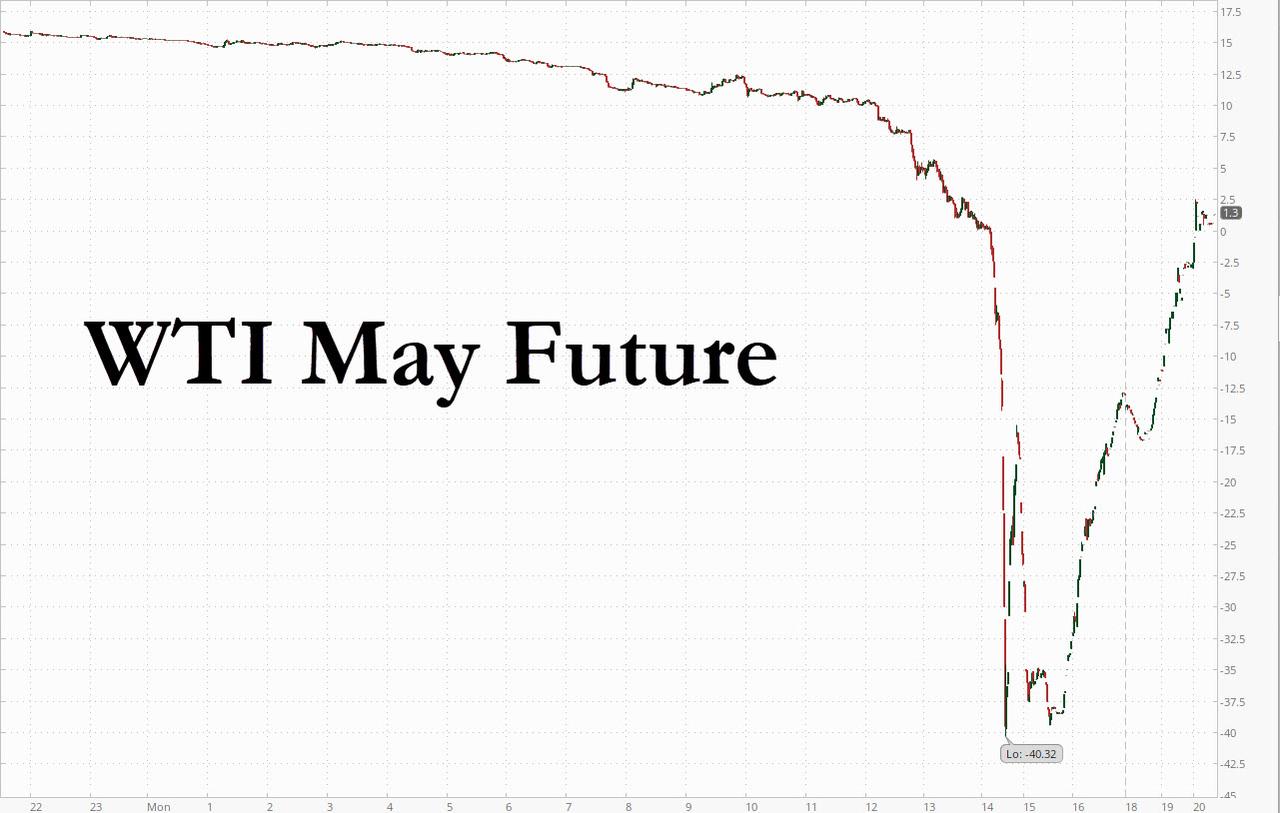
However, before we relegate the historic oil move that sent the May WTI future as low as -$40 on Monday to the dustbin of history, there are some critical considerations that have to be considered, namely what are the implications of much lower oil prices this year for other asset classes? To address this question we will revisit some prior analyses on the shifts in flows and incomes resulting from oil price changes, especially those looking at the consequences stemming from the collapse of petrodollar mercantilism in 2016 when oil exporting nations saw their oil-linked income crater.
By itself the decline in oil prices is generating a big shift in flows and incomes across the world, albeit – at least for now – smaller than the previous big shift seen between 2014 and 2016. According to JPMorgan calculations, oil consumers had spent around $2.2tr in 2019 on crude and related products with an average oil price of $64 per barrel, and in 2020 they are likely to spend less than half of that, i.e. around $1tr with an average oil price of $34 and an assumed big reduction in demand.
This represents a hit to oil producing countries’ incomes of $1.1tr, or 1.4% of global GDP, from the combined effects of an income transfer from the oil price declines and a hit to oil demand. In contrast, in 2014, oil consumers had spent $3.4tr on crude and related products with an average oil price of $100 per barrel, and in 2016 they had spent less than half of that, i.e. $1.6tr with an average oil price of $45 per barrel during 2016. In other words there was a bigger $1.8tr or 2.2% of global GDP income transfer between oil consumers and oil producers between 2014 and 2016.
As we discussed extensively in 2016, the massive and abrupt loss of income for oil producers during the 2015/2016 OPEC crisis had an profound impact on their behavior, especially on their saving and spending. As JPM’s Nick Panigirtzoglou writes, oil exporting countries, i.e. the countries which on net export oil (Middle East, Norway, Russia, African and LatAm), had received $1.6tr from their oil exports in 2014 and saw their oil revenue being more than halved to $770bn in 2016.
These oil exporters’ revenues are typically recycled via two channels: via imports of goods and services from the rest of the world and via accumulation of financial assets mostly through SWFs and FX reserves. And since all of these transactions are mediated via the US Dollar, the resulting cycle has been known as the petrodollar mechanism (or petrodollar mercantilism), one which helped cement the dollar’s role as the global reserve currency.

Some more stats via JPMorgan: In 2014, around 84% or $1.34tr of the $1.6tr oil revenue was recycled via imports and the remaining 16% or $260bn was recycled via SWFs and FX reserves, mostly SWFs. In 2016, 117% or $900bn of the $770bn of oil exporters’ revenues was recycled via imports of goods and services from the rest of the world, $130bn of which was funded by SWF and FX reserve decumulation.
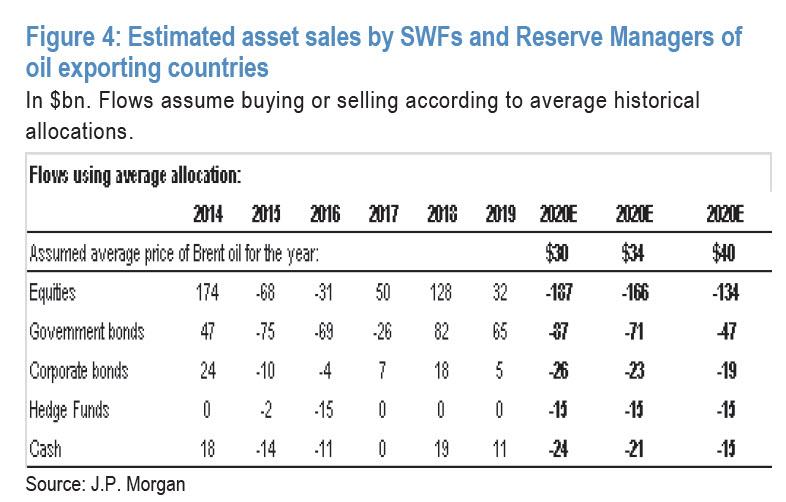
So, between 2014 and 2016, there was not only a substantial $440bn decline in spending of goods and services by oil exporters, but also a similar decline in SWF and FX reserve accumulation. The implications for SWF/FX reserve manager asset purchases were dramatic: previous equity and bond purchases via the SWF and FX reserve managers’ vehicles of oil exporters during 2014 turned into outright sales during 2015 and 2016 as shown in Figure 4.
Well, get ready for round 2.
In 2019 oil exporting countries received around $1.1tr from their oil exports and are likely to see their revenue halved this year. Their imports of goods and services from the rest of the world would certainly decline also, but by a lot less given their already low level after severe declines during 2015 and 2016.
As a result, JPMorgan now expects that these oil exporting countries would have to sell almost $300bn of SWFs and FX reserves, or issue significant amounts of debt to fund a shortfall in oil revenues, this year to prevent their imports from falling below the $800bn level. This implies significant selling of both bonds and equities as shown in the chart above for various scenarios/assumptions about the average oil price for this year.
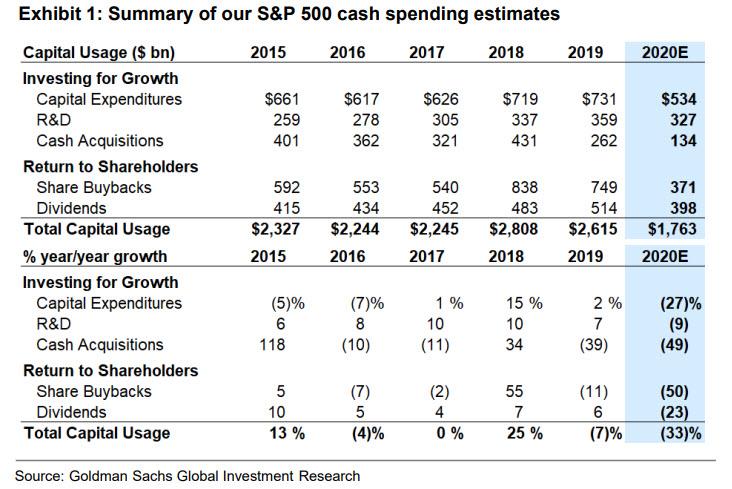
Said otherwise, not only will stock buybacks tumble by as much as 50% (according to Goldman and JPM estimates), but there will likely be roughly $200 billion in forced equity selling this year.
As Panigirtzoglou explains further, the impact from oil income shifts should also be felt in oil companies’ financial and capital investment. Consider that oil companies had spent close to $600bn on capital equipment in 2014, falling to $410bn in 2015 and $280bn in 2016, and then recovering to around $300bn in 2017/2018 and $330bn in 2019. JPM projects at least 20% decline in 2020 to $260bn or lower, a number that is even more aggressive than a similar forecast from Goldman Sachs, which as we noted last week, expect a roughly expects an $200BN drop in capex and a $850BN plunge in overall corporate cash spending.
As a tangent, it is easier to cut share buybacks as financial investment than capital investment. The Oil and Gas industry had spent $57bn on share buybacks in 2013, but since then buybacks were muted, averaging below $30bn per year in the years after up until 2017. The previous long retrenchment in oil companies share buybacks started reversing in 2018 by share buybacks rising to around $74bn before moderating to $65bn in 2019. It is hardly surprising that JPMorgan projects that share buybacks by oil companies will evaporate this year, thus implying a drag of around $65bn for equity markets relative to last year.
What about the flows emanating from oil consumers (i.e., the benefit from lower oil prices)? On previous occasions JPM had noted that the previous $1.8tr windfall seen between 2014 and 2016 was most likely equally split between the residential sector, the industrial sector and the transportation sector. These economic agents had spent a portion of their total $1.1tr oil expenditure windfall eventually but with a lag, meaning that most of that windfall was saved during 2015/2016. These savings most likely took the form of bank deposits which eventually supported bond markets via the banking system deploying these excess deposits into bond markets. As a result, the oil income windfall to oil consuming industries had likely created a bullish flow into fixed income during 2015 and 2016, bigger in size than the fixed income flows resulting from the decumulation of SWF/FX reserves of oil exporting countries during these two years.
However, according to the JPM strategist, these positive bond flow dynamics emanating from oil consumers are unlikely to be repeated in the current conjuncture given the severe cash flow disruption and declines in incomes and with the transportation sector in crisis. But even if these positive bond flow dynamics were to materialize, they would have been less significant relative to 2015/2016 given the current backdrop of unlimited central bank QE.
In summary, the decline in oil prices creates a negative flow for equity markets this year via SWF decumulation and reduced share buybacks by oil companies. That said, the material negative equity flow impulse associated with the latest unwind of petrodollar recycling, is in JPM’s view of secondary importance and is outweighed in size by other institutional or retail investor equity flows, which according to the bank are likely to increase by more than $3 trillion during the last three quarters of 2020 vs. the first quarter. Here, we disagree violently with JPM as the last thing the vast majority of the population – and even the wealthiest 0.1% – will care about is putting their money in the market when they have no idea if they will have a job or what the future holds. Needless to say, if JPMorgan is wrong and this $3 trillion in incremental purchases from institutional and retail sources fails to materialize, the bank’s forecast for new all time highs in early 2021 will be a dream that is as clogged as any pipe heading into Cushing.
Tyler Durden
Sat, 04/25/2020 – 19:30
via ZeroHedge News https://ift.tt/359Vkiq Tyler Durden