WTF Chart Of The Day: “Normal” Versus “Not Normal At All”
Update (1030ET): Sometimes headlines hide just how dramatic the situation really is and putting the delusion into words is hard amid two months of superlatives. However, shortly after posting out macro update, David Rosenberg tweeted the following which everyone should read and consider as they BTFD on the back of The Fed…
“The Conference Board confidence report showed that just 34% of consumers, that 70% chunk of GDP, believes that business conditions are “normal”. That jives with an 18-year high 20x forward P/E multiple how, exactly?”

WTF indeed!
* * *
After plunging in March, expectations were for The Conference Board confidence survey to crash even further in April as COVID concerns began to really rage and lockdowns went nationwide.
The Conference Board’s headline index plummeted by 31.9 points, the sharpest drop since 1973 to its lowest since May 2014…
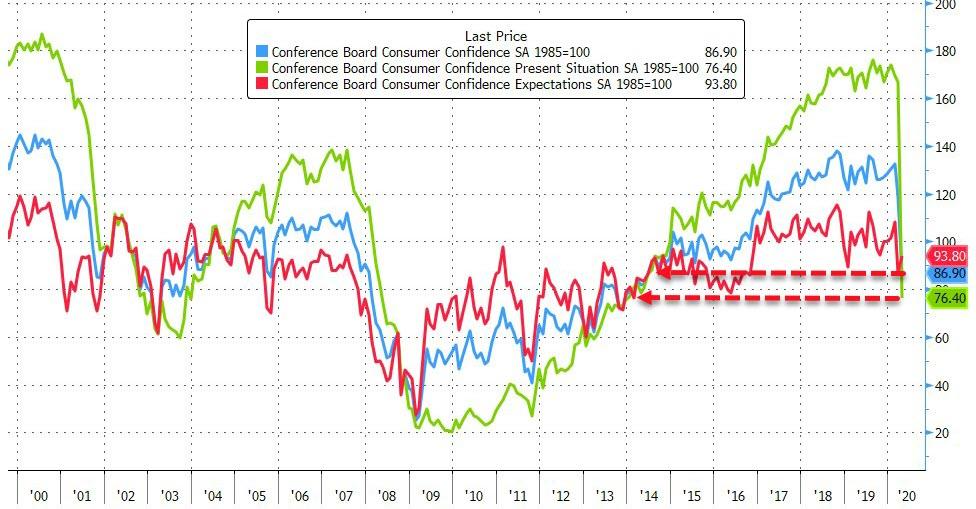
Source: Bloomberg
The Present Situation crashed to 76.4 (its biggest drop ever)…

But ‘hope’ never fails, with expectations rising very modestly from 86.8 to 93.8.
Shifting from American people to American business, The Richmond Fed Manufacturing survey confirmed the utter calamity across businesses in America, crashing to its lowest on record…
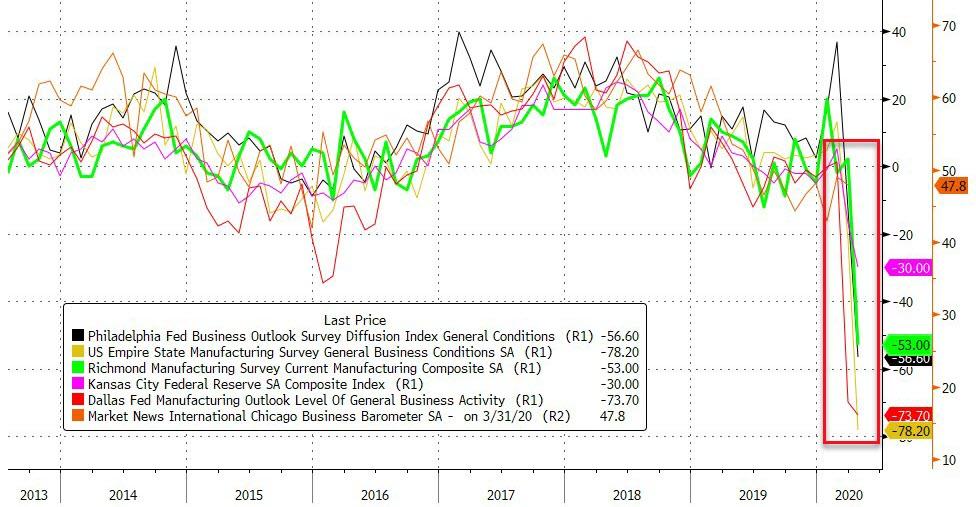
Source: Bloomberg
And finally, what all of that summed up means for the overall PMI… is a disaster

(h/t @Not_Jim_Cramer)
But hey, The Fed’s got your back right?
Tyler Durden
Tue, 04/28/2020 – 10:30
via ZeroHedge News https://ift.tt/2VJMqF1 Tyler Durden