“The Pain Trade Is Clearly Up”: How One Bear Is Hedging The Continued Market Meltup
Tyler Durden
Mon, 06/01/2020 – 14:25
For BofA’s Benjamin Bowler, the past two months have been rough. The bank’s head of derivatives research has been skeptical throughout the recent 35% surge in the S&P, urging clients to fade the rally or simply to ignore it, as highlighted in recent posts:
- The Higher Stocks Rise, The More Fragile The Market Becomes
- “Fade The Rip”: BofA Warns “Bear Market Far From Over Unless We Escape A Recession”
- Here Is The One Indicator That Convinced BofA Another Market Crash Is Coming
To be sure Bowler is not alone, because as the latest BofA Fund Manager Survey showed, a sizable majority (68%) of investors still believe this is a bear market which would make this a bear market rally (arguably one of the fastest on record) despite the S&P crossing the psychologically important 3,000 level and breaking above what historical analogs suggest as bear-rally peaks.
As such, in his latest note the BofA strategist writes that “the pain trade is clearly up”, which reinforced by weak fundamentals (BofA economists downgraded their global growth forecasts again last week following a worsening projection by the IMF earlier in May), means that “the risk is getting forced into chasing a reflexive bubble in a late-stage bear-market rally.”
The liquidity easing provided by policymakers is likely helping to create a disconnect between fundamentals and asset prices, as investors are forced deeper into the risk spectrum. The staggering differential in performance between the market leaders (that have been perceived to be high quality stocks) and the rest of the market, suggests ‘beaten down’ names have plenty of upside room if markets continue marching higher.
Yet refusing to capitulate and join the momentum-chasing crowd (for now), Bowler observes that “markets are able to overshoot historical bear-rally peaks highlights the strength of the post-GFC learned response to ignore fundamentals and not fight policy makers.” However, as he cautions, “hoping that either fundamentals will improve at record speed, or that they simply don’t matter is a real risk, given markets’ inability to decouple from recessions in the last 90 years.”
Hence, in his view the key to trading these markets is risk mitigation – “hedging the pain trade without fully capitulating to the “this time is different” narrative.” To do this, one needs to find the cheapest sources of asymmetry, as despite vols coming down near record speed in this wave of optimism, options purchased outright are still not cheap.
So how does Bowler propose hedging the continued pain trade meltup? Below he lists some of the cheaper hedges that he was encountered in recent weeks:
Too early to own upside in ‘Covid-19’ losers; rent instead
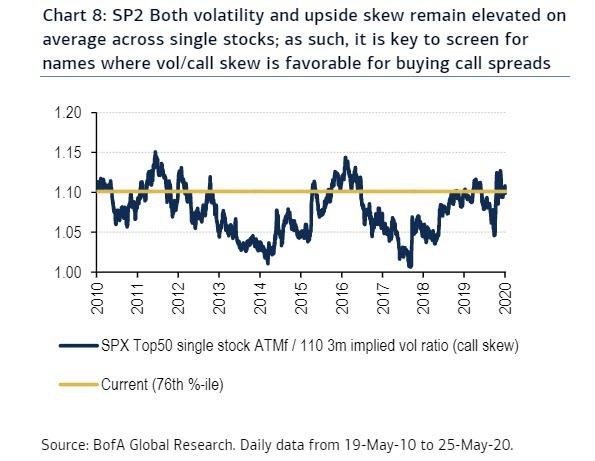
To start, Bowler recommends that investors use options to rent (“rather than own”) upside on the most beaten-down stocks. From a vol perspective, both volatility and upside skew remain elevated on average across single stocks . Hence, we prefer screening for call spread candidates on stocks that are perceived as being ‘Covid-19 losers’, with relatively lower vol, and flat call skew.
Screen for cheap call spreads on beaten-down S&P stocks
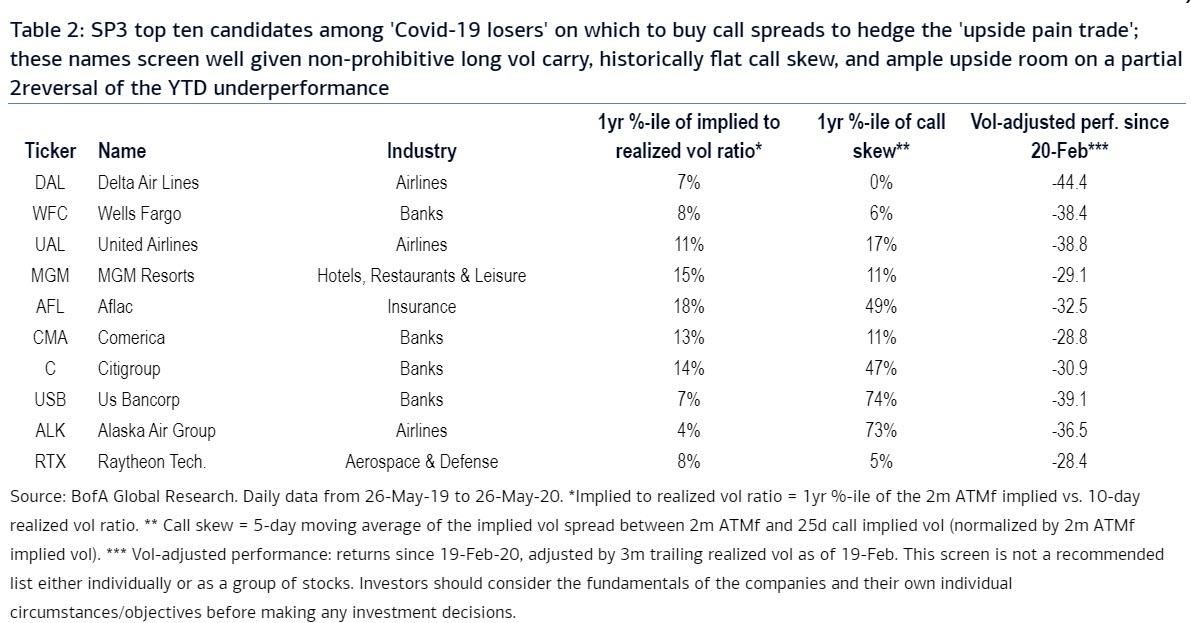
Among names in the S&P with liquid option markets (avg. daily notional options volume over the past one month in excess of $5mn), we narrow down the universe based on:
- Beaten-down industries: Among the 64 industries in the S&P 500, we select only names that belong to industries with the worst performance since 19-Feb (when the S&P peaked). Specifically, we adjust industries’ performance by the trailing 3m realized vol as of 19-Feb, and identify those industries where the vol-adjusted performance is less than or equal to -25.0 (bottom quartile of vol-adjusted performance across all industries).
- Benign long vol carry: We select only names where the 1yr %-ile of the 2m ATMf implied vs. 10-day realized vol ratio is less than 25% (quartile with the best carry).
For the resulting subset of names that satisfy the criteria set above, we rank based on the average of the following:
- Flat call skew: Names with the lowest 1yr %-ile of call skew, as measured by the 5-day moving average of the implied vol spread between 2m ATMf and 25d call implied vol (normalized by 2m ATMf implied vol).
- Beaten down names: Names that suffered the worst vol-adjusted performance since 19-Feb (the volatility measure used to adjust performance is the 3m trailing realized vol as of 19-Feb).
Names in Table 2 are ordered according to their ranking across ‘flat call skew’ and ‘vol-adjusted performance’ (the two rightmost columns in the table). The top five candidates to buy call spreads on are Delta Air Lines (DAL), Wells Fargo (WFC), United Airlines (UAL), MGM Resorts International (MGM), and Aflac (AFL).
* * *
Hedge the “pain trade” for almost zero-cost with VIX put ratios
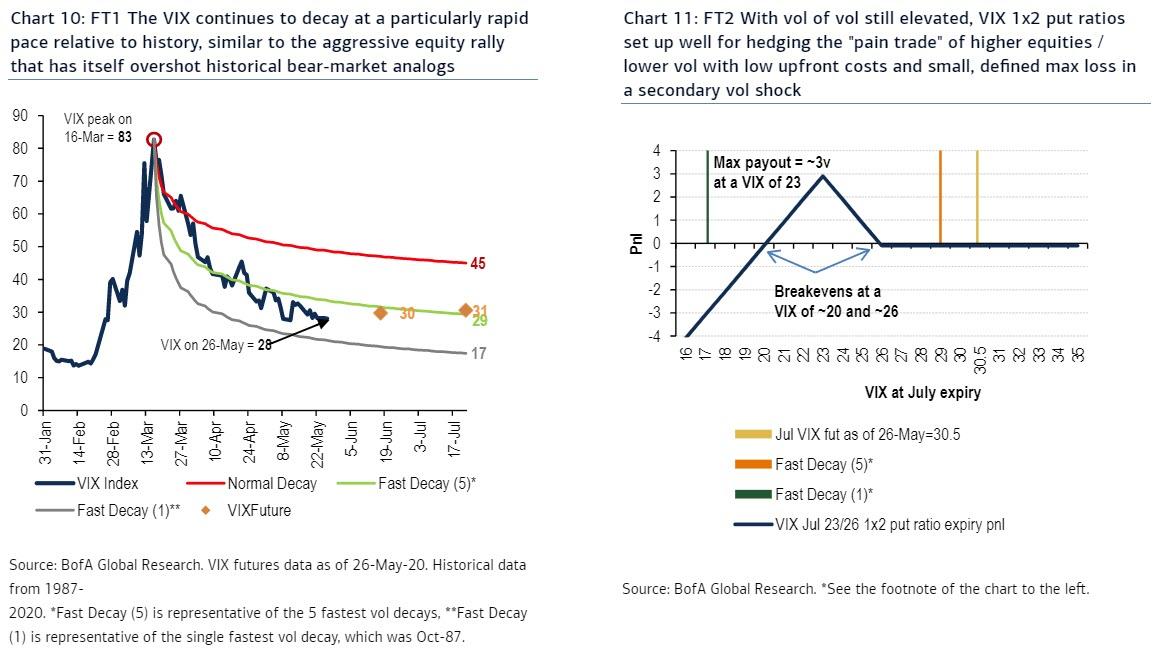
As Bowler noted on previous occasions, the VIX has been decaying at a particularly rapid pace relative to history following its March 2020 peak. This mean reversion of volatility has only gained steam in recent days, as seen from Chart 10, with the VIX now trading between levels implied by the fastest (1987 crash) and (the average of the) 5-fastest vol retracements witnessed since 1986. BofA argues that this rapid vol decay as the flip side of a similarly aggressive equity market rally – one that has overshot historical bear-rally analogs and highlights the strength of the post-GFC learned response to ignore fundamentals and not fight policy makers.
Bowler then focuses on how to hedge the “pain trade” of higher equities/lower vol using VIX put structures with low upfront premium and small, defined max loss in a secondary vol shock. To this end, VIX put ratios look interesting, for example the VIX Jul 26/23 1×2 put ratio (+1x 26, -2x 23), which costs ~0.1v (ref. 30.5 on the Jul VIX future), as:
- The trade is profitable at July expiry if the VIX settles between 20 and 26, and achieves its max payout of 3v at the midpoint of what the fastest and 5-fastest decay paths in Chart 10 imply (i.e., [29+17]/2=23, see Chart 11 for the expiry P&L).
- If VIX futures remain sticky near current levels (and in line with the 5-fastest historical decays), the passage of time should benefit the trade. For example, the same structure for June expiry costs ~0.45v today (at mids), with the June VIX future at 29.70, illustrating the potential positive carry if the status quo persists.
- In a secondary vol spike, losses are limited to the low upfront premium of 0.1v.
- The risk to the trade is a 1987-style vol crush, taking the VIX to 17 by July expiry. However, Bowler remains skeptical that volatility in a severe fundamental shock like today’s can sustain the pace of decay seen in the highly technical 1987 crash.
Cheap hedges for a policy-fueled pain trade higher in US equities
As Bowler reminds us, “it was only three months ago that US assets were delivering one of their most impressive concurrent rallies in recorded history, with an average annualized Sharpe of 4.23 at the time, in the 98th percentile since 1982.” Much has obviously changed in the last three months, but the core thesis is still surprisingly valid today and helps explain the strong rally in US equities since the March bottom.
The BofA strategist rationalized then that the remarkable performance was mostly due to (i) an asymmetrically dovish Fed (arguably more so today, particularly relative to other CBs and governments), and (ii) the relative strength of the US economy (still true today and likely to remain so barring a second virus wave, due to less severe lockdowns). Breaking this dynamic required a rebound in global growth or an idiosyncratic event in the US, neither of which has happened.
The crucial common thread that has allowed these themes to persist has been the ability for the US to deliver a much larger (monetary and fiscal) stimulus package, making its financial market again the beneficiary of the world’s flows (the US was the most and only overweight region in the May Fund Manager Survey). However, this also means that continued outperformance of US equities likely requires continued CB support. A major risk therefore, Bowler warns, “is the formation of a US equity bubble as fundamentals take a backseat to investors’ need to allocate capital to what’s arguably the safest risk asset left.”
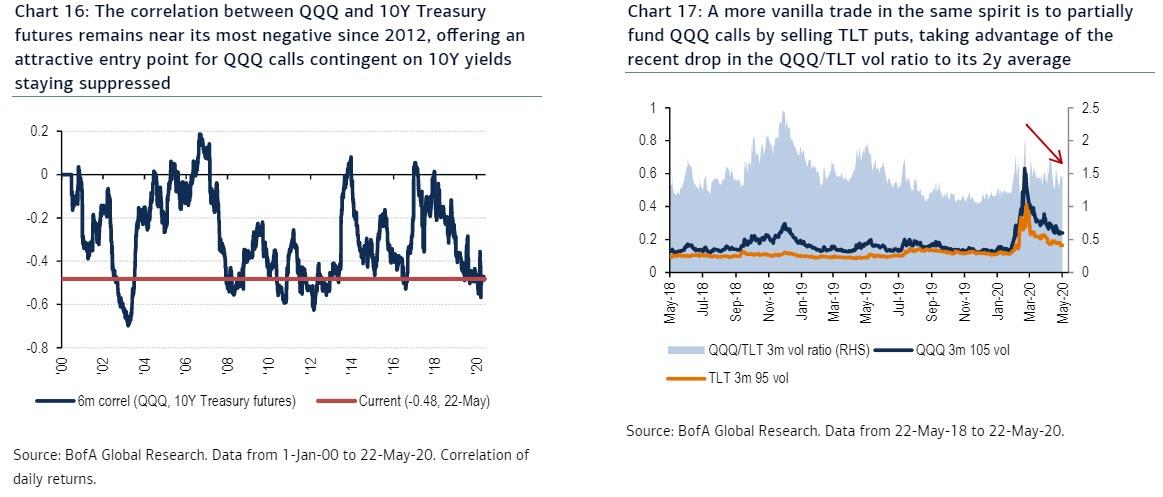
To get cheap, risk-limited exposure to a policy-fueled melt-up in US equities, BofA recommended two weeks ago QQQ calls contingent on 10Y yields not rising. That trade still works as bond/equity correlation remains near its most negative since 2012 (Chart 16) and the narrative around yield curve control (which may add downward pressure to yields) is gaining strength. A more vanilla trade in the same spirit is to partially fund QQQ calls by selling TLT puts, taking advantage of the recent drop in the QQQ/TLT vol ratio to its 2-year average (Chart 17).
- Trade #1: Buy QQQ Sep 240 calls (104.8%) contingent on 10Y CMS < 70bps for 1.58% (55% disc. to vanilla, ref. 229.04 & 0.71% fwd)
- Trade #2: Buy $1 notional of QQQ Sep 240 calls, sell $1 notional of TLT Sep 155 calls for ~1.8% (ref. 229.04 & 163.33)
* * *
Hedging Asian risks
Finally, Bowler analyzes recent developments and dynamics in the Asia autocalls market to flag vol dynamics that re-enable one of his favorite tail hedges (e.g. for investors wanting to hedge a substantial escalation of political tensions in Hong Kong). The autocall market in Asia has slowed down sharply amid the crisis. In April, only US$1.9 Bn notional of Korean autocalls were issued; down 71% from pre-crisis (Chart 22). At the same time, index-linked Uridashi issuance in Japan fell 81%. BofA highlights the following:
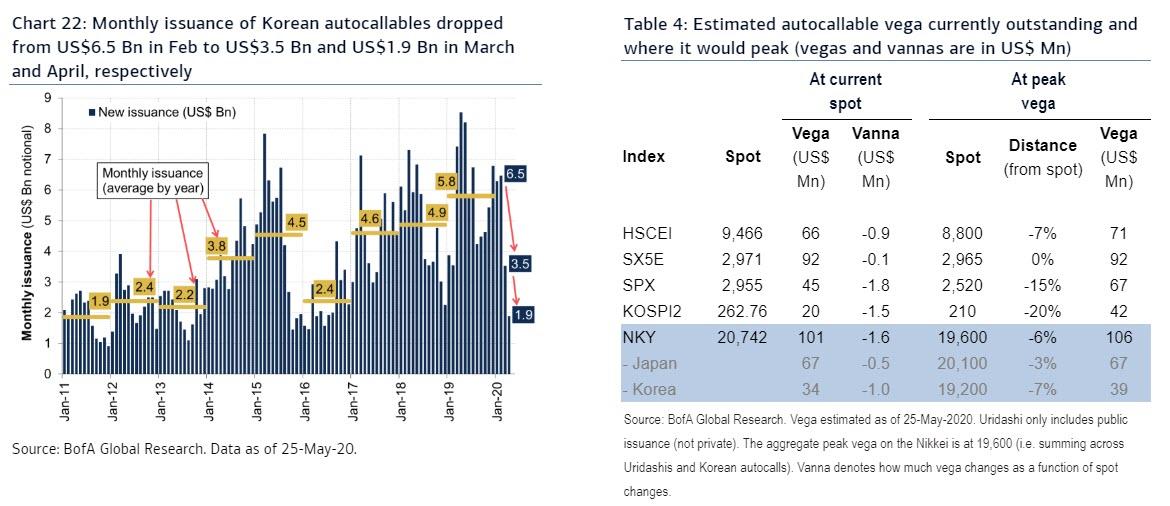
Here, issuance is expected to remain low in May-Jun as many existing autocallables look unlikely to knock out. A majority of notes in Korea depend on the 6-month performance of the SX5E, which is currently -19% (typically, autocalls require a 6-month performance better than -10% in order to knock out). Low knock-out rates tend to limit new issuance as old notes would otherwise get rolled into new ones. Baskets that do not include SX5E (in April, ~25% of new issuance), however, may start knocking out as the worst 6-month performers, HSCEI or KOSPI2 – down 10% and -9%, respectively – are close to the knock-out barriers.
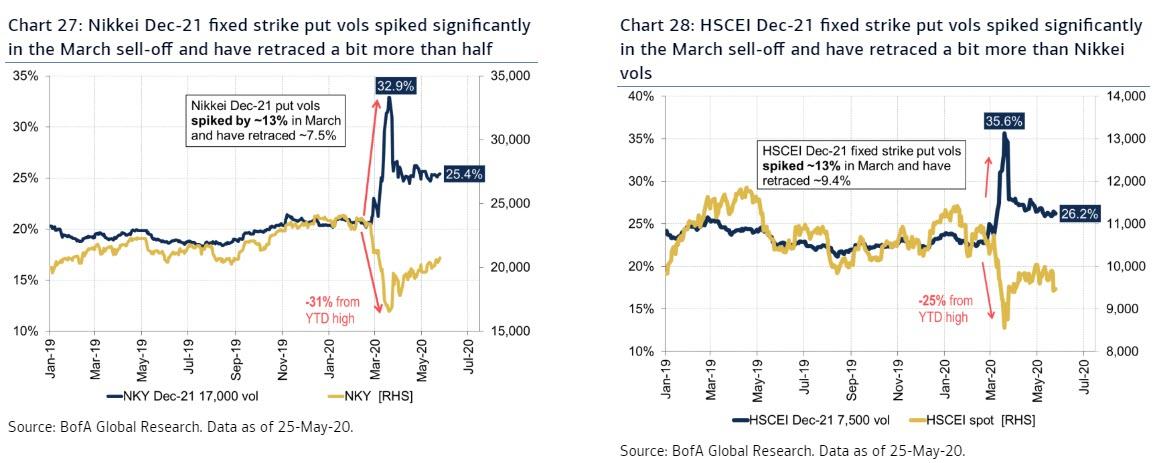
Long-dated HSCEI vols coming lower while Nikkei vols have been supported. HSCEI Dec-21 fixed strike put vols (strike close to 80%) are gradually normalising, having retraced ~75% of the March spike, trading ~3% above pre-crisis levels. The corresponding Nikkei vols have been more supported recently, trading ~5% above pre-crisis levels and close to unchanged since the end of March (Chart 28).
Rallying markets should keep vols supported in the near term. The Nikkei and the HSCEI are at similar distances from their respective peak vegas (peaks are -6% and -7% away, respectively; see Table 4). The relative proximity to peak vega creates an autocall-linked vol supply/demand asymmetry as 10% spot declines barely changes the outstanding vega while 10% rallies would decrease(*) vega by US$26 Mn and US$13 Mn, respectively, for Nikkei and HSCEI (Charts 23 and 24).
Tail hedge on HSCEI in case the Hong Kong tensions escalate
Risks in Hong Kong could rise further in the coming months; especially in case the US considers withdrawing the special status of Hong Kong that treats it differently from mainland China on trade, commerce and other areas. While such a withdrawal has been discussed for a while now, the recently souring relations between the US and China together with US lawmakers last year passing the Hong Kong Human Rights and Democracy Act of 2019, make these risks higher, in our view. Indeed, US Secretary of State, Mike Pompeo, said on Friday last week that bypassing HK’s LegCo “would be a death knell for the high degree of autonomy” (HK earns the special status as it maintains sufficient autonomy under the “one country, two systems” framework).
While tail hedges are not the “screaming buy” they were pre-crisis, long-dated HSCEI put vols have retraced a considerable amount of the March spike (Chart 28). Investors worried about substantial issues in Hong Kong in the months ahead should consider shorting HSCEI Dec-21 1×3 put ratios. Long 3x 7,000 strike and short 1x of the 9,200 strike costs HKD 52 (indic. ~0.5% of spot; vols 28.3/22.4, -7% delta, spot ref: 9,595) and could gain >10-to-1 in case of a sharp sell-off (e.g. ~25% drawdown or worse).
via ZeroHedge News https://ift.tt/3cmH7jZ Tyler Durden