GLJ Research: This Is Shaping Up As One Of The Worst Quarters In Tesla History
Tyler Durden
Tue, 06/02/2020 – 21:54
Submitted by Gordon Johnson of GLJ Research
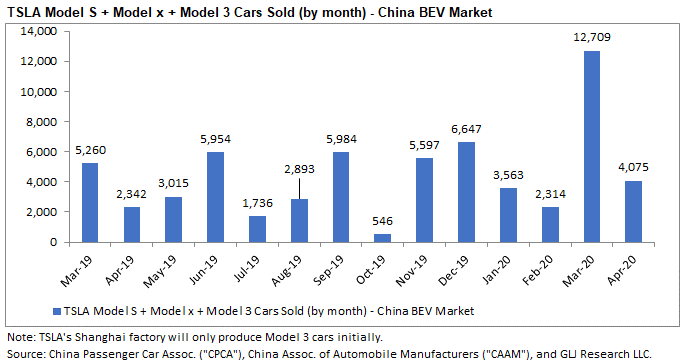
After rising 449% m/m in China in March following China’s COVID-19 lockdowns ending, TSLA’s sales of cars in China in April fell -34.8% m/m (this came as a disappointment to many TSLA bulls as the competition gained materially on TSLA in the moth of April – link).
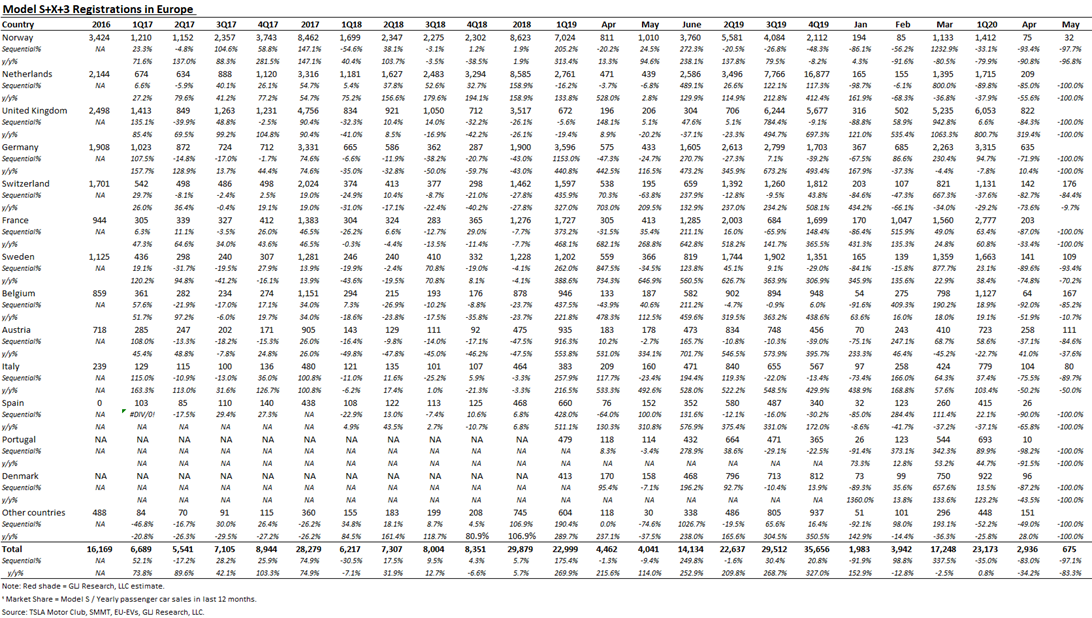
Aggregate EU Registrations: For the six EU countries that have reported May 2020 registrations, TSLA saw numbers for all cars “sold” fall -13.9% m/m and -67.8% y/y; through the first two months combined of 2Q20 (i.e., 2Q20 QTD) in these six EU countries, registrations are down -22.8% q/q and -67.8% y/y.
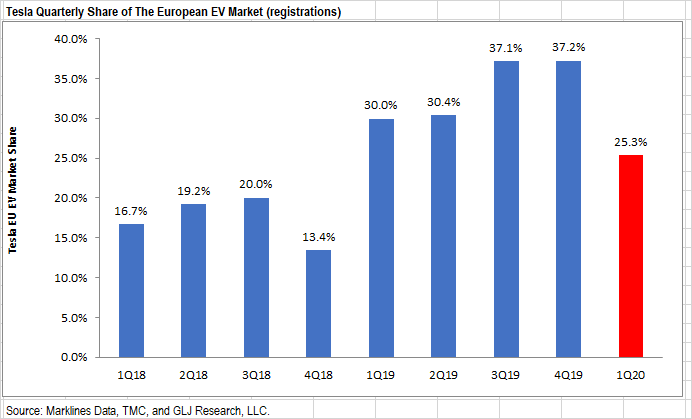
Aggregate EU EV Market Share: TSLA’s aggregated EU market share fell from 37.2% in 4Q19 to 25.3% in 1Q20.
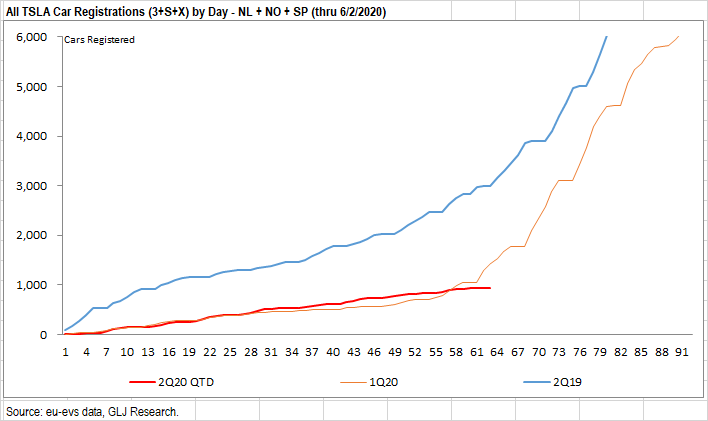
NO + NL + SP Registrations: 2Q20 QTD, TSLA’s market share is down to 3.8%, vs. 7.7% in 1Q20 and 35.6% in 4Q19. Stated differently, TSLA has lost significant market share in the three key EU markets it… once… dominated.
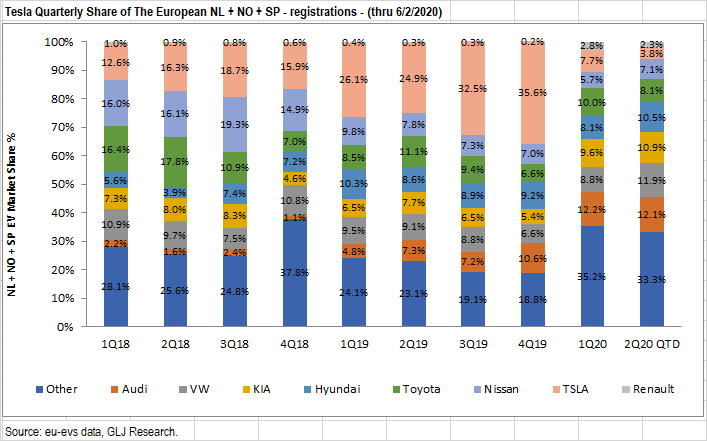
NO + NL + SP Registrations (more detailed look): Through the first 63 days of 2Q20, sales in these three countries, combined, are down -34.7% q/q and -68.8% y/y.
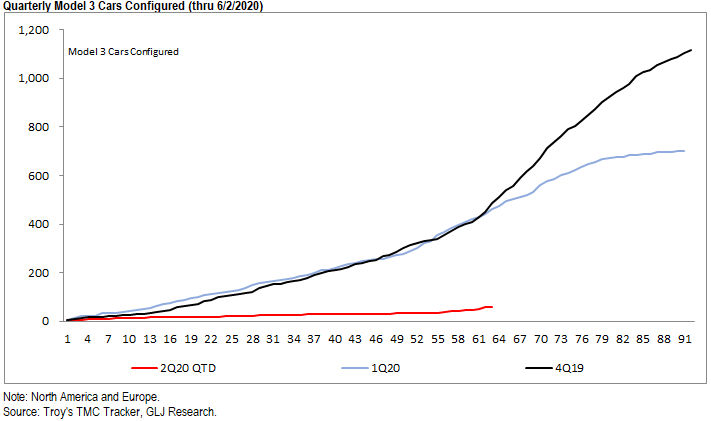
Model 3 Tracker: Using TroyTeslike’s Model 3 tracker, through the first 63 days of 2Q20, Model 3 configurations are down -87.3% q/q and -86.7% y/y.
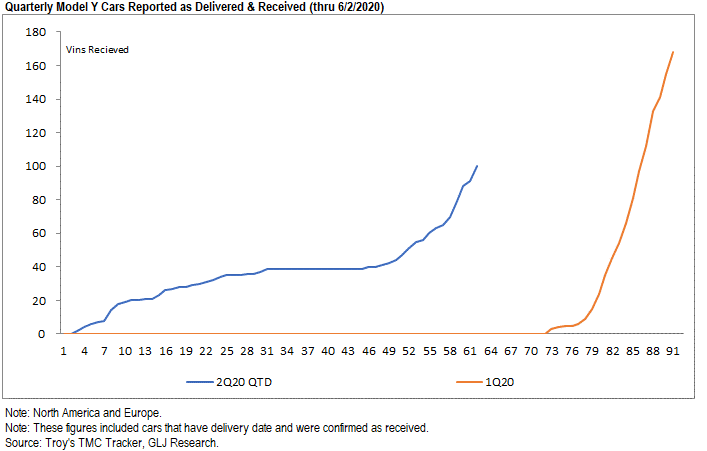
Model Y Tracker: Using TroyTeslike’s Model Y tracker, through the first 63 days of 2Q20, deliveries are running at 69 cars. By comparison, in the first full month the Model 3 tracker was collecting data on Model 3 sales, it reached 709 cars by quarter’s end. This may be why TSLA, recently, drastically reduced the lead times from when you order a Model Y in the USA to when you get it – i.e., to 4-8 weeks vs. 8-12 weeks prior (link) – this followed the sharp price cuts taken by TSLA last week due to weaker-than-expected demand globally.
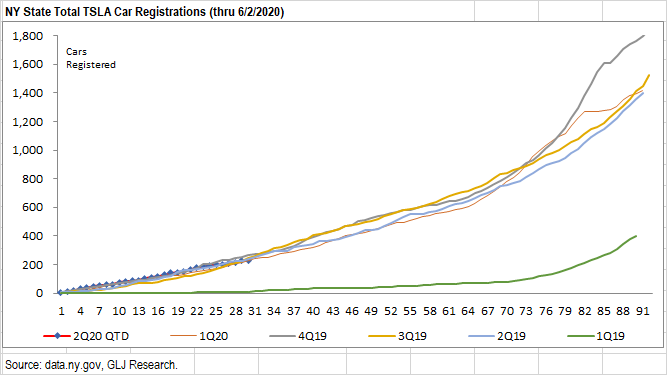
New York State Data: While the data does not look bad, it’s important to remember that in NY State, registrations lag sales. So the April data below is from sales made in March. This means we won’t see the April/May COVID-19 sales impact in NYS until May/June data is out (i.e., later this week).
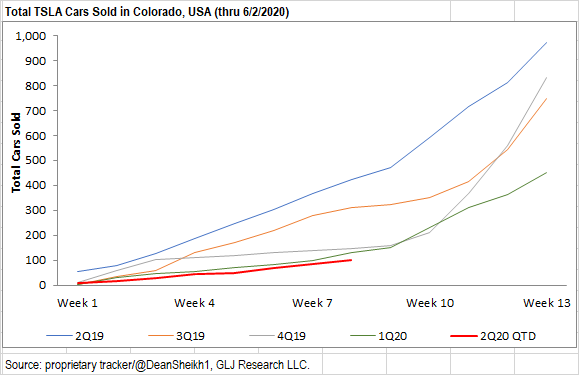
Colorado, USA: In Colorado, USA, through the 8th week of 2Q20, sales are trending down -22.3% q/q and -76.1% y/y.
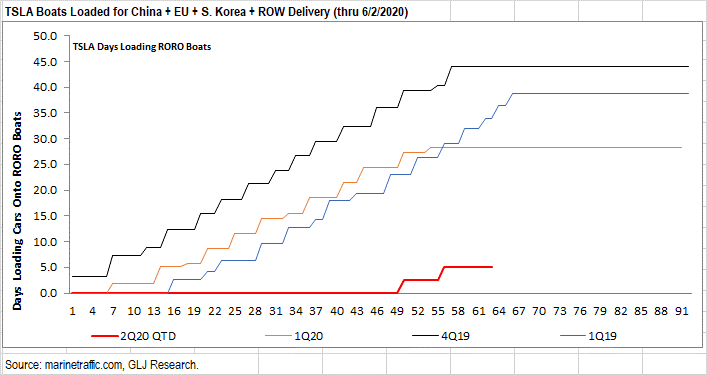
RORO Boat Data: Looking at days boats loaded for TSLA cars, volumes are down -82.2% q/q and -78.1% y/y. The first boat of 2Q20 was sent to S. Korea; there is another boat that will arrive in Europe with roughly 3-4K cars (by our est.) before the end of 2Q20; finally, there is another RORO boat that is still moored, but we est. will arrive in Asia before the end of 2Q20 (it will be close, however).
CONCLUSION: Observing the publicly available data, and also observing a recent initiation on TSLA, in which the headline “Tesla (ticker: TSLA) is on the cusp of replicating its success in the U.S. EV market to potentially larger markets in China and Europe” (link) was published on a number of widely-followed financial media sites, as analysts are forced to revert back to TSLA’s actual fundamentals (which remain publicly available for anyone who wants it) – which include market share losses in both the EU and China – sentiment could be set to shift lower.
via ZeroHedge News https://ift.tt/3eQbtx7 Tyler Durden