Is The Momentum-To-Value Rotation Real? The Answer Is In The 5s/30s
Tyler Durden
Wed, 06/03/2020 – 10:50
With some traders asking if the recent reversal in the seemingly unstoppable long momentum/short value trade is the start of a new “Great Rotation” beneath the market’s surface which sees inflation sensitive stocks rise at the expense of growth/momentum/Treasury equivalents…
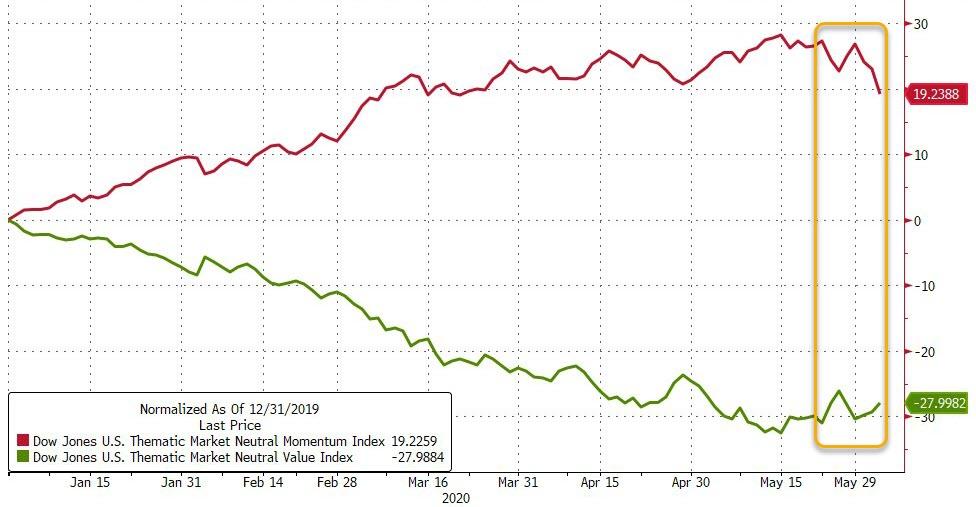
… a rotation which Barclays writes overnight could have legs, helped by rising PMIs, stabilizing bond yields and a weaker dollar, this morning Nomura’s Charlie McElligott breaks it down in simpler terms, writing that the Equities “Value” factor is positively correlated to “bear-steepening” of UST yield curves in particular, and with the 5s30s curve now the steepest since 2016…
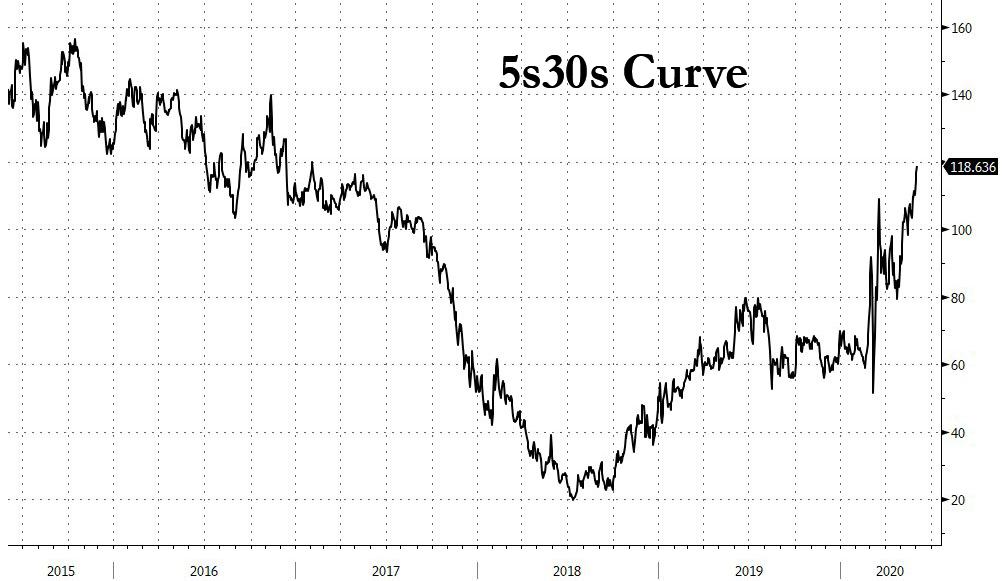
… then, according to the Nomura strategist, “the true accelerant for a potentially larger shift from the current “rebalancing” into an outright “rotation” away from Duration-Equities towards Cyclicals within the recently agitated US Equities “Value / Growth” trade dynamic would be an inflection away from the multi-year “long” built into Global Fixed-Income positioning, particularly within managed futures / CTAs as typical “first movers” on trend breakdown or reversal.”
What is curious is that according to Nomura’s CTA model, trend-followers remain “+100% Long” UST 10Y futures – even if other banks have far more muted assumptions – which to Nomura signals that its “CTA model remains deeply in-the-money ( = still far from deleveraging triggers) and somewhat bullet-proof *for now*, especially with good value and yield pick-up in the US long-end seemingly evident for FX hedged overseas investors on further cheapening.”
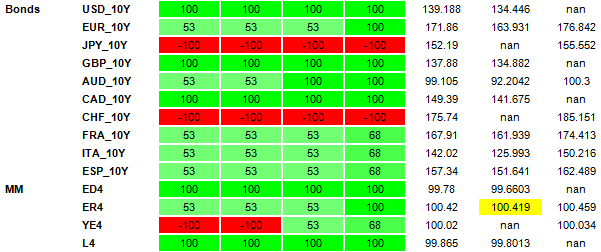
However, the story is different for Global Bonds where McElligott has seen a deleveraging “pivot” develop “as the prior legacy “+100% Long” position signals across many sovy bond futures have already turned lower over the past month, as some short-term lookback windows have actually turned and thus driven some position deleveraging (e.g. for RXA Euro Bund futures, we have seen the 2w, 1m and 3m signals all flip “short”—so the overall gross position inside the portfolio has been reduced from 20.5% to 11.1% over the past 1m)—over the past 1m we have seen EUR 10Y, AUD 10Y, FRA 10Y, ITA 10Y and ESP 10Y all go from +100% to now “just” + 53%, which in turn has reduced the overall portfolio allocation / exposure to bonds.”
This is shown in the table of CTA position estimates below:
So if the fate of the value/momentum trade is in the hands of the 5s30s, and CTAs are about to hit key trigger points to go from max long to short the 10Y TSY, McElligott suggests that “perhaps the asset to watch regarding the threat to legacy “fixed-income LONG” positioning held by systematic trend funds is that the US front-end Rates ED$ position, which is ever-so-slow nearing its own deleveraging trigger as well—this signal has been a “long” for almost the entirety of the time dating-back to Dec ’18; not surprisingly then, ED4 remains the single largest gross-exposure across the entire CTA Trend model portfolio.”
via ZeroHedge News https://ift.tt/3cBrp4R Tyler Durden