Market Corrects As COVID-19 Cases Surge – The Bear-Case Is Still Valid
Tyler Durden
Sat, 06/13/2020 – 14:20
Authored by Lance Roberts via RealInvestmentAdvice.com,

Market Correction
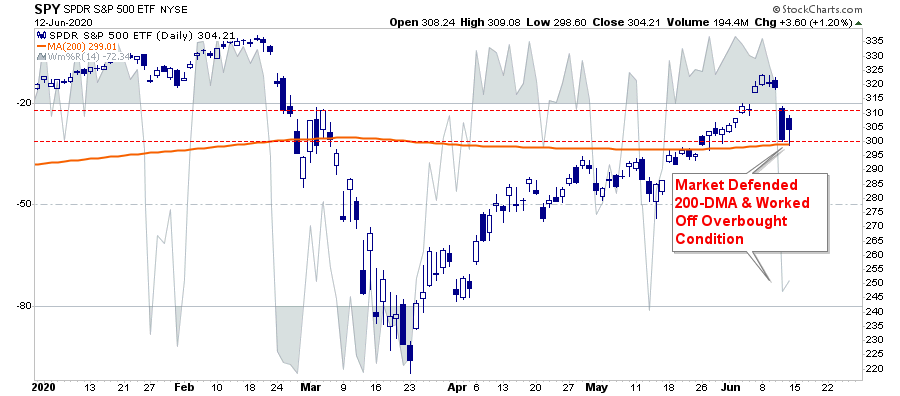
As I wrote previously, the break above the 200-dma had changed the complexion of the market.
“If the markets can break above the 200-dma, and maintain that level, it would suggest the bull market is back in play.“
However, in our Tuesday follow up, we discussed how the market rally had gotten to an extreme. As such, we noted the need to become more defensive in the short-term. To wit:
“Regardless, the markets are bullish biased, and we must be respectful of that reality. No matter how you slice the data, the markets are back to more extreme overbought conditions on a short-term basis.
The break above the 200-dma triggered a parabolic advance in the market over the last week. The market is making a 3-standard deviation move to the upside. With indicators very overbought, short-term corrective action is likely. (Note the market was just 3-standard deviations BELOW the 50-dma in March.)”
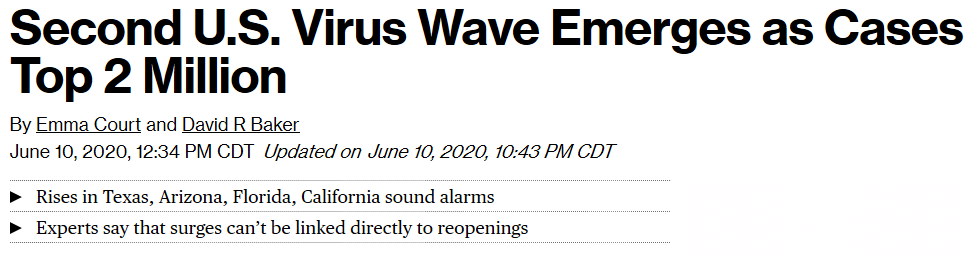
That correction came swiftly on Thursday. The surge in COVID-19 cases in the U.S. undermined the “V-Shaped” economic recovery meme. As we noted, the market had rallied into overhead resistance, and the correction found support at the 200-dma.
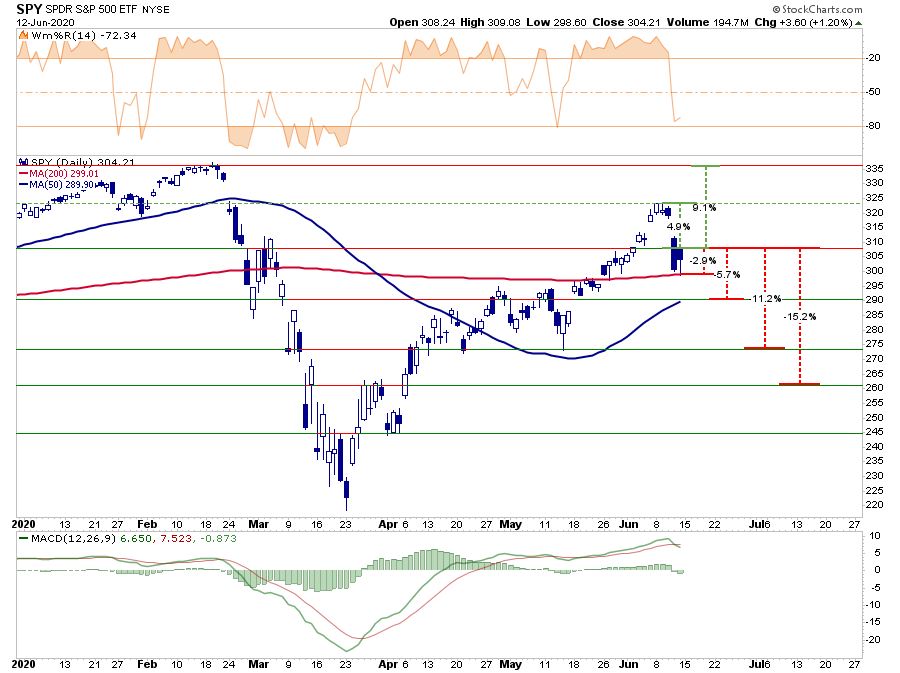
We can now update the risk/reward parameters from last week.
-
-2.9% to the 200-dma vs. +4.9% to previous high. (Positive)
-
-2.9% to the 200-dma vs. +9.1% to all-time highs. (Positive)
-
-5.6% to 50-dma vs. +4.9% to previous high. (Neutral)
-
-11.21% to consolidation lows vs +9.1% to all-time highs (Negative)
-
-15.2% to March bounce peak vs. +9.1% to all-time highs. (Negative)
The market achieved the retracement to the 200-dma support on Thursday during the most intense sell-off since March. Importantly, it was a good reminder of just how brutal markets can be when there is a complete lack of liquidity.
Correction Reduces Short-Term Excesses
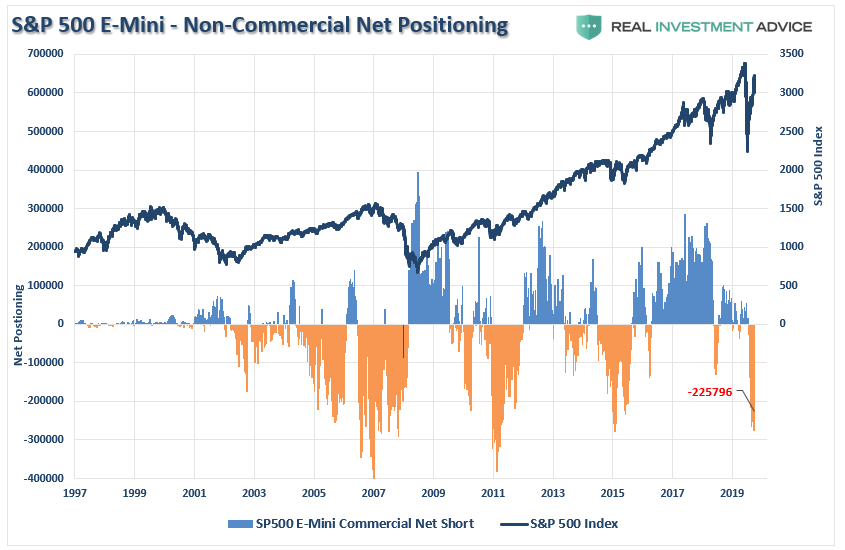
Previously we discussed the more extreme levels of optimism in the markets. These indicators have historically corresponded with short-term market peaks and corrections.
The first was the large level of short-positions non-commercial speculators were carrying on the S&P 500. (These are contracts on the S&P 500 in the futures market used for hedging long market positioning.) Net-short positioning had reached a more extreme level, which historically aligns with short-term peaks and bear markets. The correction last week reduced some of that excess.
The same goes for the total put-call ratio, This ratio measures the total of option contract buying. Investors had gotten extremely aggressive in buying call options betting the market would only go higher. At extremes, retail “call option” buyers generally wind up on the wrong side of the trade. The quick rout on Thursday reduced some of those excesses.
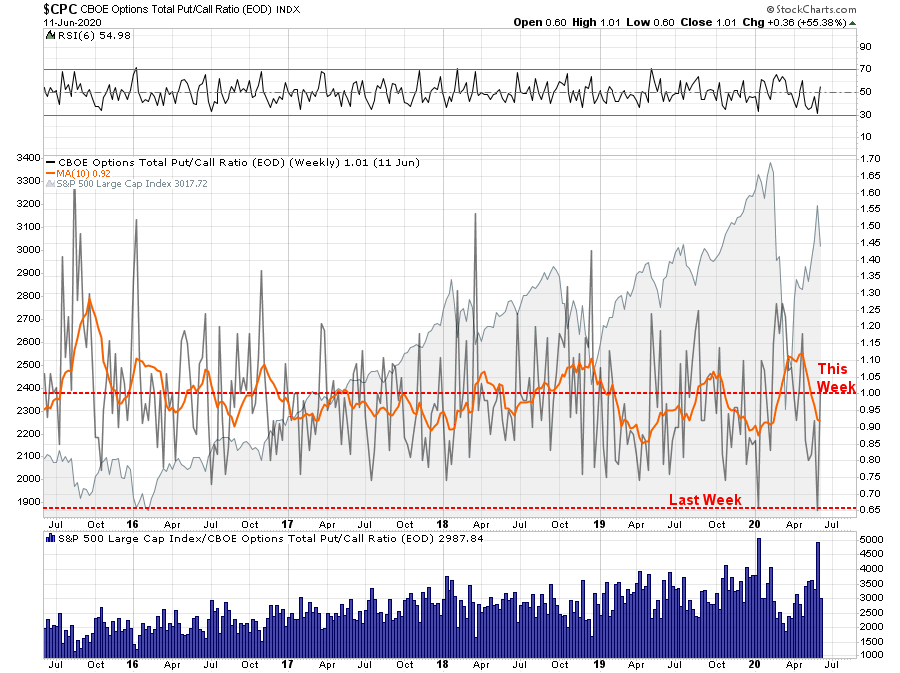
Note, however, the 10-day moving average of the put-call ratio remains in more “bearish” territory, suggesting we may not be done with the correction just yet.
The issue remains that the markets have priced in a “V-shaped” recovery, which is well ahead of what the economic data suggests.
A Note About The Fed
There were two catalysts that ignited the sell-off on Thursday. The first, as stated above, were headlines of a surge in COVID-19 cases. (As discussed in this week’s #MacroView below)
The second, and probably more important reason, was what the Fed didn’t say following this week’s Fed meeting. While the markets were hopeful for announcements for more stimulus to support the markets, the Fed simply reiterated their current stance.
More importantly, the Fed stated that QE would remain at $40 billion per week or $120 billion per month. This is substantially less than the current level of Treasury issuance. As Tavi Costa of Crescat Capital noted this week:
Jay Powell better not be printing “only” $120B per month…
The government just borrowed $760B in May alone!
Second largest net issuance of Treasuries in history.
It dwarfed the Fed’s stimulus by over $300B.
Let me spell it out for robinhood traders:
Not bullish for stocks. pic.twitter.com/YiLy6Czax9
— Otavio (Tavi) Costa (@TaviCosta) June 11, 2020
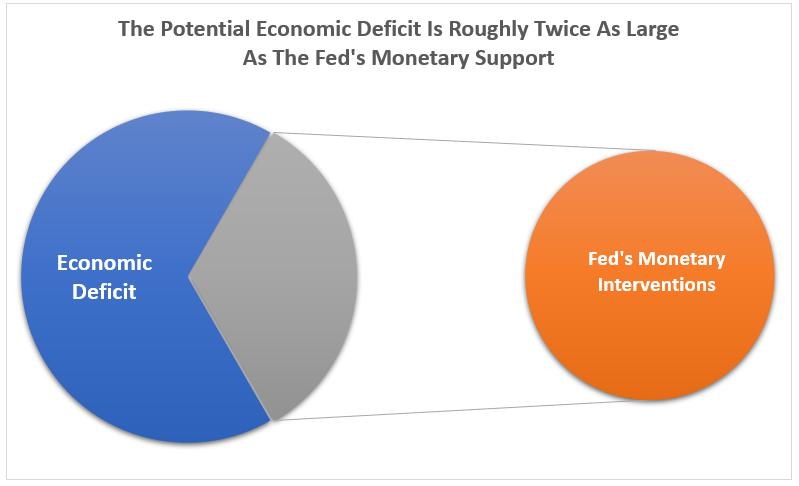
As noted previously, while the Fed is doing a massive amount of QE, the “hole” they are trying to fill is substantially larger. In what I call the “PacMan” chart below, the “economic deficit” will consume more than the Fed has currently committed. (Economic deficit is the estimated loss due to ongoing unemployment, reduced growth, and impact of debt and deficits.)
The Worst Economic Forecasters Ever
The Federal Reserve must qualify as the worst economic forecasters ever. Despite annual promises of stronger economic growth, such has yet to be the case. Ever.
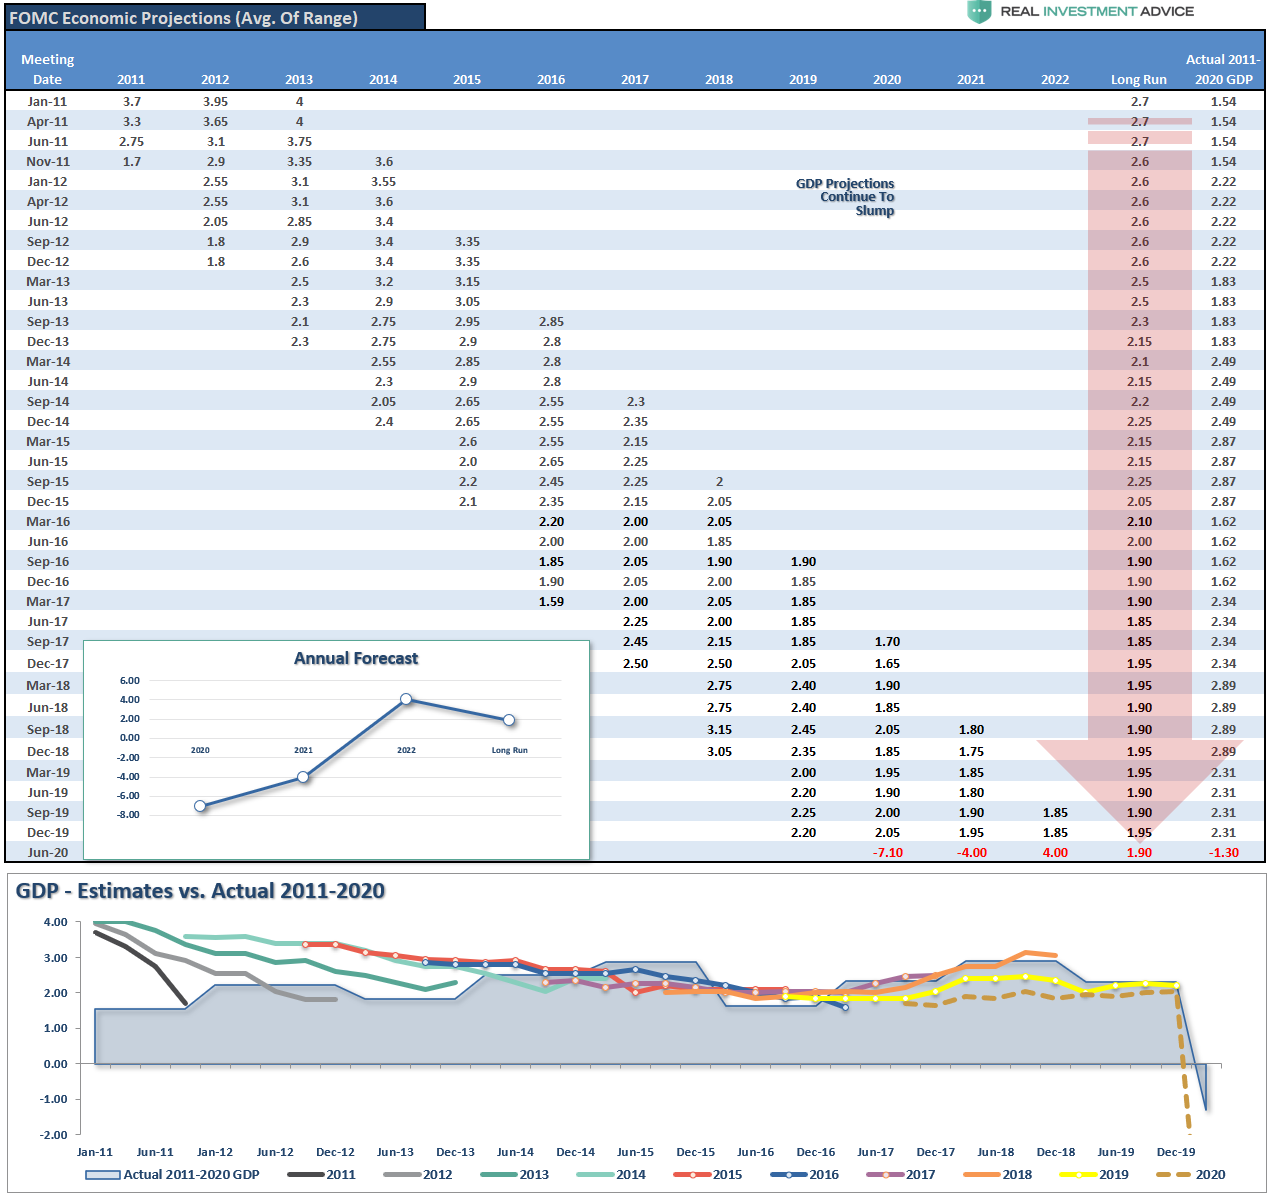
While the economy will indeed recover in 2021 and 2022, the Fed is likely overestimating the outcome. However, in the short-term, they have little choice.
“Unwittingly, the Fed has now become co-dependent on the markets. If they acknowledge the risk of weaker economic growth, the subsequent market sell-off would dampen consumer confidence and push economic growth rates lower. Therefore, they have to be overly optimistic.”
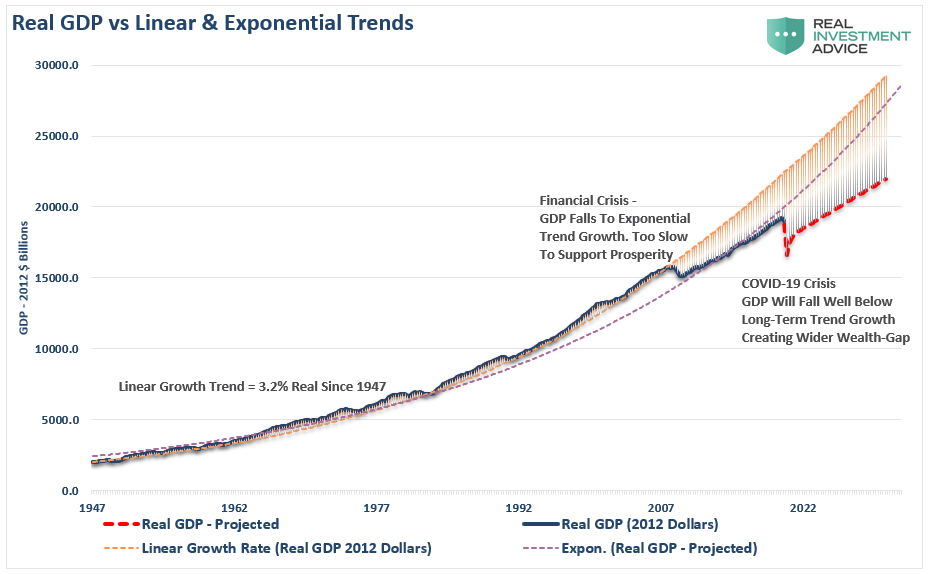
As discussed Friday, the surging levels of debts and deficits, combined with demographics, will suppress economic growth below 2%. Such leaves very little room for the Fed to make a policy mistake.
“Before the “Financial Crisis,” the economy had a linear growth trend of real GDP of 3.2%. Following the 2008 recession, the growth rate dropped to the exponential growth trend of roughly 2.2%. Instead of reducing the debt problems, unproductive debt, and leverage increased.”
While the Fed had an opportunity to disconnect monetary policy from the market, they failed to do so. Instead, they once again opted to bail out financial markets at the expense of economic prosperity longer-term.
#Recessions are a #necessity for stronger #economic #growth and expanded #prosperity. By opting to avoid short-term pain by not letting #capitalsim function in killing off the #weak and #reducing #debt we have trapped ourselves into long-term low growth and inequality. pic.twitter.com/FKIwCW5bjm
— Lance Roberts (@LanceRoberts) June 12, 2020
By voting to avoid short-term pain, the Federal Reserve has locked the economy into a long-term economic malaise. Like a “frog in boiling water,” the vast majority of Americans will see their economic prosperity slowly fade.
The stock market is not the economy. It is a distortion of economics.
The Bear Case Is Still Valid
As my colleague Doug Kass pointed out on Friday:
Yesterday provided at least five reasons for the markets to decline:
Federal Reserve Chairman Powell delivered a cautionary economic message for not only this year but for several years to come. To me, this renders the rosy EPS projections of the consensus, and many high-profile strategists (like my friends Dave Kostin and Thomas Lee) are unrealistic.
There was mounting evidence that Covid-19 is still not tamed.
Wells Fargo CFO John Shrewsberry said second-quarter loan loss reserves would be higher than in 1Q-2020.
The Robinhood traders’ objects of affection, stocks of bankrupt companies, took a sudden dive. Silly speculation is almost always evidence of a maturing bull market.
Technical signposts are flashing red: Investor sentiment has increased as stock prices rose as a bull market in complacency has quickly unfolded from the depths of March. Market breadth has started to wane.
I agree with Doug and have been well ahead of the media in lowering forecasts. As noted previously:
“Given the horrific data we now have coming in, we already know our previous estimates of $100/share were too high. A more realistic, and still overly optimistic 50-60% decline in earnings, makes current valuations even more challenging to support. (Using the chart and table below, you can pick your price and valuation level.) “
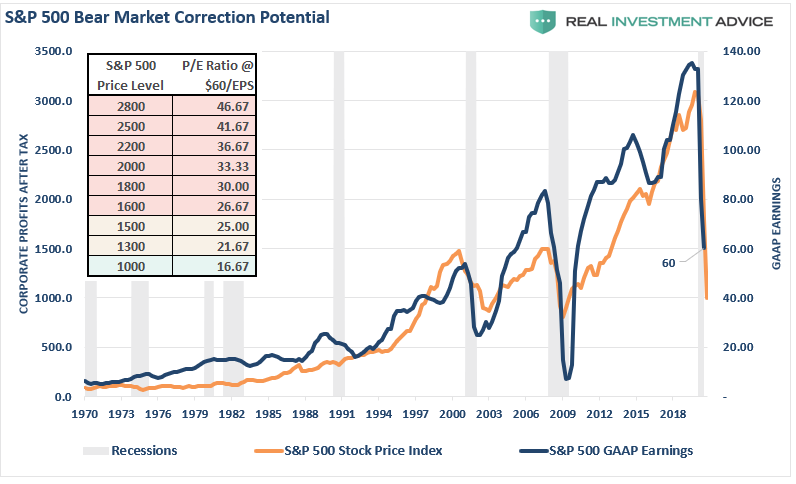
What is essential to understand is that while Fed liquidity is currently fueling a “bull market,” the “bear case” still has teeth.
Eventually, the market will fill the gap between “fantasy” and “reality.”
Technical Review Remains Bullish
In the short-term, however, the technical backdrop of the market remains bullish. The market had gotten overheated over the last couple of weeks, but the correction successfully retested the 200-dma. Such establishes important support. Concurrently, the correction reversed most of the more extreme overbought conditions.
However, if we slow our analysis down a bit, we find that the current sell signal remains intact. Such suggests the market could still experience further corrective or consolidative actions over the next couple of weeks or months.
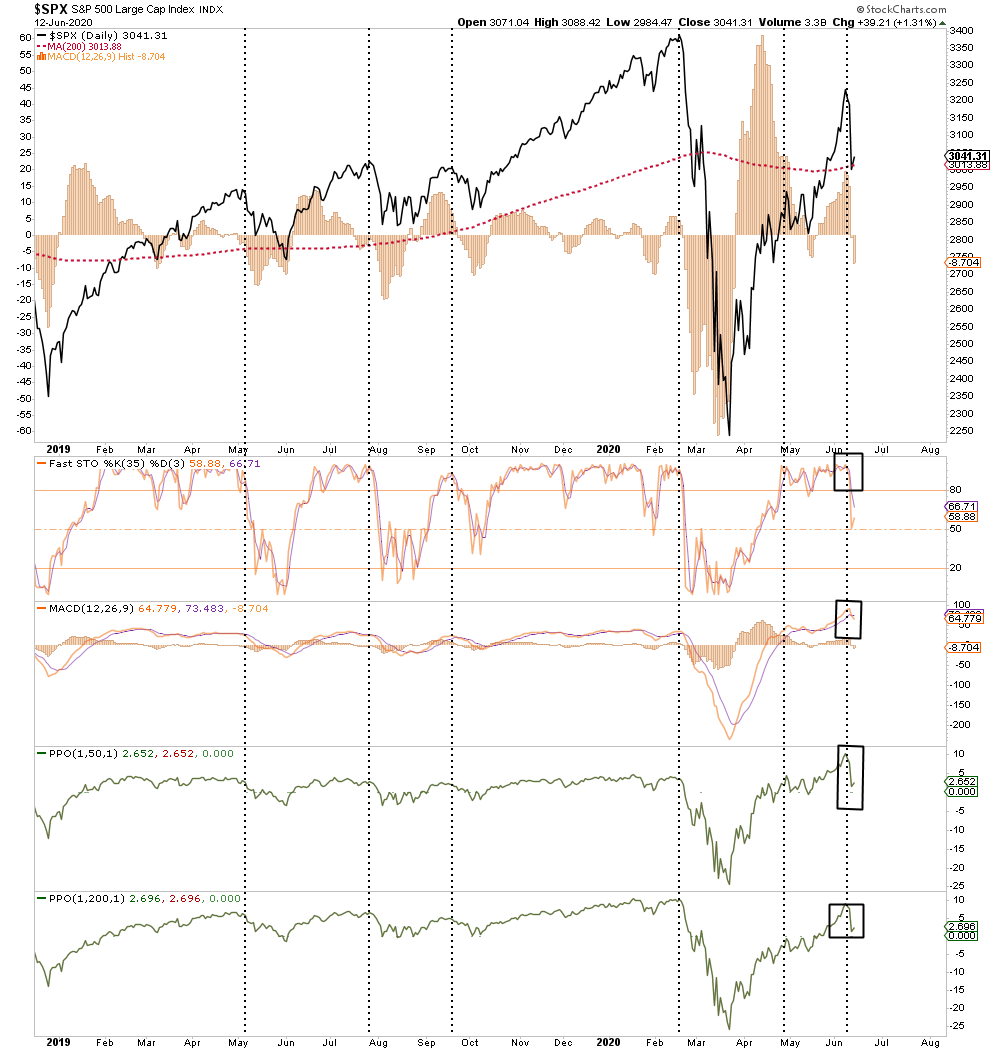
The short-term technical structure remains bullish and overbought currently. However, the longer-term fundamentals remain worrisome in light of the economic devastation. While the Fed’s monetary policies mitigated much of the downside risk, it can not be removed entirely.
As experienced on Thursday, “reversions happen fast.”
Portfolio Positioning For An Overbought Market
As I noted last week:
“With ‘coronavirus cases’ likely to rise sharply following Memorial Day celebrations and recent crowded protests, the risk of disappointment has risen. Such has been an exceptionally rally. All of our equity positions are now extremely stretched and overbought. Conversely, all of our hedges VERY oversold.”
That reversion happened this past week, with our hedges of Treasury bonds and the U.S. dollar offsetting the decline in our longs on Thursday.
This is a very risky market. Caution is advised.
via ZeroHedge News https://ift.tt/30Dwyqt Tyler Durden