Quant: “Here’s What Was Behind The Sell-Off And What One Should Do About It”
Tyler Durden
Thu, 06/25/2020 – 12:05
Global equity markets dropped steeply yesterday, with Nomura quant Masanari Takada summarizing that this probably indicates “that the bulls and the bears are deadlocked, and that it is best not to let one’s decisions be swayed too much by day-to-day market fluctuations.” However, Takada adds that it is important to properly understand what is going on, if only from a purely positioning and short-term quantitative strategic viewpoint.
Below he explains what was behind the sell-off and what one should do about it.
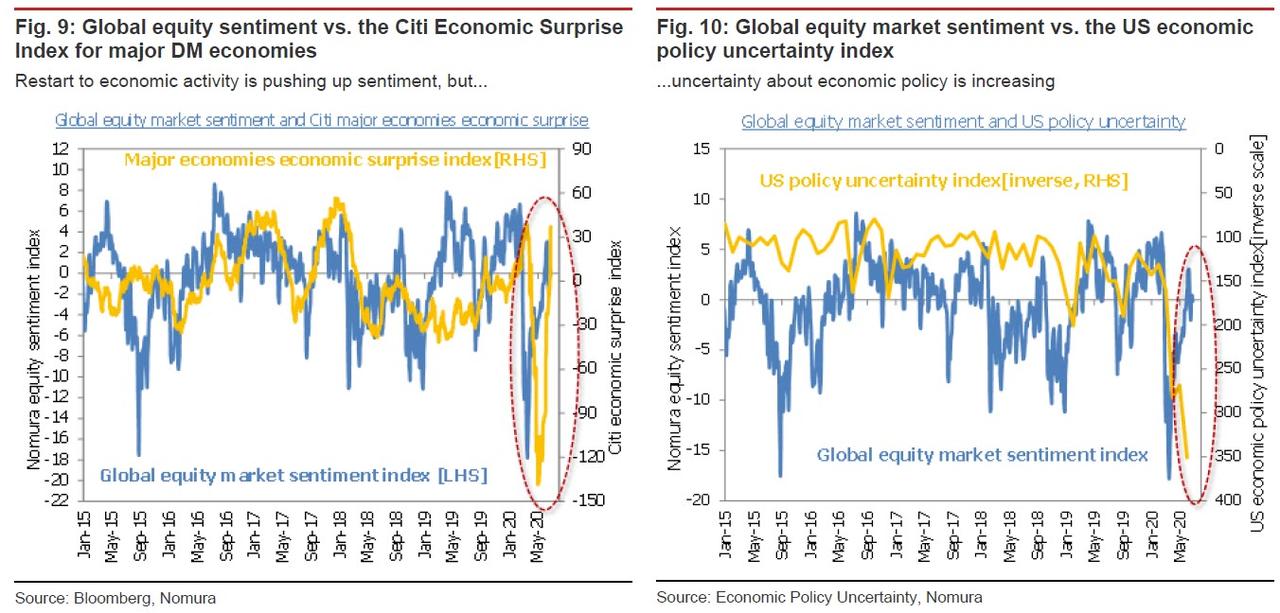
For better or worse, investor sentiment has been deadlocked between its bullish and bearish impulses. Into the context of this stalemate in sentiment came market-negative headlines concerning a second wave of the coronavirus pandemic and trade tensions between the US and Europe. The news flow caused the balance of sentiment to break down and tilt to the bearish side. However, according to the quant, other causes explain why the drop in US stocks was so steep.
First, hedge funds’ current stance in the aggregate can be described as “cautiously bullish”; one pictures them stepping on the accelerator and the brakes simultaneously. A sell-off makes them more inclined to brace against downside through such means as buying puts, and this in turns seems to have resulted in an upward bump in implied volatility (as measured by the VIX and other indicators).
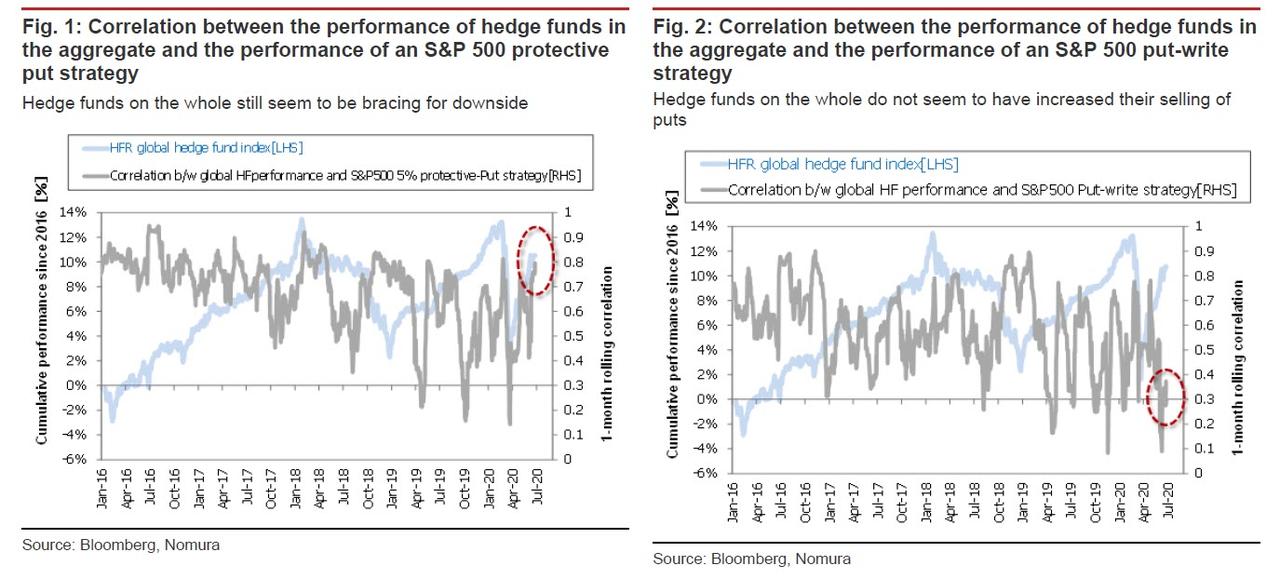
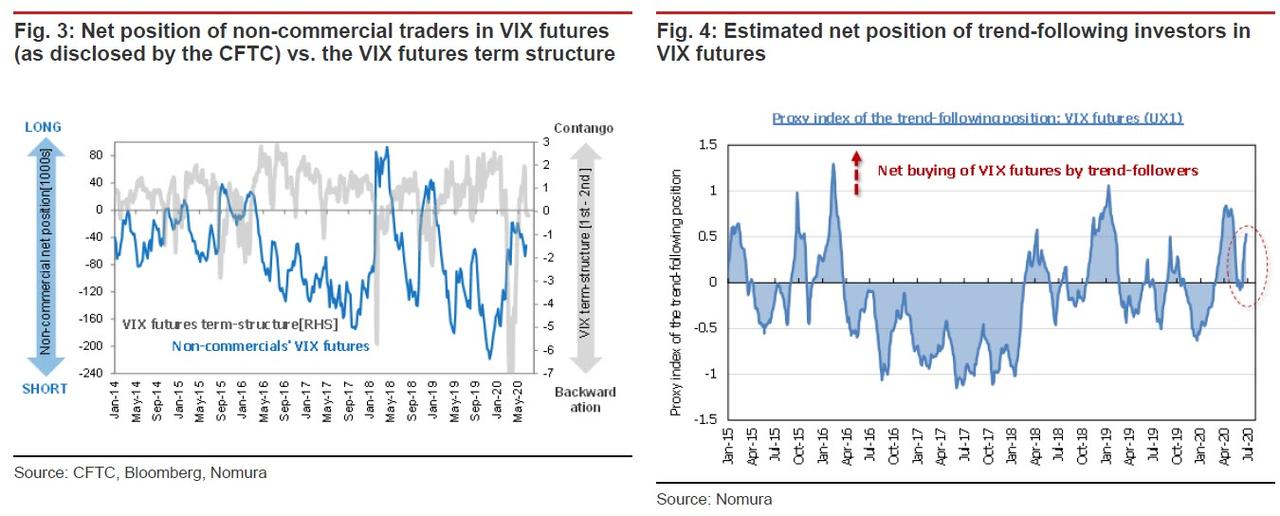
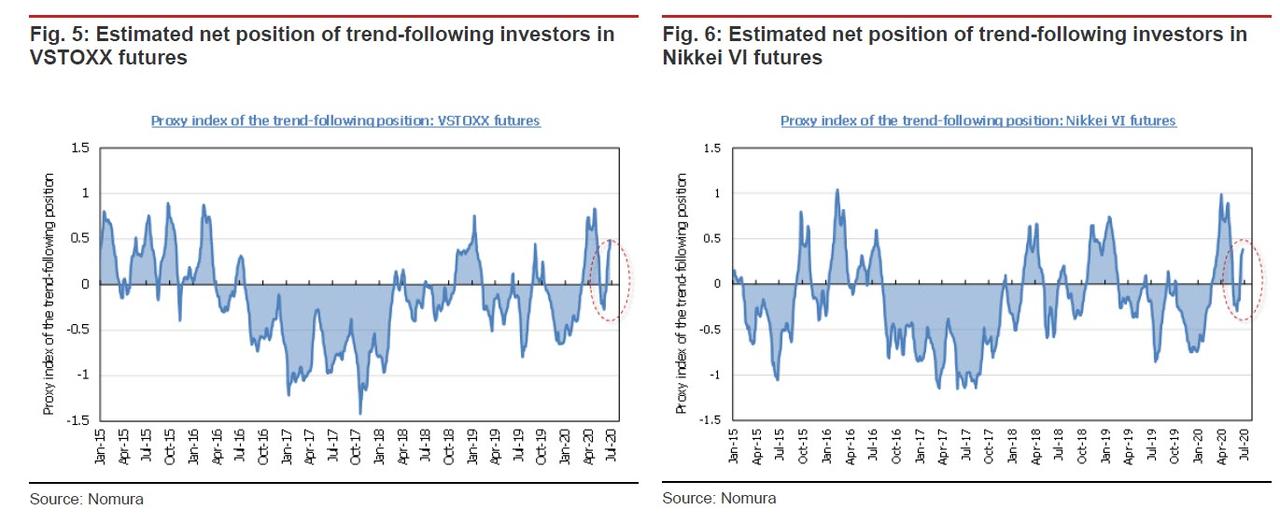
At the same time, the VIX futures term structure has gone into backwardation, as the accumulation of long positions by discretionary traders and trend-following players has lifted prices for near-dated VIX futures. This seems to have encouraged some speculative investors to cover short positions in VIX futures.
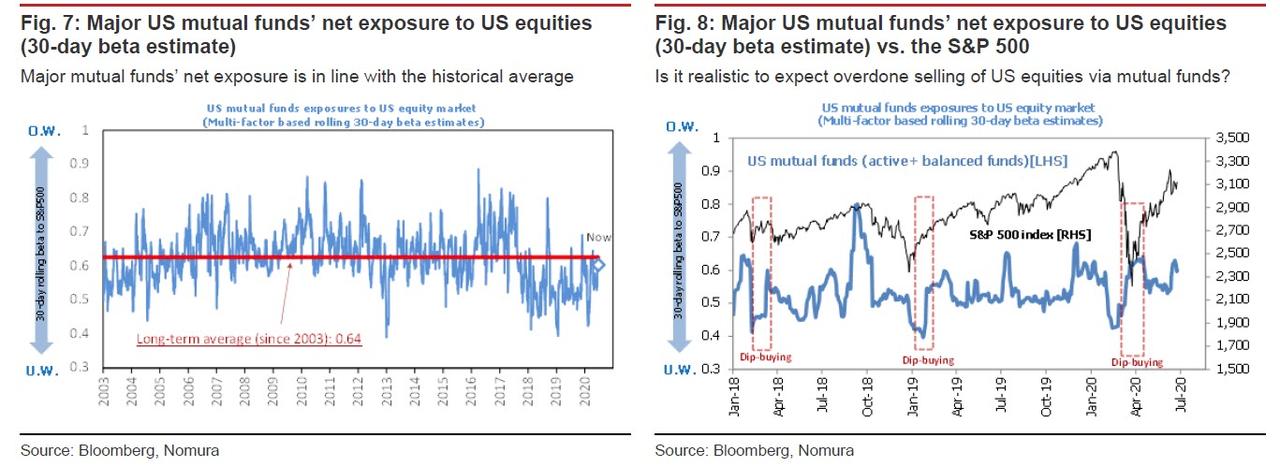
Second, some investors may be expecting longer-term investors (pension funds and other end investors) to sell stocks for the sake of portfolio rebalancing. With the current quarter about to end, longer-term investors may indeed do some automatic selling of equities as they adjust their portfolio weightings. However, a look at the US equity exposure of major US mutual funds (one-month beta estimate) reveals that these mutual funds do not have excessive equity holdings, nor are they even overweight. If anything, unlike JPMorgan which expects up to $170BN in selling, Nomura thinks they may have executed what little selling they needed to when adjusting their portfolio weightings in April-May after swinging to buying stocks when rebalancing their portfolios at the end of March.
To be sure, Takada admits that JPM may well prove to be right, as major US mutual funds are just a small fraction of the overall pool of longer-term investors and it is difficult to come to any clear conclusions about that larger pool of investors. Therefore, Nomura concedes that one should not rule out the possibility of longer-term investors selling equities for the sake of rebalancing, but since these investors tend to have a strong contrarian bent, the whole notion may be simply be an excuse for short-term investors to take a speculative stab at selling equities.
What should traders do? In short: stay pat until around 6 July if market stays stuck in “pattern rut.”
Currently there is a lot of extraneous noise that has nothing to do with the market per se, such as the second wave of the coronavirus pandemic and the Europe-US trade dispute, but vital market liquidity looks to have been left intact. Furthermore, compared with the drop in equity prices, the decline in sentiment looks moderate. The market does not seem to be factoring in unthinkable conditions. Overall, hedge fund net exposure to US equities and DM equities still does not look excessive, and we see little risk of a chain-reaction sell-off of equities by systematic traders (CTAs and risk-parity funds). If the broadly prevailing preference for high-beta stocks by speculative investors continues, then US stocks may well claw back yesterday’s losses in just a few days.
However, a lack of positive news tends to result in the market falling back into “pattern ruts” that give rise to a surface appearance of risk-off conditions. The point here is not the second wave of infections itself but whether trades can be premised on tying the “pattern rut” to the second wave. In such a case, it would probably be necessary to prepare strategic positions that assume the continuation of risk-off conditions through around 6 July.
Finally, Nomura notes that daily trading reconfirms that the markets are stuck in something of a “pattern rut”. In the interest of avoiding promoting haphazard trading ideas in reaction to short-term upswings or downswings, our basic stance has been to always check whether seemingly irregular phenomena may in fact be following the market’s particular rhythms. In other words, we try to determine whether trading flows optimized for a particular time on expectations for a specific event actually have a meaningful effect on the largely automatic asset price movements that are driven by set patterns of human behavior and preferences and by regular periodic flows.
From this perspective, while at this stage there are no irregular risk-off movements, there is a heightened probability of an automatic risk-off pattern (a “pattern rut”) in response to the drying up of specific risk-on flows.
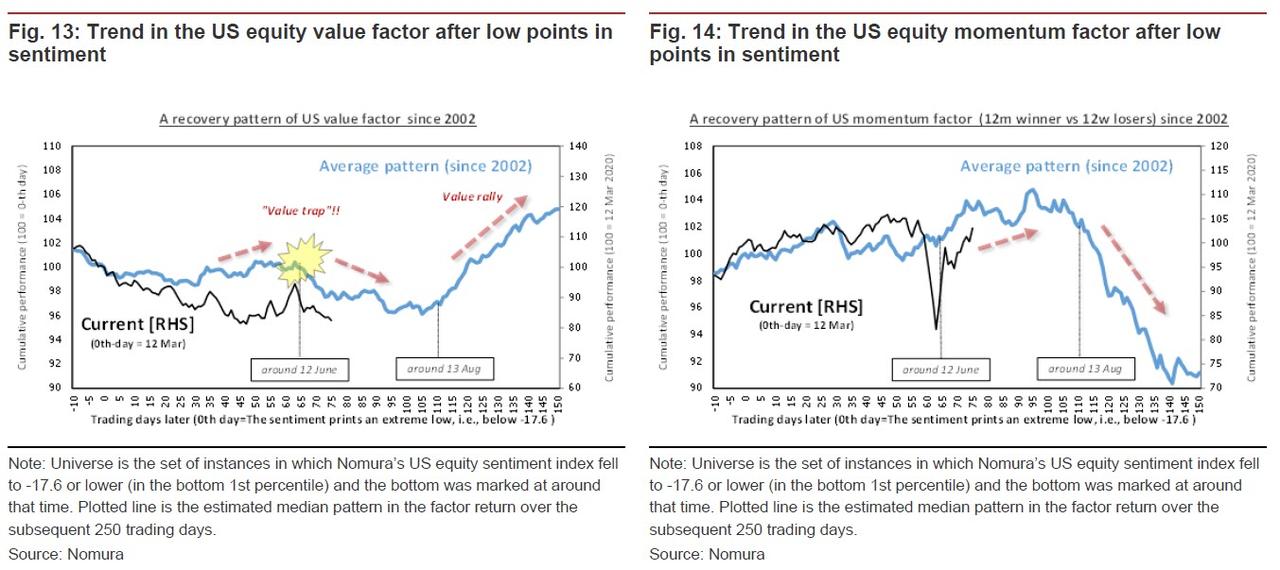
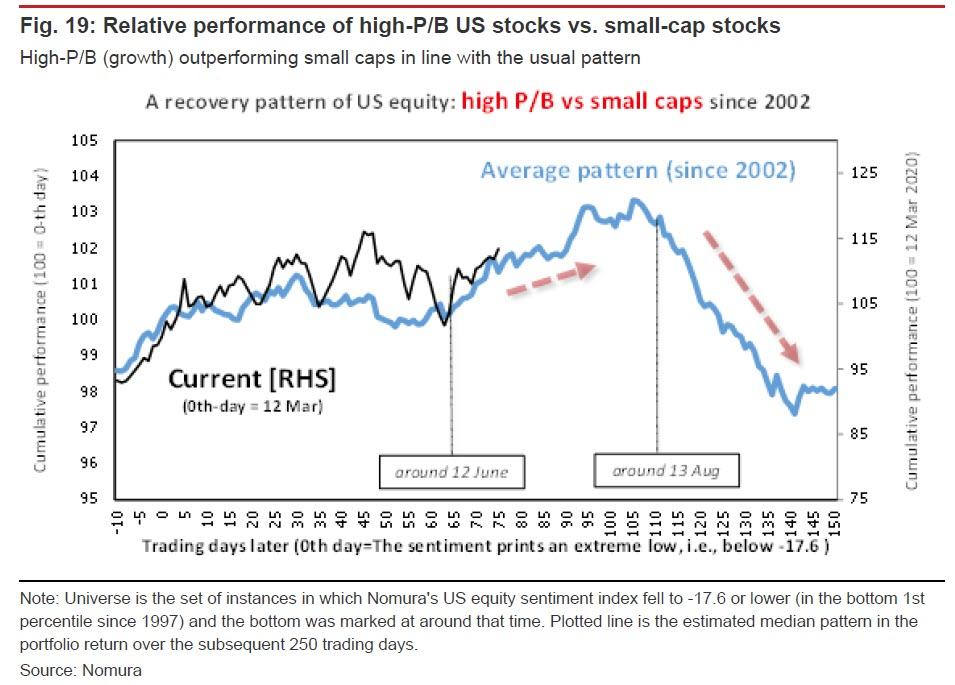
First, in terms of factors for US equities, the selling of value stocks and buying of momentum stocks that started on 12 June could continue through mid-August. The first wave of factor reversals historically seen after risk-off events has already passed by, and we are now in a phase in which these reversals are being reversed. This factor pattern is also likely to be playing a part in the recent renewed buying of stocks that benefit from the pandemic (pharmaceuticals and stocks related to stay-at-home demand).
Second, CTAs’ adjustment of their long positions in S&P 500 futures could continue through around 6 July. Their upside-chasing looks to have failed to break out of the “pattern rut”, and they seem to have shifted to wait-and-see mode right on schedule. If the S&P 500 were to break below the inflection point at 3,030-3,050 (the cost of net buying of futures in June), they look prone to position adjustments until around 6 July
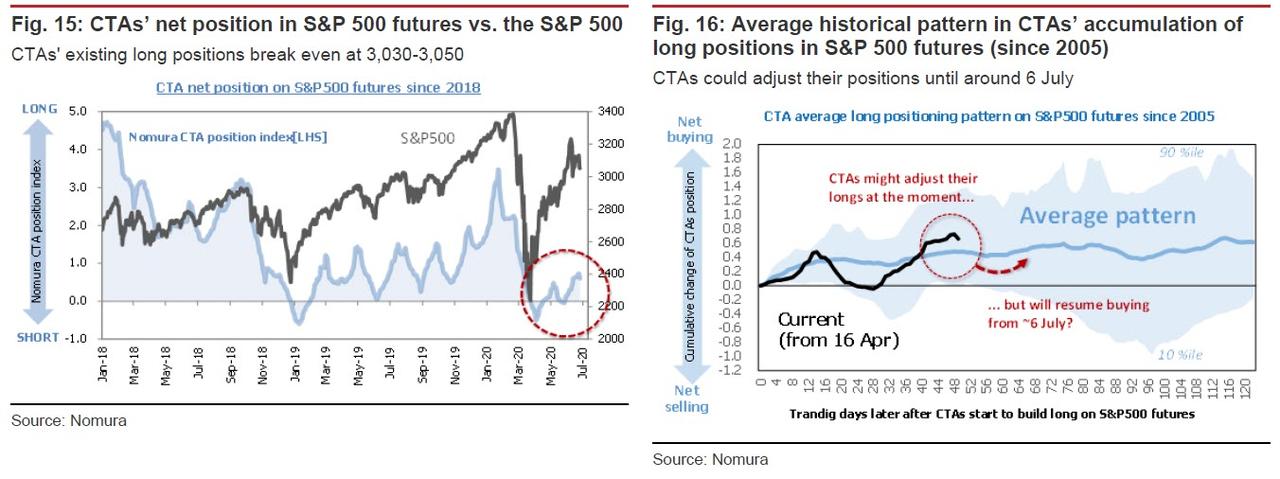
As CTAs’ long positions in NASDAQ 100 futures break even around 8,900 (the cost of new buying since April), they are likely to be looking to buy on dips for now, even as Nomura estimates that they have gone net short again on Russell 2000 futures.
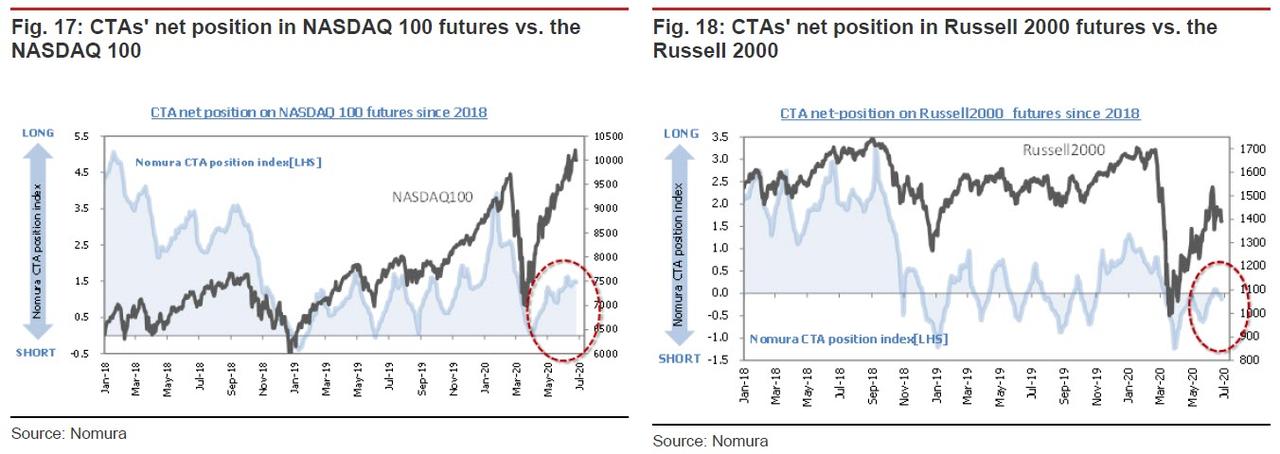
In fact, CTAs’ trading of NASDAQ 100 and Russell 2000 futures could be said to be determined by “pattern ruts”. Portfolio performance for US high-P/B stocks versus small-cap stocks, like the first point mentioned above, look very much to be following a predictable pattern of outperformance.
via ZeroHedge News https://ift.tt/37Yisli Tyler Durden