Goldman: We “Don’t Love Risk/Reward Up Here… Starting To Worry About Valuation”
Tyler Durden
Tue, 06/30/2020 – 14:40
By Tony Pasquariello, global head of HF Sales at Goldman Sachs
The dominant narrative of the week was a return to trading COVID headlines, as the worst period for US case growth since April served as disruption for those expecting business-as-usual trading conditions this summer.
Along the way, stock operators absorbed another heavy dose of deal supply — adding to what will be a record month and record quarter for US new issue — with quarter end looming. On the week, S&P lost 2.9%, although one can reasonably argue the market traded with decently thick skin.
In fact, when you get below the hood of the major indices, there were a number of sub-plots that were patently bullish — witness the breakout in biotech or the ongoing (and blistering) surge in high valuation software stocks.
In the end, I think you have to be a little impressed with the market’s ability compartmentalize the risk factors and manage through some genuine headwinds.
At the same time, however, it’s getting harder to dismiss the argument that certain parts of the equity complex are approaching bubble territory … more on all of this below, which a chart heavy note that you can get through in less than five minutes.
* * *
1. Market direction: I admit to not loving risk/reward up here. one can see the tactical argument quickly turning to “quarter end is nigh, the fast hands in retail are very long and it’s naïve to think the reopening will be a smooth process.” when coupled with the news on case growth, and a growing set of known unknowns, it’s not crazy to expect some struggle around current prices (notably, a confluence of key levels). That said, the dangerous thing about being short risk assets right now is the Fed is still going full throttle; so too is one segment the largest holder of domestic equities, the younger vintage of US households.
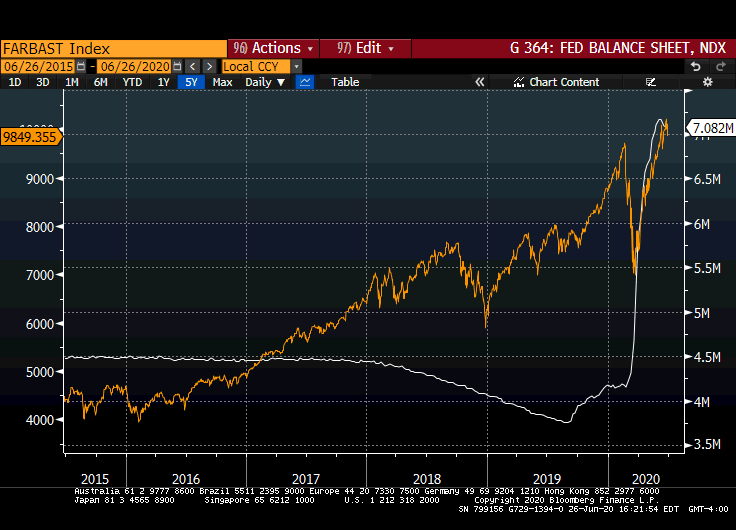
As a wise macro trader recently said, stocks follow liquidity — recall that GIR expects zero rates for 4-5 years (and another $1.5tr of fiscal support this summer; link). in the end, if you strip everything else out of the equation, you’re left with two dominant investment forces right now: the Fed and the US retail investor. They are both driving very fast in the same lane. Yes, I’m concerned about how this story ends — but, note the following chart, a simple overlay of the Fed’s balance sheet and NDX. We started the year at $4.22 tr. GIR expects to end the year at $7.75tr and to end 2021 at … $8.9tr (link).
2. Flows/positioning. A mark-to-market on some key actors:
i. quarterly derivatives expiry has come and gone, in the process we burned off ~ $2tr of open interest in S&P options. To an extent, the print lived up to its billing with a very high SQ (3161 in SPX). again, I’m a believer that one needs to respect the occasional power of expiry to mark inflection points, so I tend to think 3161 becomes a level to watch overhead in the near-term. I don’t want to make too much of quarter end rebalance — it’s exceptionally well socialized — but, it does suggest some programmatic selling needs to be absorbed.
ii. Within the institutional trading community, systematic funds are generally inconsequential at current market levels (link). Discretionary funds are still decently risked up, more with respect to net exposure than gross exposure on our books (and noting the micro community is more sanguine than the macro community, where sentiment remains perceptibly negative). All taken together, I don’t see any big asymmetry in hedge fund land.
iii. The bifurcation continues within the retail community. Again, an older generation continues to make sales via mutual funds and ETFs (link); a younger generation continue to trade stocks like it’s 1999 (“free trades, jackpot dreams lure small investors to options”; link). At some point, the $64,000 question is … where are we in the retail cycle? Having lived through the late 90’s, I tend to think the recent euphoria can persist a bit longer.
iv. The market continues to do a commendable job of absorbing round after round of record corporate new issue (which is to say, $230bn in the past seven weeks, with half of that in the US). It’s totally remarkable to me that the dynamics around corporate supply-and-demand have changed so enormously in the past three months, and yet the market has largely powered through it all.
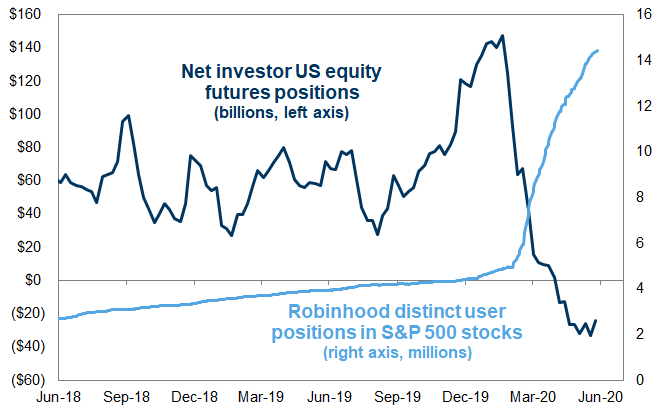
v. To pull a few positioning angles together, this chart tells a certain story. The dark blue line is US equity index futures positioning (non-dealers), as reported by the CFTC. the light blue line is the number of distinct positions open on the Robinhood trading platform in S&P 500 stocks (credit Ben Snider, GIR). These are apples and oranges … we’re comparing $’s vs line items here … And, it’s by no means an all-inclusive capture of all market participants … But, I do think this illustrates a stark disjunction between one segment of the professional trading community and one segment of the retail trading community:
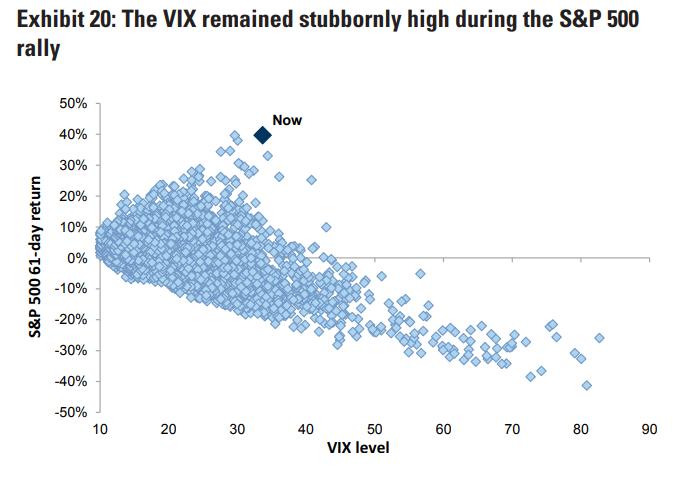
3. Volatility: the market has obviously recovered hugely from the lows of March. That said, volume and volatility remain elevated. Put another way, S&P over 3000 and VIX over 34 is not something many would have predicted just a few months ago. So, as you can see in the clever chart below from GIR (link), implied volatility has remained sticky in a very unusual way. Is this a signal or is this noise? I suspect it’s reflective of a handful of factors:
i. The market continues to realize a decently high level of actual volatility. While clearly things aren’t as unhinged as they were in March — when three consecutive days featured +9% / -12% / +6% moves — the fact is 1-month realized volatility is still 32%.
ii. While the broader market feels a bit complacent to me on the US election, the vol market isn’t necessarily. Again, November expiry features the peak of both term structure and put-call skew.
iii. Furthermore, intuit what the current VIX level mathematically implies. Bluntly speaking (i.e. more back-of-the-envelope vs deeper math), a 34 VIX signals 2-in-3 odds the market will be +/- 34% from here over the next one year. it also implies for the next month an average daily move of around 1.7%. I don’t think this is so off-market given the range of possible outcomes.
iv. On flow-of-funds, it seems quite reasonable to assume the dynamics around the supply of volatility are very different today than they were at the start of the year.
v. The moral of this story: vol is high. As you can see here, it’s been sticky in a very aberrational way. My guess is that while yield hunters ultimately find their way back to the supply side, the current story persists a bit longer. GIR: “the potential for the current high vol regime to linger for longer remains high, in our view. As we have written before, volatility tends to cluster: since 1928 there have been several high and low vol regimes during which S&P 500 realised volatility has clustered for prolonged periods of time (at least six months) in the bottom (<10%) and top (>18%) quartile, and on average such high vol regimes lasted 26 months. our volatility regime model, which aggregates macro, macro uncertainty and markets indicators suggests close to a 100% probability of a high volatility regime in the near term” (link).
4. Quick Points:
i. Economics: GIR’s updated profile for US GDP growth: Q2 -33%, Q3 +33% and Q4 +8%. That rolls up to FY ’20 -4.2%, an upgrade vs the previous forecast of -5.2%. further note that US GDP returns to the pre-virus base level in mid-’21 (that doesn’t sound so bad, does it). the full note: link.
ii. A steady and significant decline in market liquidity has been an inconvenient truth of the past ten years. Like many things, that decline went into overdrive during the collapse. I find that discussion of illiquidity receives a lot of air time when markets are breaking down. by comparison, it receives much less attention on the way back up … but, that shouldn’t suggest it isn’t a contributing factor to price action in rallies.
iii. Maybe I shouldn’t have been surprised by this, but I was (emphasis mine; feel free to visualize the chart of asset growth in money markets as you’re reading this): “the third implication is that the private sector may react to the increase in cash and deposit holdings forced on it by the Fed by seeking other, riskier higher yielding assets. in fact, this is a major motivation of quantitative easing. by reducing the supply of safe assets and increasing the amount of deposits that the private sector must hold, the Fed generates a demand by the private sector for more risky assets. the result is a rise in financial-asset valuations and an easing of financial conditions. the Fed’s asset purchases change the mix of assets available to be held by private investors and this influences asset valuations.” Bill Dudley, “A $10 Trillion Fed Balance Sheet Is Coming” (link).
iv. I didn’t favor European assets coming into the crisis, and I don’t favor them now. For the sake of balance, however, this from GIR is notable: “we therefore expect a steeper and smoother rebound from the coronacrisis in Europe than the US. although we have recently upgraded our forecasts on both sides of the Atlantic, we now look for significantly stronger growth in the Euro area than the US over the next two years. while much of this reflects the unwind of the sharper activity drop in Europe, a sustained period of European growth outperformance has not been seen since 2006-07. consistent with this, our markets team expects European assets to outperform over the next year. our equity strategists see more upside in Europe than the US in coming months and raised European equities to overweight in our asset allocation, although they are less convinced that Europe can outperform longer term. on the fixed income side, we expect the Euro to strengthen against the dollar, reaching 1.17 in twelve months, and see a more gradual sell-off in Bunds than Treasuries” (link). here’s one simple compare/contrast … US GDP profile: -4.2% ’20, +5.8% ’21, +3.2% ’22. EU GDP profile: -9.4% ’20, +8.8% ’21, +3.6% ’22.
* * *
5. The attached note from Peter Oppenheimer is a treasure trove for market aficionados. here are three charts that stuck out to me:
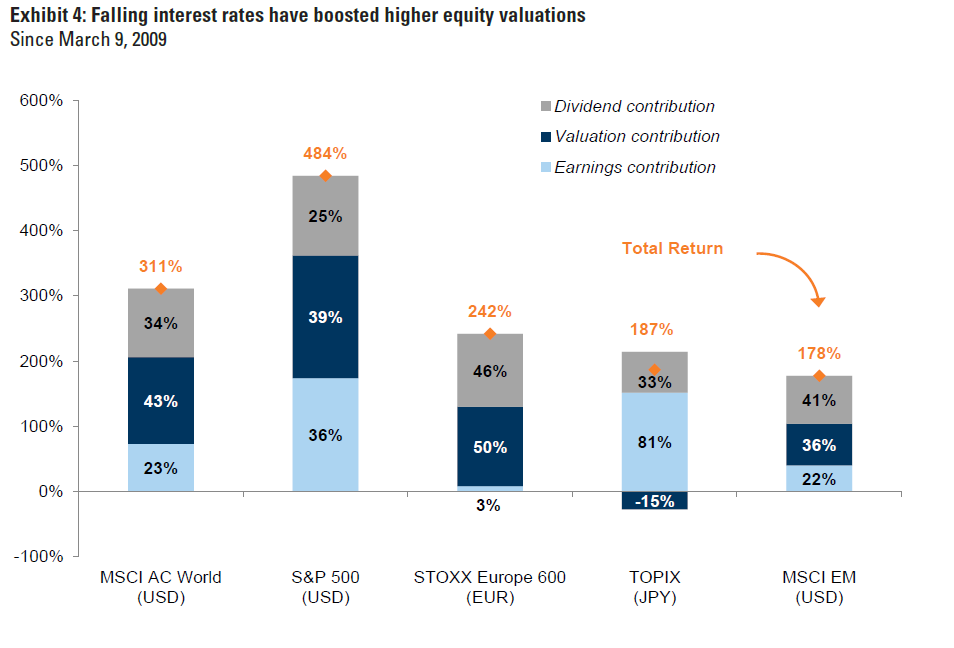
i. sales & trading colleague Brian Friedman and I have a long-standing debate about how much of the post-crisis equity rally has been driven by the multiple (as influenced by lower real rates) and how much has been more “genuine.” I think this graph allows us both to claim victory. yes, P/E expansion has been the single largest factor in the rally; that said, P/E expansion accounts for less than half of the total rally:
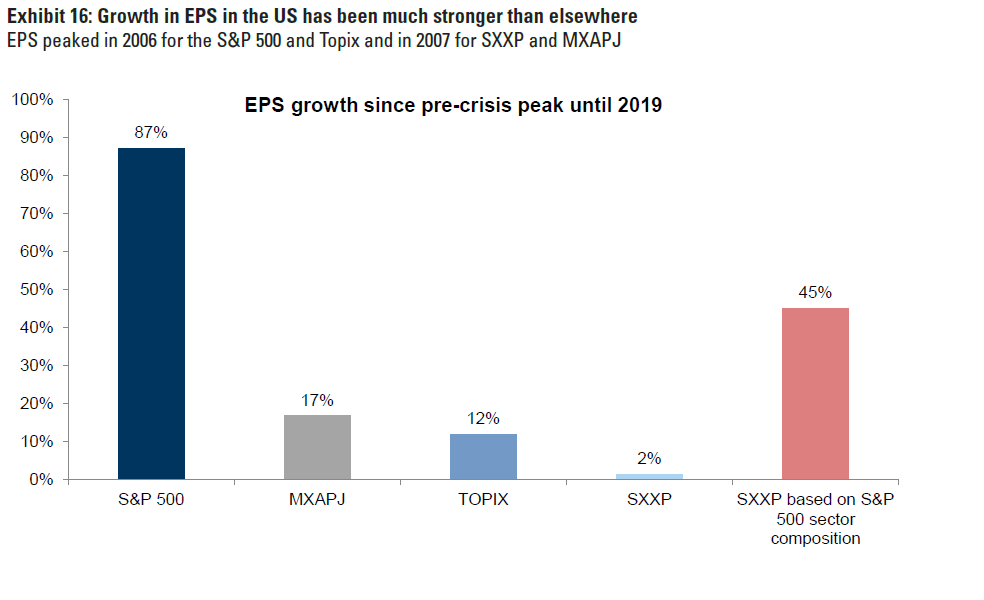
ii. On the topic of US vs Europe, again the story of US outperformance largely traces back to an EPS differential (driven by a sector differential):
iii. You’ve seen this before, and it continues to speak for itself:

6. As a wise macro trader once said, lower-for-longer is very stimulative for the multiples of secular growers. This reminds me a little of the amplifier discussion from This Is Spinal Tap: “these go to eleven.” “does that mean it’s louder?” “well, it’s one louder isn’t it?” … (link). to circle back to where this email started, yes, I’m starting to worry about valuation in certain parts of the market. If the Fed keeps expanding their balance sheet and pressing real rates lower, however, it’s not obvious to me that the normal rules will apply in the near-term. The blue line here is inverted US 10yr real rates; the blue line is NDX:
Source for charts: GIR, Bloomberg
via ZeroHedge News https://ift.tt/2Vz2vgh Tyler Durden