Market Technicals: Five Key Levels On Verge Of Breakdown
Tyler Durden
Wed, 07/29/2020 – 15:44
Value investors swear by fundamentals, news and data (or at least they used to before the Fed took over markets). To technicians, there is nothing sexier than a strategically planted squiggle or a trendline breaching some other line.
Case in point, in his latest daily note, BofA’s chief technician Paul Ciana writes that “there is nothing better than a candle chart with a variety of technical indicators, lines, Fibonacci’s, technical patterns, wave counts and even more drawn on it, in my view. Sometimes the more the better as I evaluate them all and take a weight of evidence approach to conclude a bullish or bearish bias. But it can be a lot, maybe too much.”
It gets better. To explain how he “gets to the bottom” of what a chart is saying, Ciana writes that he spends “part of our time evaluating weekly line charts with just a few trend lines on them. We call this the “forest for the trees” approach.” It’s also known as massaging and goalseeking the chart until it shows whatever you want it to show.
It is simple and bigger picture. Just a line chart with some trend lines and maybe a 200 week average. Why? To neutralize the noise. During the week investor actions discount available information into price that causes price to swing. We like to know where it ends because when markets close for the week the battle is over. The weekly close shows if something changed and who the winner is. In this report we recap trend lines and highlight 5 weekly chart lines to know.
Good-natured humor at Ciana’s (and all technicians’) expense aside, we do want to highlight what Ciana has found in his latest trek through the charts, namely 5 trendlines and major levels that appear to be “under siege”, focusing on the Euro, DXY, BBDXY, Gold, and USDJPY.
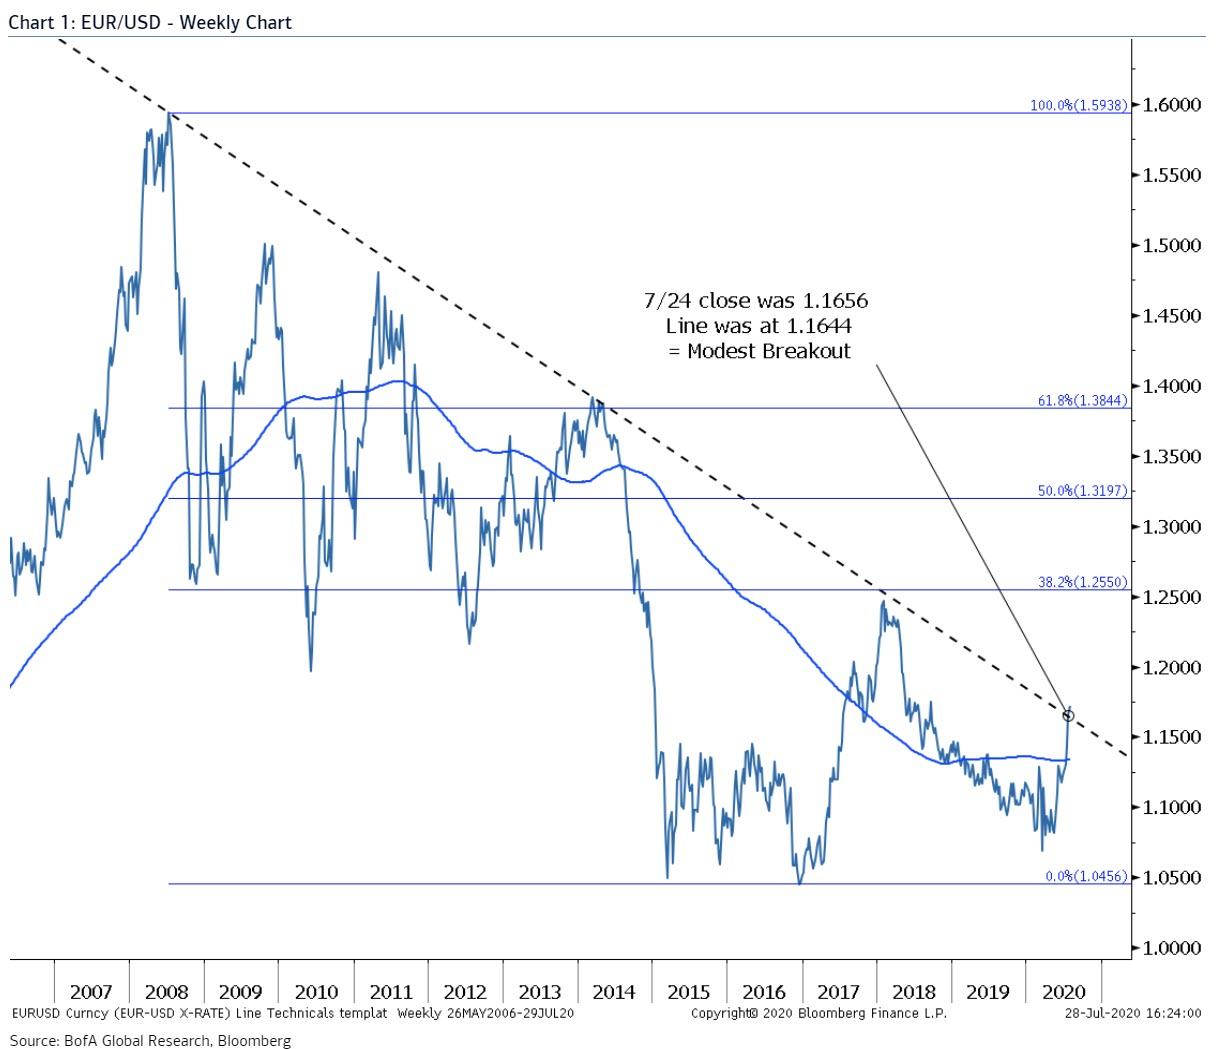
Euro: 12 year old downtrend line narrowly broken
Ending the third week of July, euro closed at 1.1656 which is above its weekly closing resistance line at 1.1644 (a small bullish breakout). An overbought correction is due in August/September where an uptrend may resume after. To further confirm this break, look for a second weekly close above 1.1644 and/or a weekly close above 1.1760 which is more than 1% above this trend line. If this occurs then it supports the bullish evidence and to buy a forthcoming Aug/Sept dip.
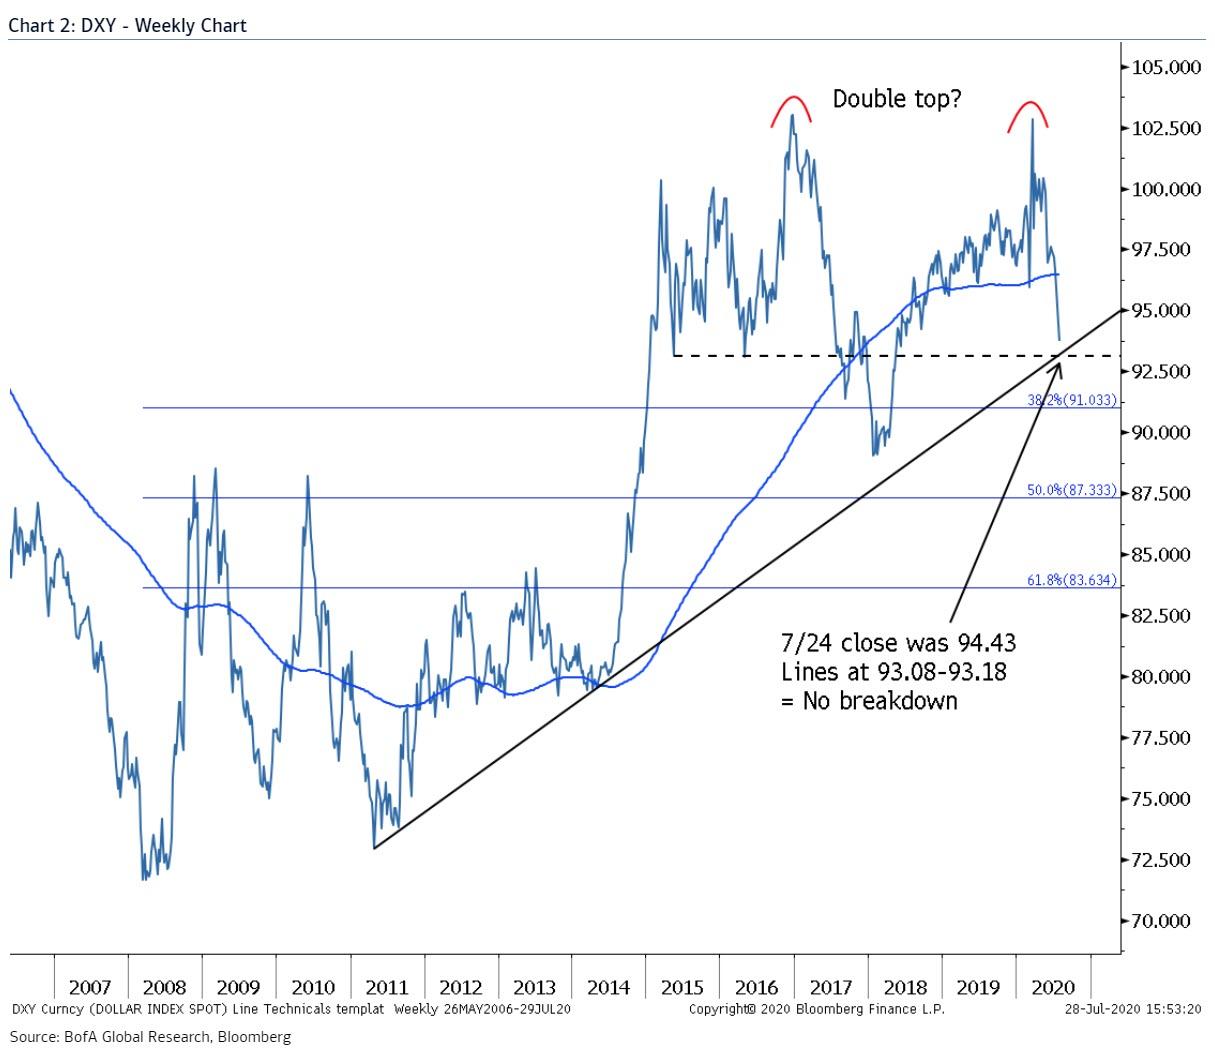
DXY: Getting close to a breakdown
The DXY has declined near its 10 year support lines at 93.08-93.18. Ending the third week of July the DXY closed at 94.43, so no breakdown yet. For now we wait and see. Given the characteristics of a trend line, this line was only touched twice so it is not an exemplary line like those in the primer section of this report. We watch it because on a candle chart the lows connect better to including the 2018 lows. We also see risk of a big double top forming that implies downside to the Fibonacci retracements in the 87s and 83s is possible.
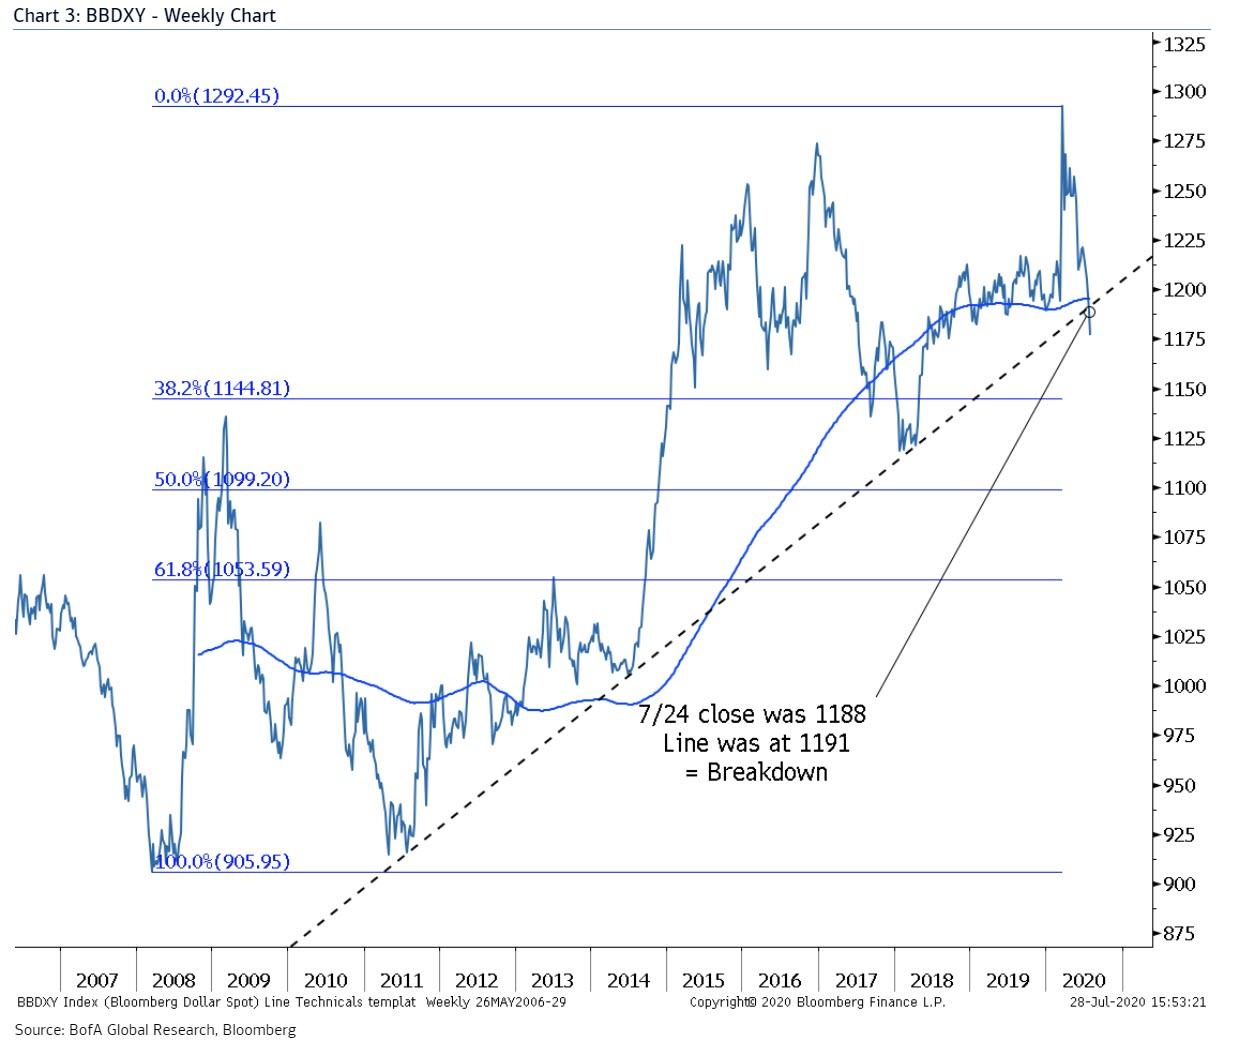
BBDXY: Marginal bearish breakdown
Ending the third week of July the BBDXY closed at 1188 and its support line was at 1191. This is a small bearish breakdown. A second weekly close below 1191 and/or a weekly close below 1180 (1% below line) increases conviction in the break. Should this be true, the next medium term support is the Fibonacci retracement at 1144 and the 2018 lows at 1120.
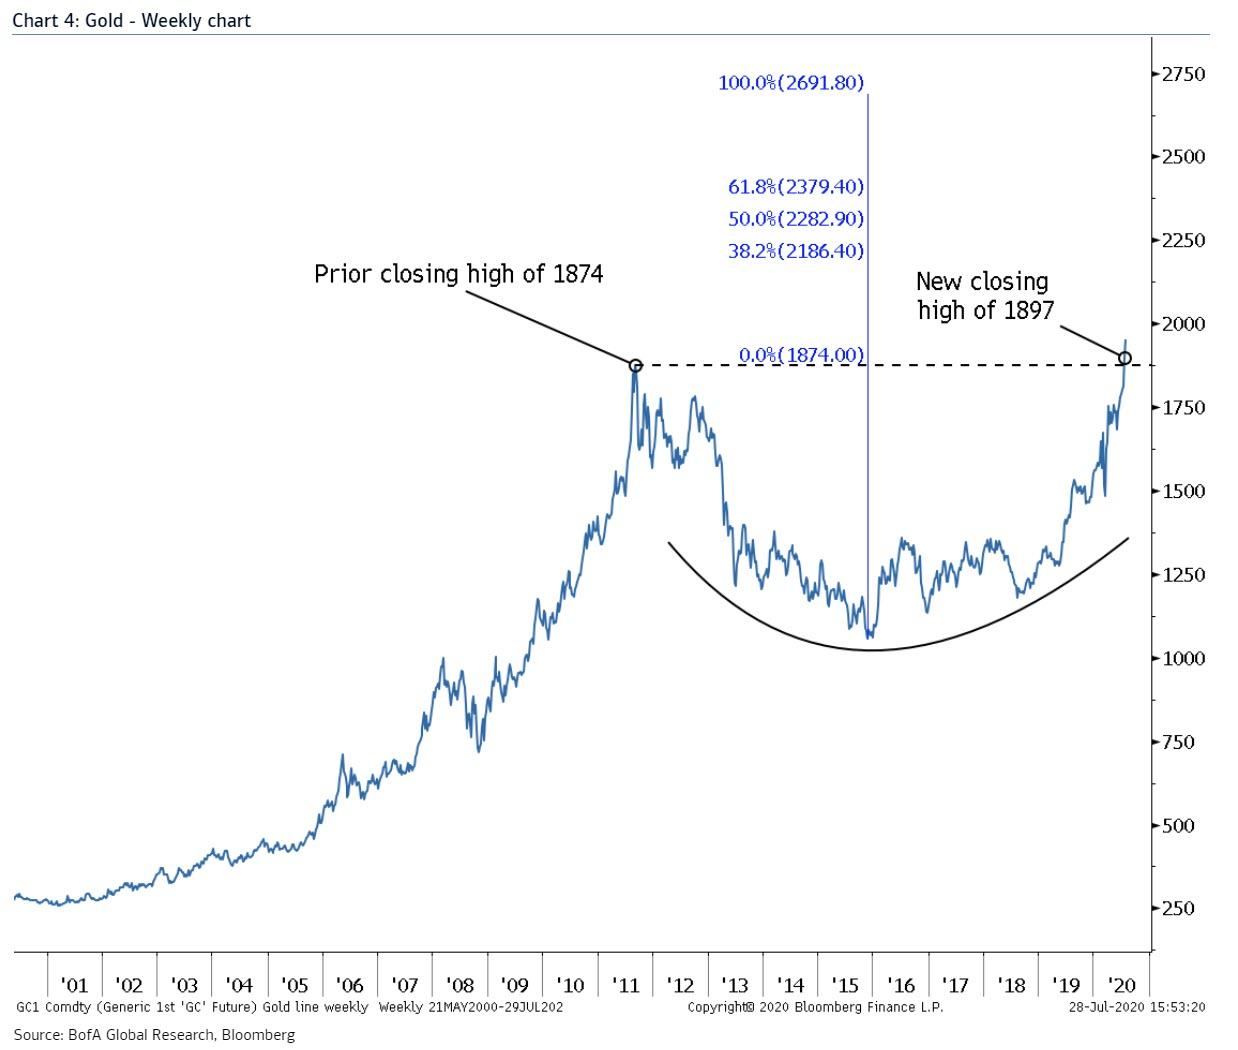
Gold: Highest weekly close on record, now what?
Ending the third week of July Gold closed at a record of $1897. This was above the prior closing high in 2011 of 1874. That’s a +1% break = Still bullish and still buy dips. At the risk of over simplifying, a chart that is smiling should be bought and held. Our target range from over a year ago is $2114-2296 however using the below we can calculate a few more levels to be aware of including 2379 and possibly 2691.
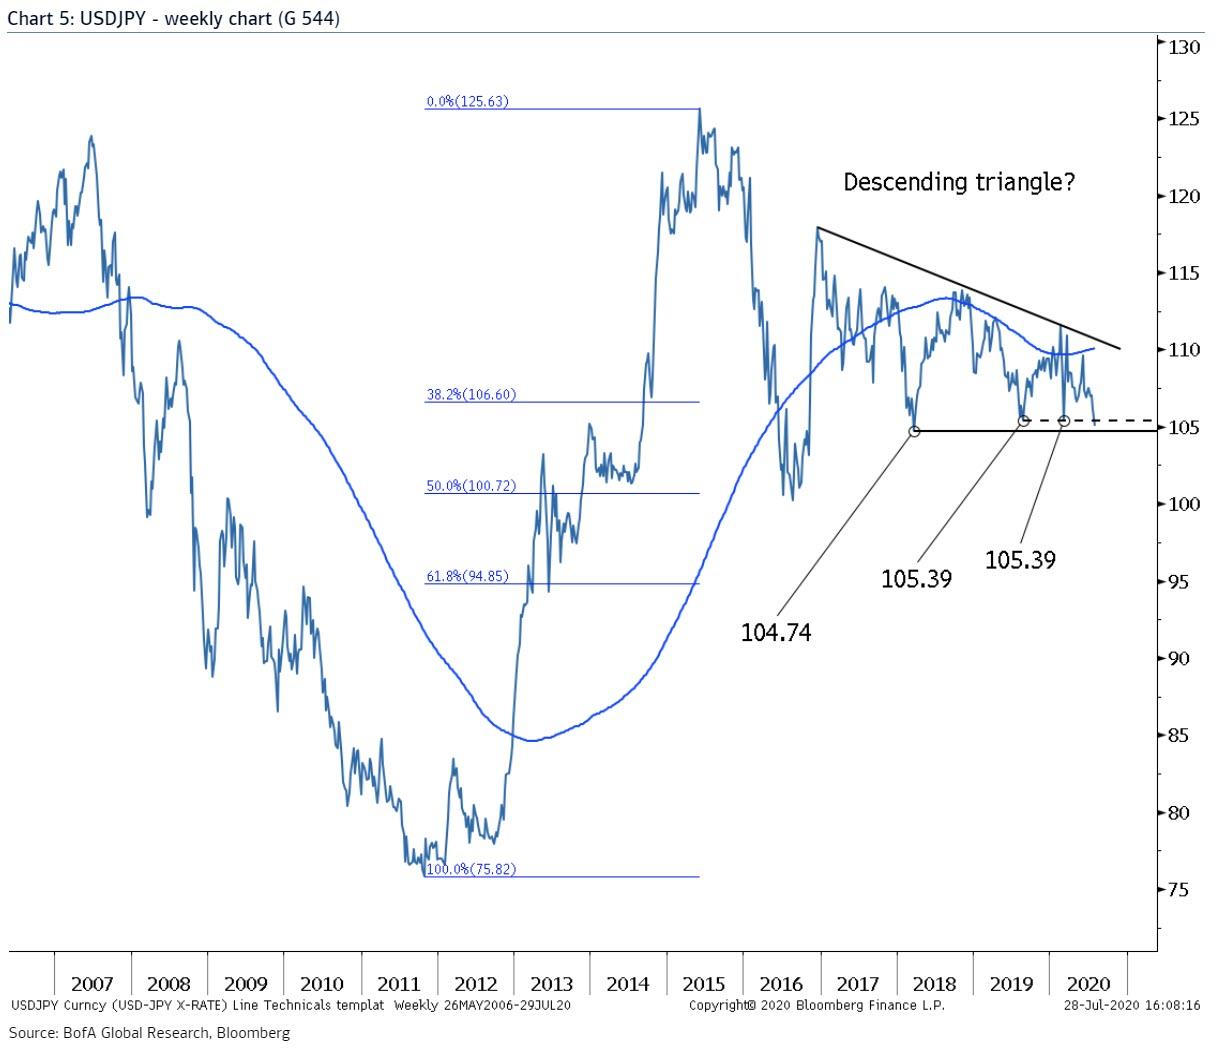
$/JPY: 106 sort of mattered but not as much as this
On a daily candle chart, yes the break of 106 mattered. However the two weekly closing lows of 105.39 are what matter more for the bigger picture. This was the same weekly closing value in March 2020 and in August 2019. In March 2018 it closed at 104.74. So there is still some support nearby and is probably why $/JPY hasn’t sold off more from a technical view on the break of 106. A descending triangle pattern (unconfirmed until a break happens) implies a break lower could follow with 100.72 and 94.85 possible.
via ZeroHedge News https://ift.tt/336jVFz Tyler Durden