Why Even A Small Uptick In Volatility Could “Kick-Start A Massive And Painful Domino-Like Liquidation Event”
Tyler Durden
Thu, 07/30/2020 – 14:05
By Ryan Fitzmaurice and Christian Lawrence of Rabobank
The market is massively “short” volatility
[W]hen it is time for us to sell, or even to stop buying, the response could be quite strong; there is every reason to expect a strong response. So there are a couple of ways to look at it. It is about $1.2 trillion in sales; you take 60 months, you get about $20 billion a month. That is a very doable thing, it sounds like, in a market where the norm by the middle of next year is $80 billion a month. Another way to look at it, though, is that it’s not so much the sale, the duration; it’s also unloading our short volatility position.
Jerome Powell, October 23-24 2012 FOMC Meeting
Summary:
-
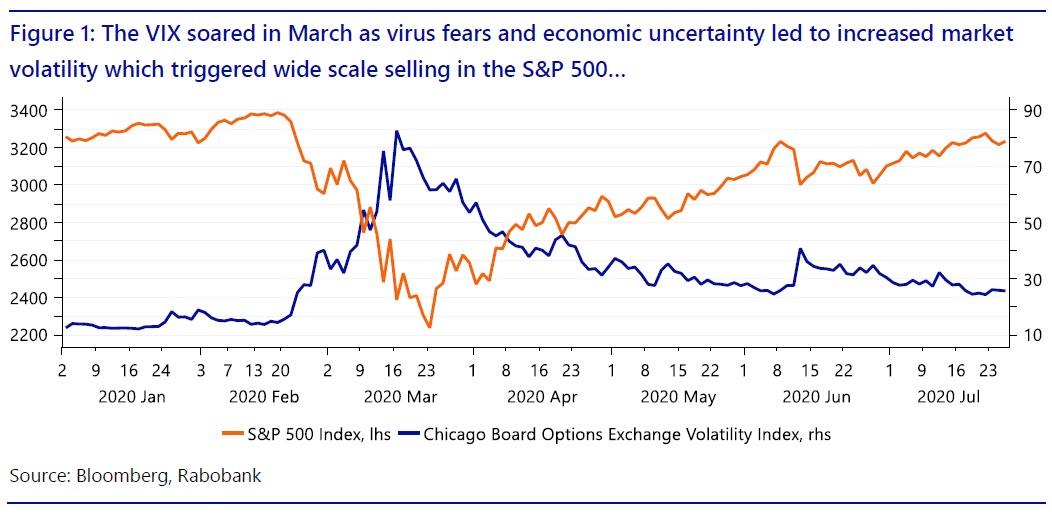
The early March virus fears and economic uncertainty caused a spike in market volatility which then translated into large scale and indiscriminate selling across asset classes
-
Objectively speaking, a Biden win in November would result in US economic policy volatility given it would result in a total reversal of Trump’s recently enacted measures
-
Based on current polls, the probably weighted outcome is for increased market volatility ahead of the US election which could lead to wide scale de-risking for the 2 nd time this year
-
Risk parity funds, CTA strategies, and retail ETF liquidation coupled with VaR constrained swap dealers could lead to a perfect storm of risk-asset selling in the back half of this year
-
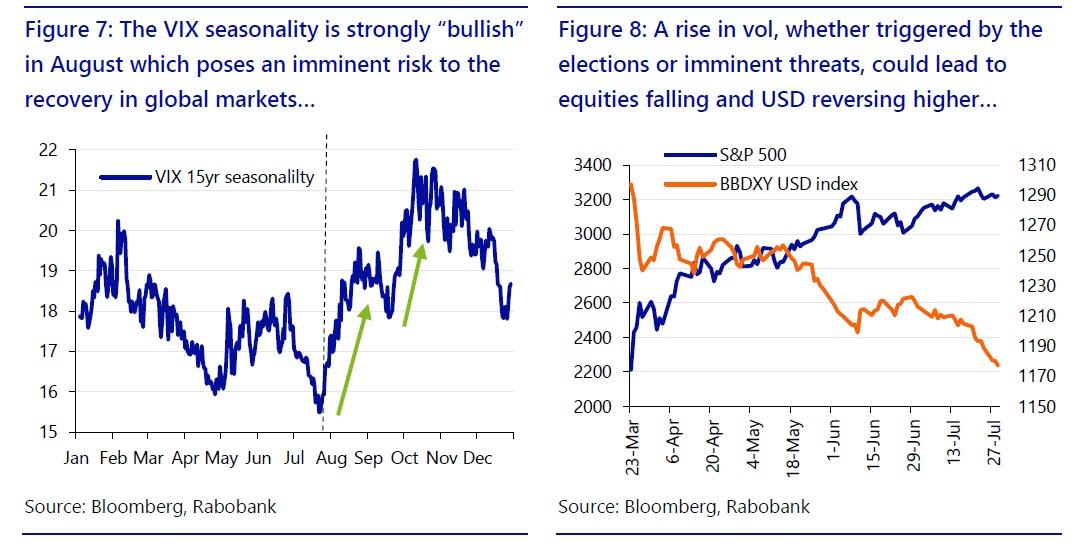
In short, we see volatility as the key to unlocking cross-asset performance going forward and a rise in vol, whether triggered by the elections or imminent threats, could lead to a sequence equities falling, USTs gaining further ground, and USD reversing its recent weakness.
Probability weighted outcome
The US presidential election is now less than 100 days away if you can believe it. One certainly would not know this by looking at the VIX or any other market volatility indicator as far as we are concerned. In fact, market volatility has been on the decline, albeit from a very high base, ever since global markets bottomed out after the panic and virus triggered but volatility driven selling witnessed back in March. The reason we word it like this is because in today’s machine-driven world, understanding the actual mechanics behind the dominant trading algorithms in the market is an essential survival skill. The fact of the matter is the vast majority of today’s trading algorithms use some form of volatility targeting approach in determining the appropriate position size per sector or asset class. As such, volatility is an explicit input to many strategies in today’s markets. This dynamic can and often does lead to negative feedback loops such as we saw back in the market downturn in March when the virus fears and economic uncertainty caused a spike in volatility which then translated into large scale and indiscriminate selling across asset classes. After all, computers only do what they are programmed to do and when volatility goes higher they are forced to reduce position sizes in order to maintain the desired portfolio volatility target.
The fact that machines employ no discretion can lead to massive herd-like behavior as all systems execute in the same direction at the same time. More recently though, it’s been the “bid” side of the market that the dominant trading algorithms have been sitting on due to the fact that market volatility has been falling. This takes us back to our original statement with respect to the not too distant presidential election. The latest polls suggest it’s very much a toss-up which leads us to consider the probability weighted outcome for stock market volatility based on the election result given that the two platforms are diametrically opposed on many major economic issues. We are mindful here to focus on volatility rather than stock market levels as that is what is likely to matter more. With that in mind, the policy shock would likely come from a Biden victory, as we see it, given that Trump is the incumbent. A Biden victory would surely mean a quick reversal of many of Trump’s signature economic decisions including trade deals, tax cuts, environmental regulations, and the list goes on. Objectively speaking, a Biden win would result in US economic policy volatility given it’s only been very recent that Trump has enacted his own measures. In our view, it would be difficult for the market to ignore such an abrupt policy reversal and market volatility would need to reprice higher as a result. If Trump were to win a second term then perhaps volatility would remain much the same given the policy and economic direction of the country would remain on the same track. So in our view, if the race is indeed a coin toss at this stage, then the probably weighted outcome is for higher volatility in the months ahead and as the election approaches which could lead to wide scale selling for the second time this year no less.
Risk parity funds
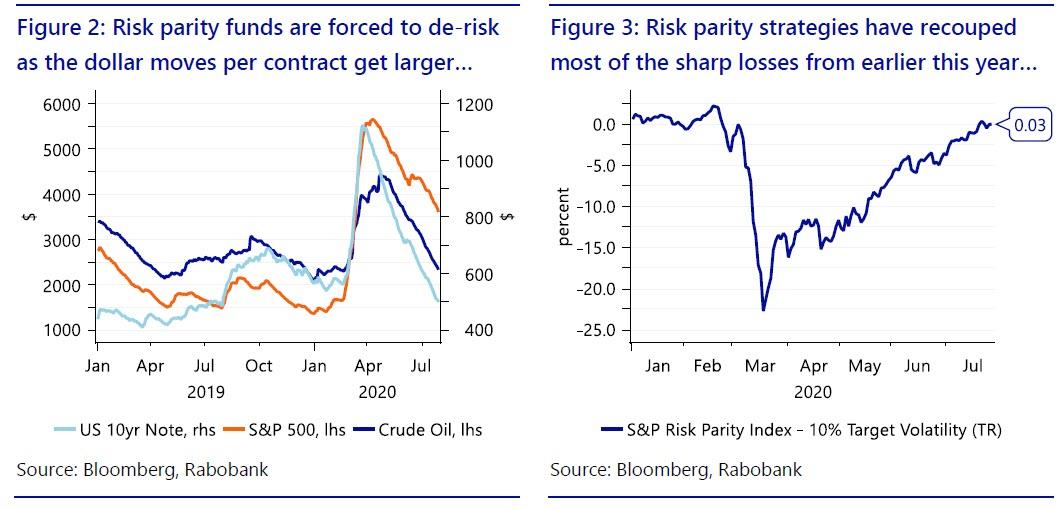
Risk parity type funds are arguably some of the most influential participants in today’s global markets. The risk parity allocation method is often associated with famed investor Ray Dalio, the founder of massive hedge fund Bridgewater, which is one of the largest funds in the world with asset under management in the 150 billion USD ballpark. The approach itself is really quite simple and as its name implies, its core philosophy is to allocate risk based on market volatility so that each sector or asset class contributes equally to the overall portfolio return. As such, risk parity type funds typically hold risk equally among equity, fixed income, and commodities markets which differs from the traditional asset allocation approach of roughly 60% bonds and 40% equities with no commodities exposure. They key distinction between these two asset allocation approaches though is the volatility aspect which is a direct input to risk parity funds allocation decisions but plays no part in the traditional approach. It’s exactly this volatility aspect that can cause the nasty feedback loops where all asset classes fall at once such as they did earlier this year when risk parity funds were forced to deleverage in mass and into falling markets. Risk parity funds have spent the last few months buying back those positions that they sold in March but at higher levels, however, a spike in volatility now risks giving back all those hard fought gains.
CTA & risk premia strategies
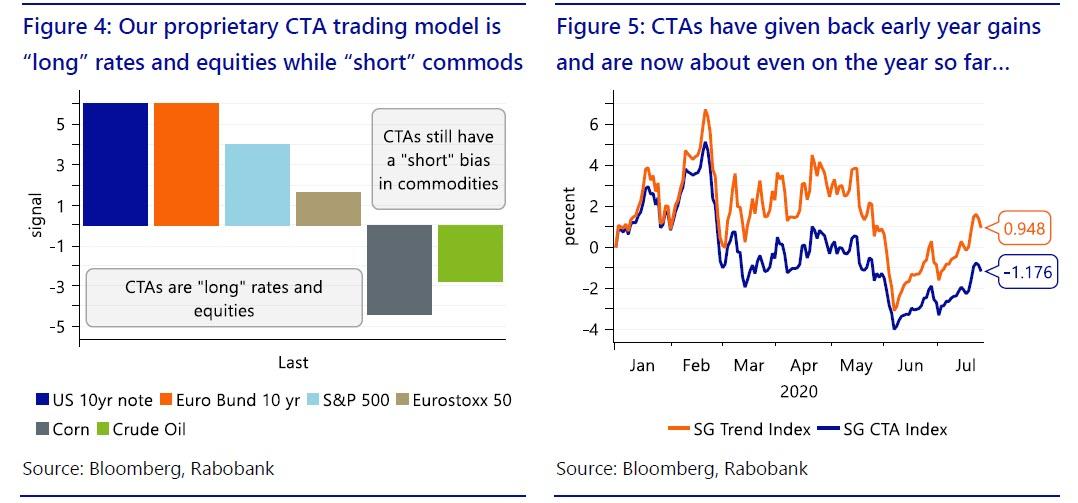
Another class of influential traders across global markets is CTA and risk premia strategy funds. CTAs and risk premia strategies are somewhat distinct approaches but are often correlated so we will group them together here for this purpose. In fact, the term CTA has become somewhat synonymous with trend following or momentum trading while the risk premia umbrella also includes other market factors such as carry, congestion, or volatility programs. The vast majority if not all of these funds are now systematically based and like the risk parity funds they tend to create herd like behavior. This category of traders is different from risk parity funds, however, in the sense that they are “long/short” rather than “long-only” but the thing that makes them similar in a way is the volatility based approach to position sizing. CTAs and risk premia strategies generally involve trading across asset classes and each underlying has a different volatility profile. To adjust for this fact, funds will volatility adjust position sizes to meet the overall portfolio target just like risk parity funds do. Given that CTAs are “long/short”, one must first know what the net position is in each asset to understand whether a spike in volatility would lead buying or selling on the margin. For this purpose, we look to our own proprietary CTA trading model and find that the current exposure is a net “long” position in interest rate and equity futures while holding a net “short” position in commodities. As such, a spike in cross asset market volatility would lead to CTA selling in interest rate and equity futures, however, we would expect to see buying in the commodity sector as “shorts” are covered and position sizes get reduced, an important caveat.
Retail ETPs
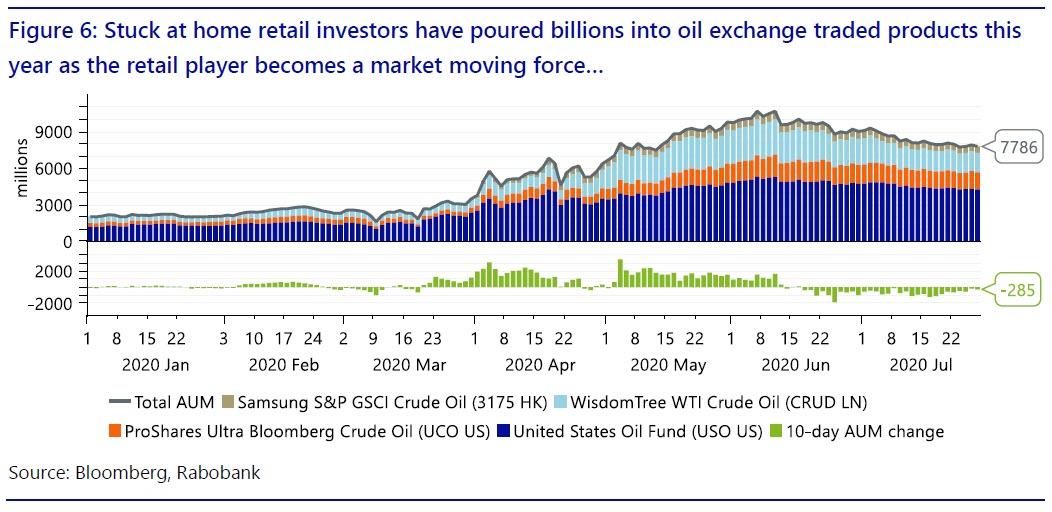
This year has truly been historic on a number of levels and with that another group of powerful traders has emerged on the back of the virus inspired global lockdowns. In fact, millions of people around the world have turned to financial markets for their sense of excitement given that sports and entertainment have largely been on hold for the past few months. In fact, some US brokerages have reported double digit percentage increases in new account openings year-todate. This theme was already underway with many US brokerages moving to zero commission trading while some newer companies specifically target a younger audience with the ‘gamification’ of mobile phone trading applications. This dynamic has been exacerbated by the global stimulus programs that have added ample liquidity to the markets in the form of government checks that have often wound up in retail brokerage accounts. Historically, retail has often been considered by many institutional investors as a counter-indicator with many a mantra implying that retail are always the last to the party and their entrance in itself suggests that a rally is likely coming to an end. In 2020, however, it is fair to say that retail was one of the first categories of investors to dip their toes in at the March lows. Although outright volumes pale in comparison to the institutional world, retail has played a significant role in the equity rally seen since March 23rd and the trend for OTM call options leads to an outsized impact on the market as dealing desks are left with a short gamma positions forcing them to buy as prices head higher. The role of retail has been on full display this year and very notably so in some other key assets such as oil where retail interest in exchange traded products has spiked. In fact, we have written about this extensively in our oil focused notes this year as it has been such a key market driver. In brief, the amount of capital that has poured into oil ETPs has truly been amazing to watch with close to 10 billion USD in inflows this year. The retail oil interest is and was largely a function of the media clickbait that followed the negative price event for oil in April, as we see it. A similar phenomenon was at play as retail investors rushed into recently bankrupt stocks with the thought that they are buying something historically “very cheap”. Clearly there has been a great deal of FOMO (fear of missing out) involved as well as some impulsive decisions from retail players. The fact is that the retail investor is now a meaningful “long” in global markets but we suspect that this position is held with little conviction and will be quick to liquidate should volatility increase or should the market suffer any drawdown. So in a way the retail investor is “short” volatility as much as “long” overall risk assets. That’s not to mention that a wide cross section of exchange traded products have a short volatility component embedded in them, even if not specifically marketed that way. Take for instance, the slew of inverse and leverage ETPs that exist. These products have an implicit “short” volatility element as they tend to decay very fast during volatile market periods and can wind up underperforming their benchmark index by wide margins.
Swap dealers
So we just outlined three major categories of speculative traders who are currently “long” global risk-assets at the moment and in a very meaningful way with the exception of a CTA “short” position in commodities markets. Two of the three groups of traders are heavily systematic and incorporate volatility adjusted position sizing of some sort. The third group is discretionary in nature but largely uninformed and unlikely to suffer through periods of high volatility or large drawdowns for that matter. So what happens if we do indeed see a major risk-off event triggered by a spike in volatility leading up to the election? Who will be there to buy these massive waves of selling that are surely to come? The answer is likely a combination of swap dealers, market makers, as well as the HFT crowd of course. The problem is that swap dealers also work under rigid risk constraints especially in a post Dodd-Frank world. Most banks and swap dealers employ Value at Risk (VaR) limits which are calculated using a historical time series of returns to estimate drawdowns. As such, VaR is a function of market volatility and the more volatile an asset the less you can hold of it. So in short, liquidity dries up fast in a sharp downturn as swap dealers are forced to remain within the bank’s VaR limits. To make matters worse, swap dealers and market makers are generally “short” gamma from selling downside protection to the market. Hedging this negative gamma only amplifies the selling in a down market which feeds back into volatility.
Looking Forward
Looking forward, the global market recovery is hanging on by a shoestring. Any uptick in market volatility could kick-start a massive and painful domino-like liquidation event in risk-assets such as we saw earlier this year. The upcoming US presidential race is the obvious potential catalyst for increased market volatility given the current polls are indicating it is still anyone’s race. In our view, a Trump victory would likely lead to the same or even lower volatility given it would be more of what the market has already seen these past four years. On the other hand, a Biden victory would go a long way to adding policy uncertainty to the market which would likely result in much higher market volatility. As such, using the current polls give you a probability weighted outcome of higher volatility. That said, there are less obvious, but more imminent, potential drivers of higher volatility such as the strong positive seasonality historically witnessed in the VIX for August.
We remain particularly concerned about the month of August given the confluence of:
-
Very strong positive seasonality in VIX
-
Anti-trust hearings facing some of the largest companies in the S&P 500
-
The potential for further delays in announcing another fiscal stimulus package.
In short, we caution readers to not get too comfortable with the recovery witnessed over the last few months and to expect some fairly turbulent markets in the weeks and months ahead.
via ZeroHedge News https://ift.tt/3hL3BOG Tyler Durden