3 Reasons Treasury Rates Can Still Hit 0%: Part III, The Death Of Growth
Tyler Durden
Sat, 08/08/2020 – 15:30
Authored by Eric Basmajian via EPBMacroResearch.com,
-
Deflation remains a more credible risk, not inflation. The output gap suggests core inflation could sink below 0.5% in the coming years.
-
FX hedged Treasury yields remain higher than yields at home. This will increase foreign appetite for US rates.
-
From a longer-term secular standpoint, economic growth will fall into a new regime, sub 2%, which will weigh on bond yields.
-
Further stimulus from the fiscal side will delay the full extent of the deflationary output gap but will not change the end result in the final analysis.
-
As part of your balanced portfolio, long-term Treasury bonds are still a valuable holding as the path to 0% remains a probable scenario.
The first two parts of this series outlined important considerations for the Treasury market.
Part I discussed several common arguments in favor of inflation. Through a comprehensive overview of macroeconomic trends, we settled on the economic output gap as the best long-term forecasting tool for inflation, suggesting that core inflation is likely to sink near record lows in the coming years. A continued decline in the path of actual and expected inflation will weigh on the risk-free rate and push Treasury rates closer to the zero-lower-bound “ZLB” on the long-end of the curve.
Part II highlighted FX-hedged Treasury yields and argued that as long as hedged US Treasury rates remain higher than yields at home for Asian and European investors, this will be a constant force keeping a lid on US long-term rates and even pushing them lower if the US dollar falls and hedging costs continue moving towards 0%.
In the final part of this trilogy, we discuss long-run economic growth potential and suggest that real growth is going to fall materially short of consensus expectations at the Federal Reserve and the Congressional Budget Office. Using very reasonable assumptions, a base case estimate is that trend economic growth could sink well below 1.5%, pushing down the risk-free rate in the economy.
It is said that the GDP growth rate is the average rate of return on an economic investment for your mid-range risk. In other words, if GDP growth averaged 3.1% nominally or 1.4% in real terms over the last ten years, the average investment into the economy would yield roughly 3% nominally or 1.4% in real terms. These numbers are averages, and thus some projects may generate a 5% cash on cash return while others may break even.
If 1.4% was the average real rate of return on an economic investment, which involves some level of risk, the “risk-free” rate should fall below this level. Other factors play into the rate of Treasury bonds, and we have discussed many of them in past research notes. The expected path of the Fed funds rate, future inflation expectations, and more are all influential in the final analysis of Treasury rates.
Long-term Treasury rates can be simplified to the real rate plus expected inflation. The real rate is a function of many variables, including the expected path of the Fed funds rate and long-run economic potential.
Operating under the assumption that the Fed Funds rate is stuck at the ZLB for many years, we’ll take extra time to analyze long-run growth potential.
In Part I, we covered the secular decline in inflation. We disputed some common inflationary arguments, concluding that the rate of inflation will continue to fall over time, in line with the output gap. This conclusion implies that the next decade is likely to see inflation that drifts below the prior 10-year average of 1.7%.
Decomposing the equation above, the real rate will be pressured by an overnight rate that is stuck at the ZLB and disinflationary pressure that will remain pervasive. Tackling long-term trend economic growth is the final variable from the simplified equation that will help us determine the probable path of long-term interest rates.
Given that financial markets are forward-looking, let’s take a more in-depth look at what the economic cycle may bring us in terms of growth over the next decade.
Long-Term Growth Prospects
Throughout this note, I will be referencing a paper written by Anirvan Banerji, and Lakshman Achuthan of ECRI titled, “Cyclical Misconceptions Driving Policy Mistakes: Keys To The Productivity Puzzle.”
In this 2016 paper, the authors discuss the long-term decline in the trend of economic growth through the lens of declining productivity growth and why this trend is set to continue and likely get worse.
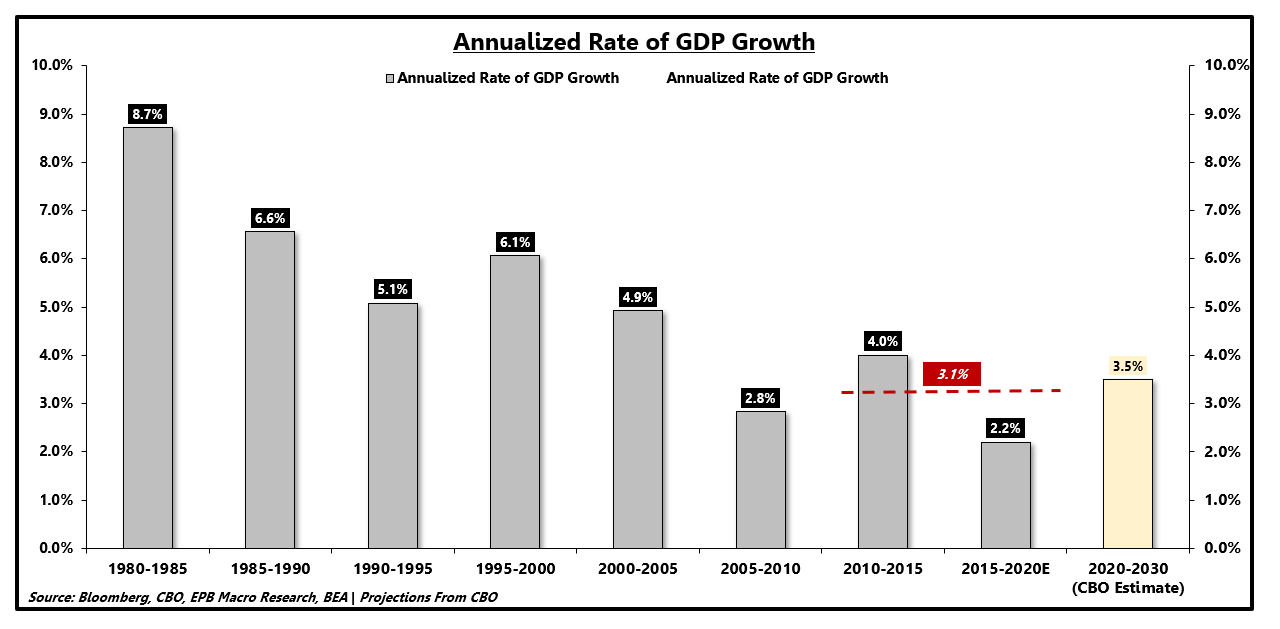
The chart below shows the annualized rate of nominal GDP growth segmented into five-year blocks. Growth has been drifting lower in nominal terms from all three vectors, softer inflation, lower labor force growth, and weaker productivity growth, averaging about 3.1% over the last decade.
Despite this consistent trend, the Congressional Budget Office “CBO” is forecasting the next decade to bring 3.5% nominal GDP growth.
US Nominal GDP: Annualized Growth (%):
Source: Bloomberg, EPB Macro Research
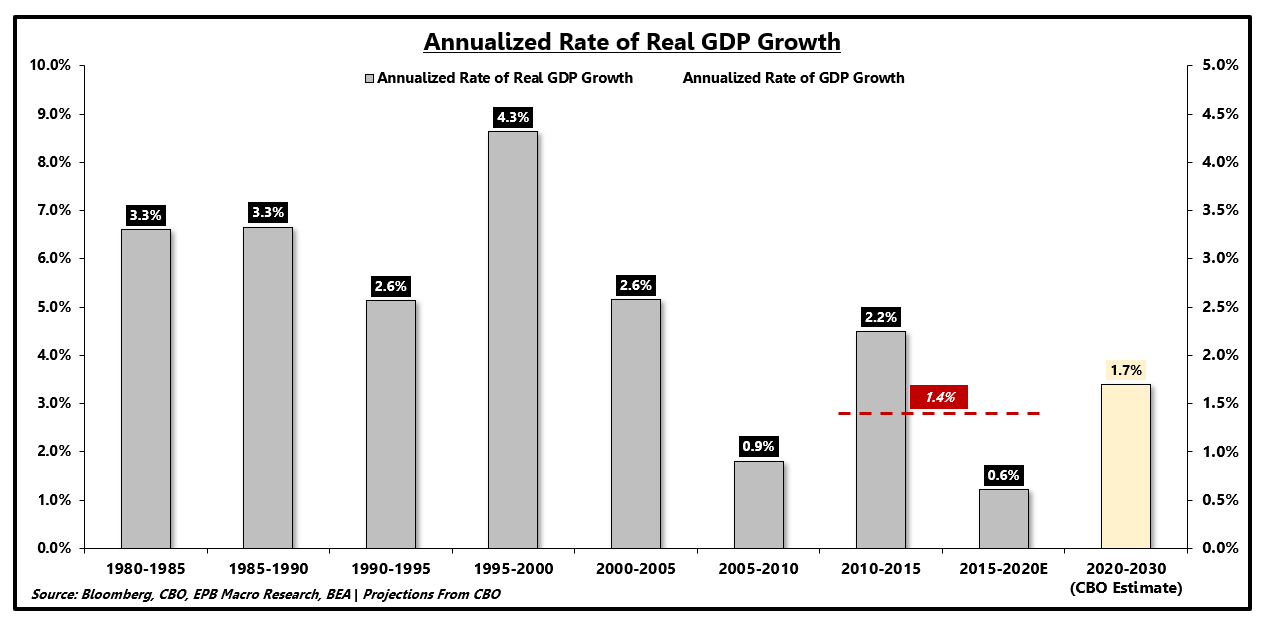
Given that we covered inflation in Part I, for the rest of this note, we’ll stick to long-term growth in real or inflation-adjusted terms.
In real terms, growth has been declining over the last several decades, averaging just 1.4% in the previous ten years. Again, the CBO bucks this trend by forecasting average real GDP growth of 1.7% in the coming decade.
US Real GDP: Annualized Growth (%):
Source: Bloomberg, EPB Macro Research
Banerji and Achuthan write:
In essence, labor productivity growth and potential labor-force growth add up to potential GDP growth. Therefore, a closer look at these two measures is in order.”
The CBO pins potential labor force growth at 0.4% on average over the next ten years, a rather uncontroversial estimate given that demographics are more or less set in stone.
The CBO estimates that GDP growth will register 1.7% over the coming years but claims “potential growth” is about 1.8%, a blend of 1.4% productivity growth and 0.4% labor force growth. Unsurprisingly, the Federal Reserve has set 1.8% as its long-run growth projection as well.
1.4% productivity growth is a highly optimistic assumption, and a step function increase from the 0.8% average productivity growth over the last ten years.
Annualized Rate of Productivity Growth (%):
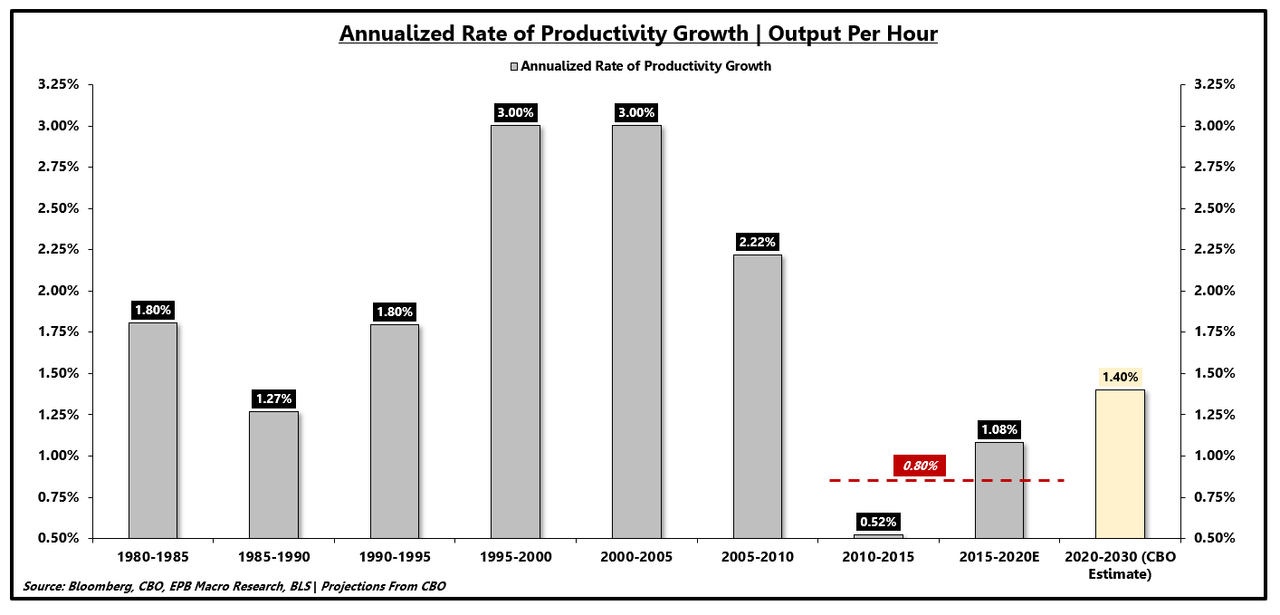
Source: Bloomberg, CBO, BLS, EPB Macro Research
Conventional wisdom suggests that productivity growth is mean-reverting, but the constant underperformance of growth relative to expectations challenges this view. Dr. Lacy Hunt proposes that productivity growth falters under the increased weight of debt, a thesis we’ve outlined many times and discussed in the most recent [Quarterly Webcast]. This view supports a decline in productivity over the next ten years as opposed to an increase, pegging growth at something below 1.2% on average (0.4% labor force growth + <0.8% productivity growth).
Banerji and Achuthan come at the problem from a slightly different angle but arrive at the same conclusion.
Annualized Rate of Productivity Growth (%):
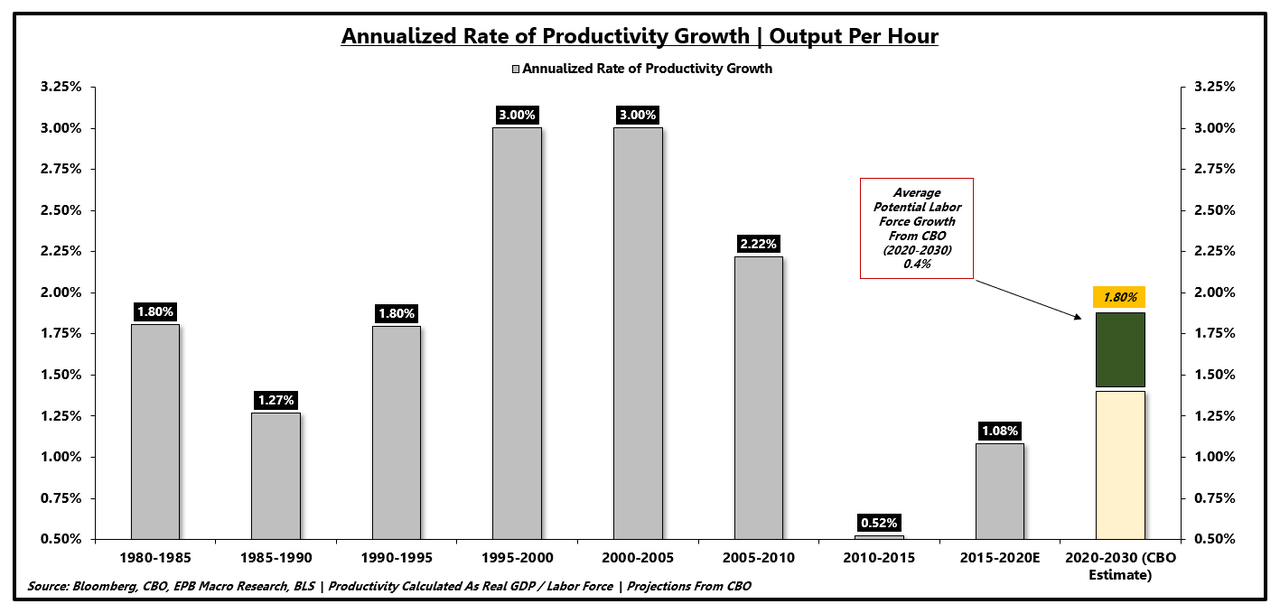
Source: Bloomberg, CBO, BLS, EPB Macro Research
Banerji and Achuthan preempt the common argument that productivity has been mismeasured due to technology. They rebut:
One major objection to the notion of an ongoing productivity slowdown is that “the official statistics understate the growth of…productivity”, mostly by underrecording the contribution of the digital economy. However, subsequent comprehensive research has found that, after making ‘several adjustments to IT-related hardware, software, and services [that] make recent growth in GDP and investment look modestly better than recorded…the slowdown in labor productivity is even larger.… The reason is that mismeasurement was substantial in the 1995–2004 period‘”
Moreover, as Syverson points out, ‘The productivity slowdown has occurred in dozens of countries, and its size is unrelated to measures of the countries’ consumption or production intensities of information and communication technologies.… Second, estimates…of the surplus created by…digital technologies fall far short of the $2.7 trillion or more of “missing output” resulting from the productivity growth slowdown.… Third, if measurement problems were to [blame,] the properly measured…productivity growth…would have to have been multiples of their measured growth in the data. Fourth, [regarding the concern that] workers are being paid to make products that are given away for free…this trend actually began before the productivity slowdown. So, while IT-related advances may have increased consumer welfare in recent years, they have not made people much more productive.‘”
Banerji and Achuthan go on to answer the question as to why productivity growth continues to falter and confound conventional wisdom.
To analyze productivity, Banerji and Achuthan break labor productivity into three categories:
growth in multifactor productivity (MFP), labor composition, and capital intensity.
For these periods, it is instructive to break out the contributions to labor productivity growth from growth in labor composition (the quality of labor); capital intensity (the ratio of capital to hours worked); and MFP, a measure of the combined influences of technological change, higher efficiency, returns to scale, reallocation of resources, and other factors affecting economic growth, over and above the individual effects of capital and labor.“
All three categories of productivity have faltered dramatically, but capital intensity has turned negative, detracting from total labor productivity.
To summarize one of the conclusions which is not dissimilar to the final analysis of Dr. Lacy Hunt:
Please recall that the ratio of capital to hours worked defines capital intensity. Evidently, economic growth during the current economic recovery has been skewed toward growth in the number of hours worked, while capital investment has taken a substantial hit. Thus, without a revival in capital investment, it appears improbable that there will be much of a recovery in labor productivity growth.“
On a national level, savings equals investment and woefully under adequate net national savings as a result of overindebtedness has led to a weakening rate of capital investment.
The chart below shows the 10-year annualized rate of real private domestic nonresidential investment. This includes investment in equipment, structures, as well as intellectual property.
Private Nonresidential Fixed Investment:
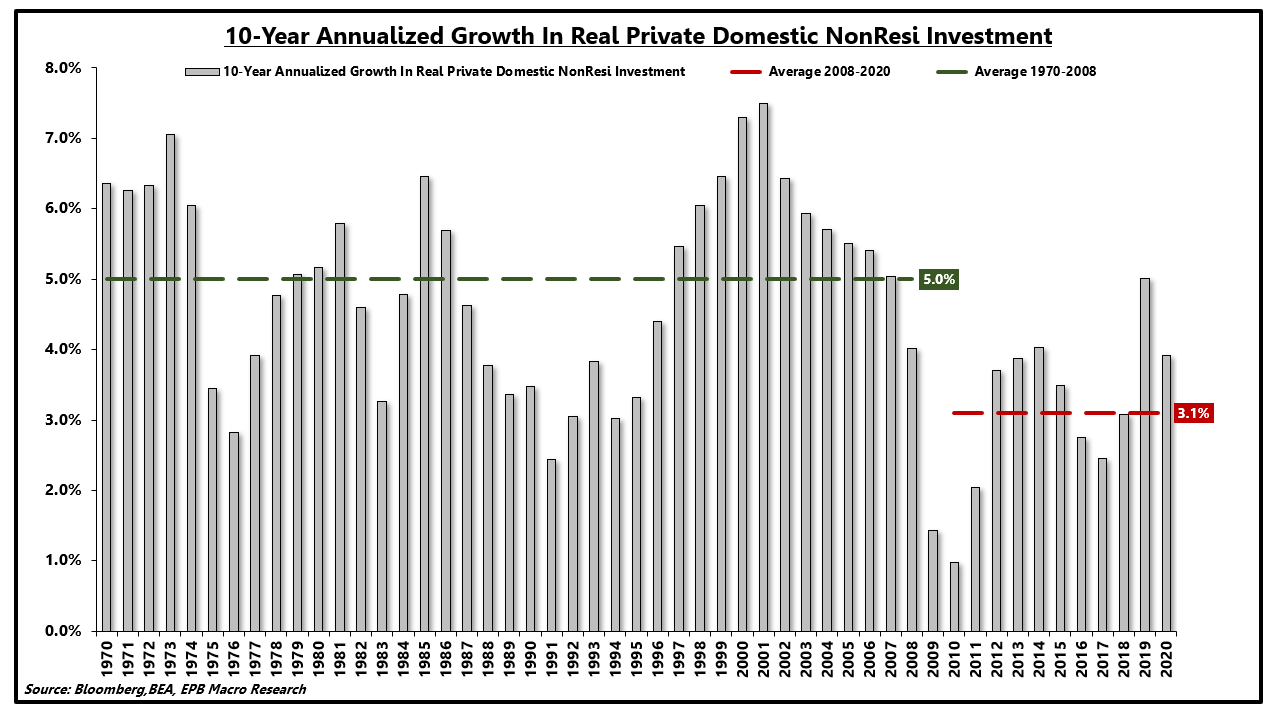
Source: Bloomberg, BEA, EPB Macro Research
Nonresidential fixed investment as a percentage of total GDP has been flat for many decades, likely to slide in the coming quarters as is typically after recessions.
Private Nonresidential Fixed Investment As A % of GDP:
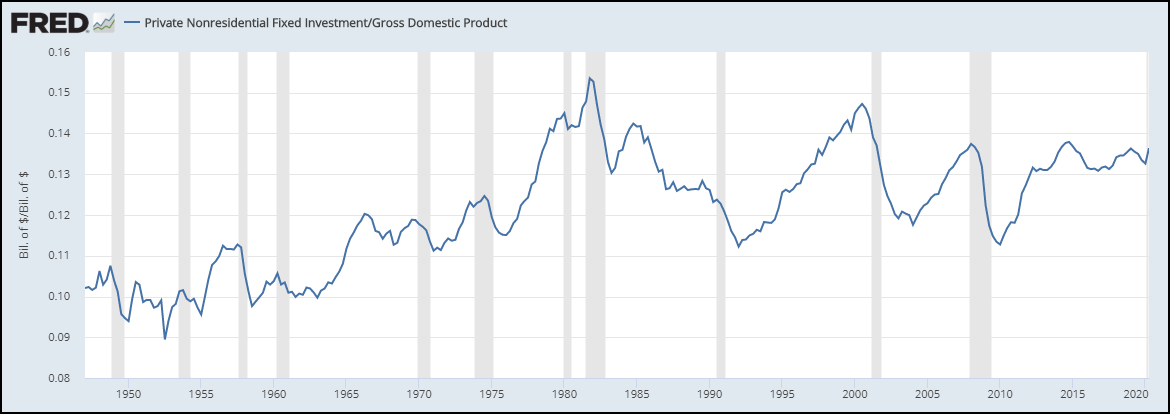
Source: FRED
However, intellectual property is a significant driver of the total category, weak as it is. If we remove intellectual property and plot private investment in structures and equipment as a percentage of GDP, we can see a massive decline in the contribution of total growth as investment in structures and equipment has been foregone due to weakening growth and other incentive structures.
If capital investment does not improve, all recoveries will come from a gain in hours worked, reducing the rate of capital intensity.
Should we expect capital investment to surge with trend economic growth that is tracking sub 1.5%? The answer is, “most likely not.”
Private Nonresidential Fixed Investment: Structures & Equipment As A % of GDP:
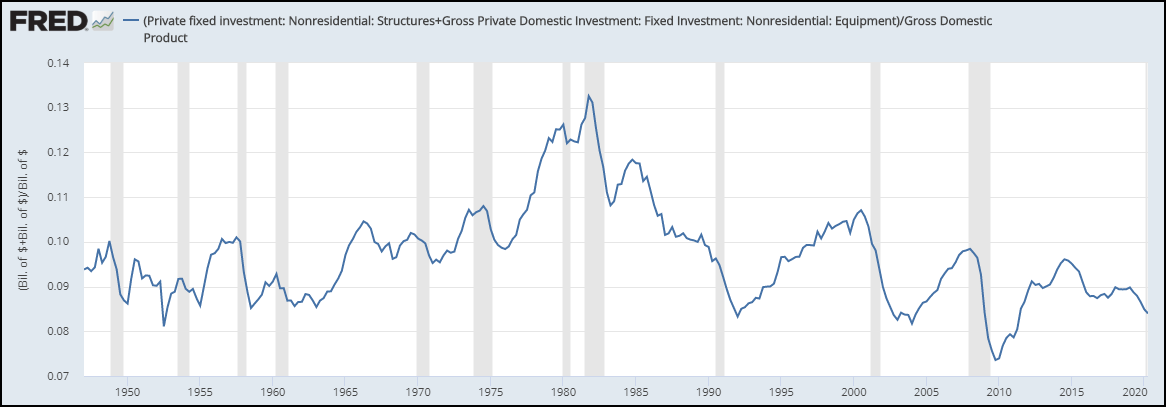
Source: FRED
Furthermore, investment must come from savings. As a nation, if we want to improve capital intensity by making investments, we must save in order to achieve that goal either through private, government, or foreign savings. The combination of these savings is net national savings, plotted below as a percentage of gross national income.
The plot of net national savings follows the contribution to GDP from investment in structures and equipment.
Net National Savings Rate | Private Nonresidential Fixed Investment: Structures & Equipment As A % of GDP:
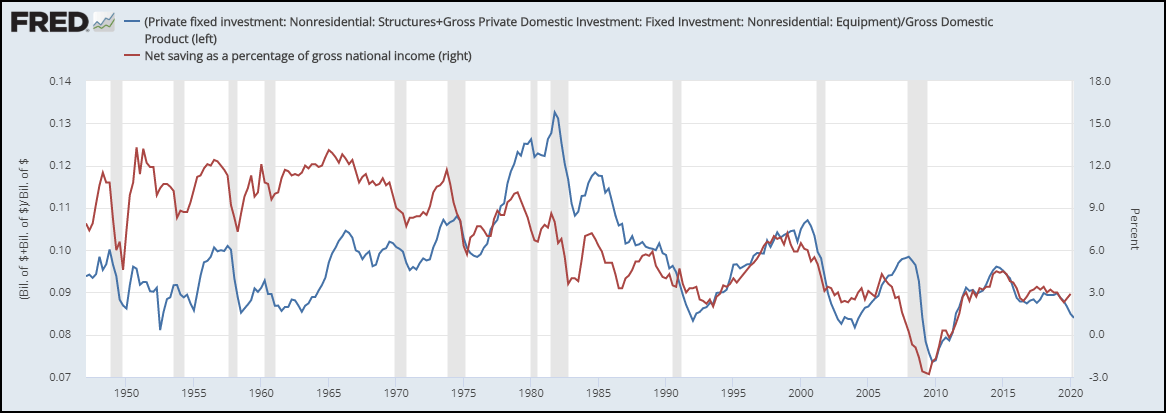
Source: FRED
To emerge from this ongoing economic slump, we have heard calls from two camps, one calling for massive World War II-like fiscal spending and one calling for more monetary support.
Banerji and Achuthan propose a litmus test. If fiscal spending is just about spending, a short-term boost will be felt, but long-term growth will not be altered as long as productivity growth is unchanged.
It is worth recalling, in this context, that World War II was about much more than rapid fiscal expansion. It was also an existential threat to nations on both sides of the conflict, creating an environment of urgent necessity that turned out to truly be the mother of invention. The innovations and breakthroughs that occurred due to the war resulted in a decades-long boost to productivity growth, as well as altered demographics in the form of the postwar baby boom.“
Through this lens, we can see that both vectors of the growth equation were positively impacted, labor force, and productivity.
In other words, World War II was such a game changer for long-term trend growth not only because of the amount of spending, but also because the state of emergency fostered innovation on the double, as no peacetime circumstances could have. Looking ahead, if fiscal stimulus is only about spending, regardless of its impact on productivity, it can at best borrow growth from the future, following which economic growth is likely to come back down to earth.“
To help answer the question as to whether spending will improve productivity, it is helpful to think about the concept of “revolutionary vs. evolutionary” technology. A significant fiscal spending package financed by debt in order to pave new roads may be needed. Still, the result will be a lower rate (even negative) of net national savings and a project that leaves long-run productivity unchanged.
To emerge on the other side of this COVID crisis, the US (and nearly all nations) accumulated record piles of debt in the government and corporate sector. The increased level of government dis-savings will push the rate of net national savings to record lows, further precluding productive investment in structures and equipment.
Net National Savings As A % Of Gross National Income:
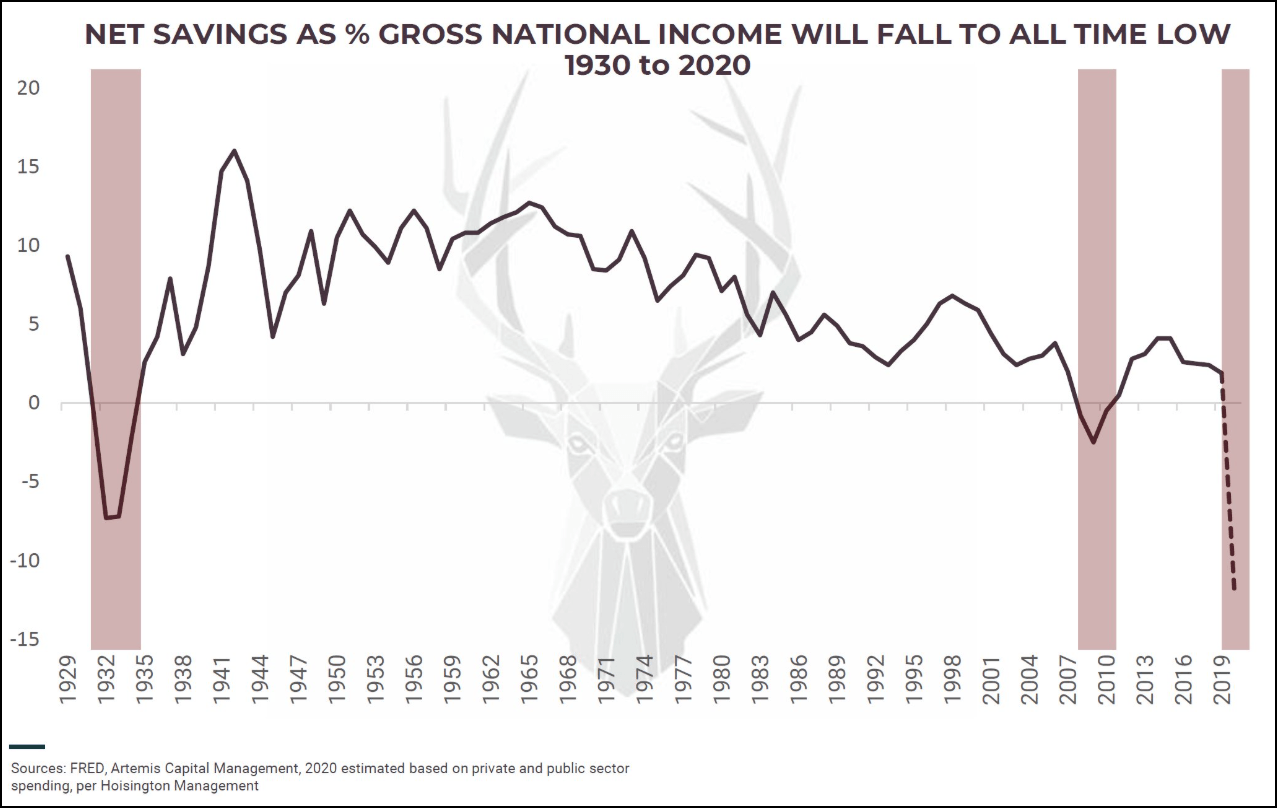
Source: Christopher Cole, Artemis Capital
Barring a major technological revolution (not evolution), we should assume productivity growth will move lower, not higher, in the decade to come. Productivity growth that weakens from an already depressed 0.8% level, coupled with 0.4% labor force growth, implies trend economic growth that will fall well below 1.5% and even below 1% in a bear case.
On a real basis, over the next ten years, your average economic investment will likely yield something well below 1.5%, even below 1%. Therefore, the risk-free rate should settle well below the average rate of return for your mid-level risk, particularly if the rate of inflation continues to move lower as the output gap from Part I suggests is probable.
Under these circumstances, nominal bond yields pushing close to the ZLB is not unreasonable and, in fact, likely.
Stocks may look attractive relative to these returns, generating a historical 8.5% return over the last 15 years, but a future research note decomposing how this occurred and why it is unlikely to repeat is undoubtedly in order.
It is difficult to alter the projected rate of labor force growth without a radical change to current immigration policies. Productivity growth, namely the subcategory of capital intensity, will continue to weaken as the nation (and globe) foregoes capital investment under a crushing debt load.
To improve long-run productivity, increasing net national savings from the government, private or foreign sector is a necessity and prerequisite to investment from savings. Currently pursuing the opposite path, assuming weakening rates of productivity growth should be the base case and thus, economic growth will continue its downward trend, pushing the risk-free rate of return lower and making a lift-off from the ZLB an even more significant challenge for the Fed than the period following the great financial crisis.
The deflationary output gap, positive FX-hedged Treasury rates, and another step-function lower in trend economic growth are three main factors that can push long-term Treasury rates near 0% in the coming years.
* * *
EPB Macro Research provides macroeconomic analysis on the most significant long-term and short-term economic trends, as well as the impact on various asset prices, including stocks, bonds, gold, and commodities. EPB Macro Research provides a low volatility monthly asset allocation model that translates the economic research into an actionable portfolio of ETFs. Click this link for a 14-Day FREE TRIAL
via ZeroHedge News https://ift.tt/33SRfR9 Tyler Durden