Correction Watch: Divergences Are Developing Between Large US Stocks & Everything Else
Tyler Durden
Fri, 08/28/2020 – 08:12
Authored by Bryce Coward via Knowledge Leaders Capital blog,
Last week we put out a succinct mid-quarter update in which we highlighted 9 negative inputs into a tactical equity framework. This post builds upon that by calling out 7 rather conspicuous divergences that are developing in the financial markets.

The VIX index is rising while stocks are rising. Typically, implied volatility (what is measured by the VIX) tracks realized volatility. Realized volatility almost always falls when stocks rise.
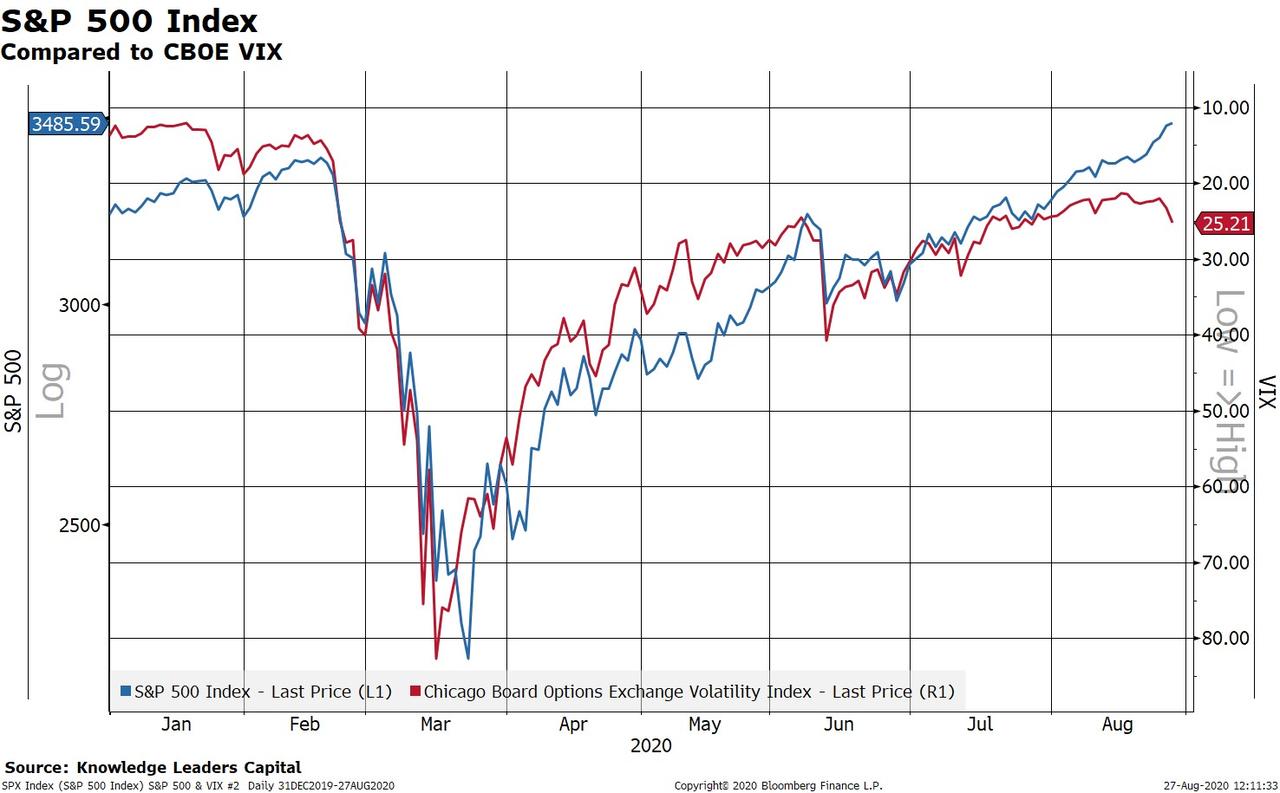
Since mid-August, however, what we are seeing is realized volatility fall while implied volatility rises. It’s an odd configuration that suggests options investors are pricing in higher probability of a selloff than equity investors. The current divergence between these two series is by far the largest it’s been all year.
The headline S&P 500 index keeps going up, but on fewer and fewer participating stocks. Typically, breadth in the equity market tracks the price level of the headline index.

But that hasn’t been the case since mid-August. Since then, the S&P 500 has tacked on almost 100 points while Bloomberg’s cumulative breadth measure has fallen by 2%. Almost all of the rise in the S&P 500 has been due to a few large companies driving the gains. That usually isn’t a sustainable setup so we need to see breadth catch up for the correction risk to recede.
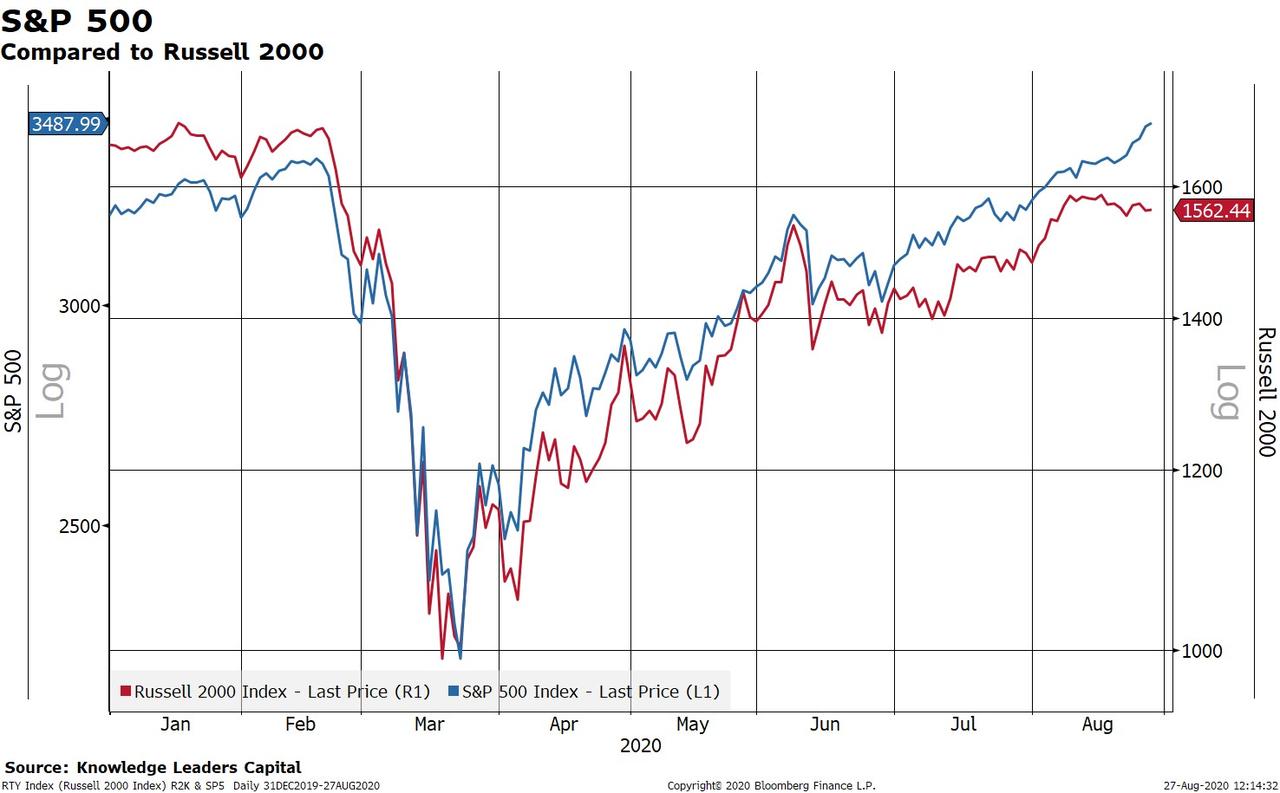
Small stocks are trending down while large stocks are at new highs. It’s not unusual for small stocks to outperform large stocks, but our antennae are piqued when small stocks are falling while the larger stocks are handily making new highs.
The US dollar has stopped falling against developed market crosses. The US dollar has moved in lock step with the S&P 500 since the March low. That is, the USD has fallen while stocks have risen.

A falling USD is a consequence of stimulus and reflation of the economy. But, since August 18th, the USD has stopped rising all together. This suggests there may be emerging tightness in the liquidity environment. Such a scenario would be disadvantageous for stocks if it persists.
Emerging market currencies are falling again. EM currencies are excellent indicators of the liquidity environment. When they fall, it suggests liquidity is tightening.
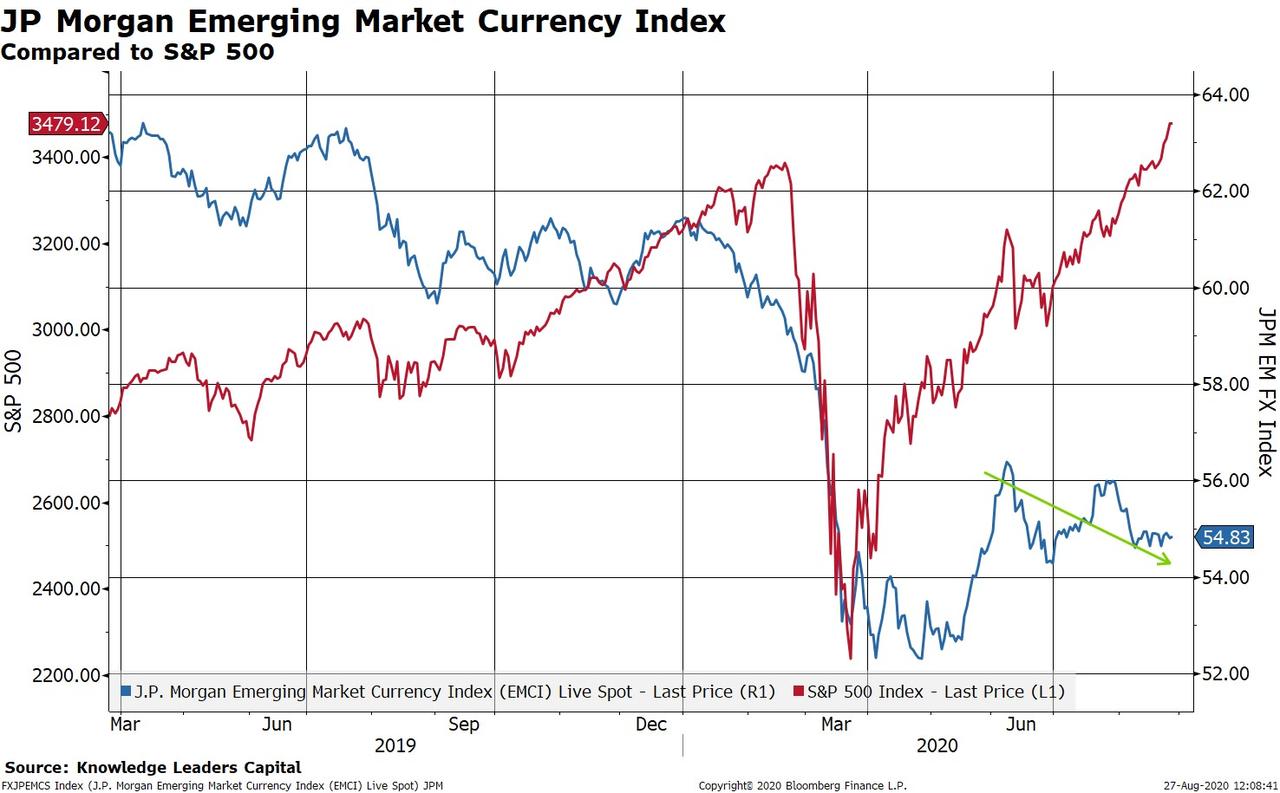
EM currencies have been falling since June and are contradicting the recent breakout of large US stocks.
High yield corporate credit spreads aren’t keeping up with stocks anymore. HY spreads have tracked stocks tightly all year. But, those spreads peaked out back in early August as the S&P 500 accelerated higher.
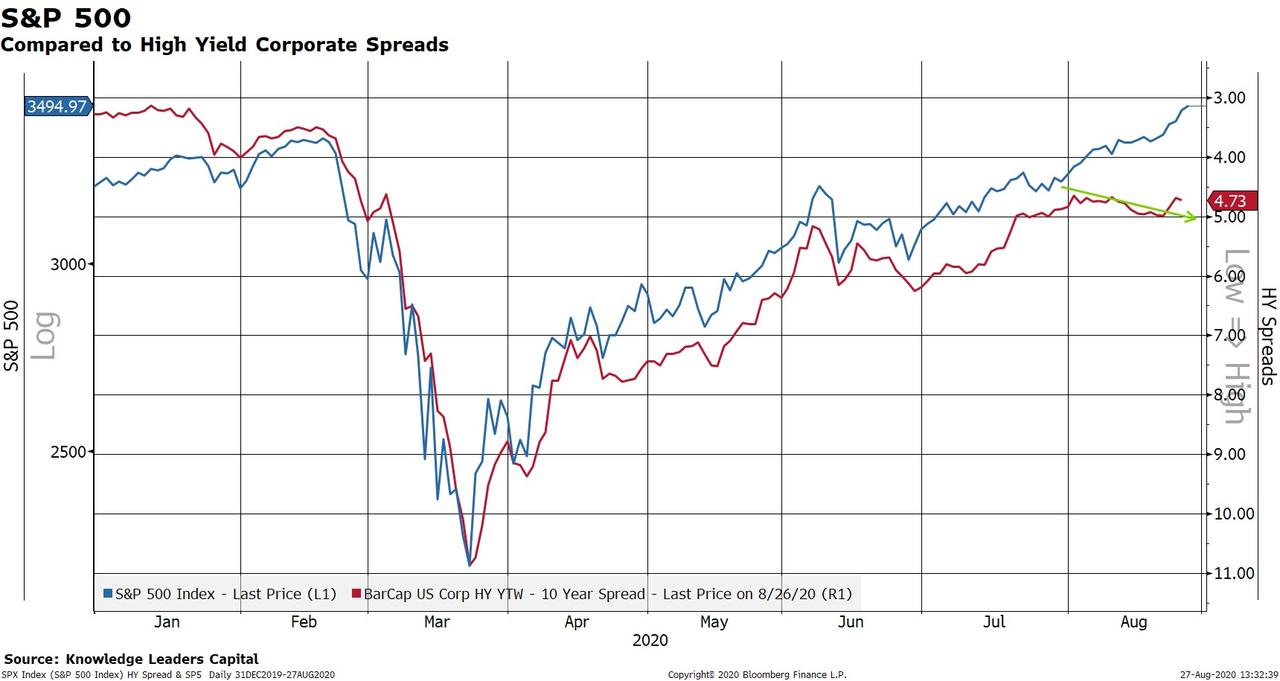
This suggests credit investors are pricing in less future improvement in the economy than are equity investors. We need to keep our eye on this indicator because the correction risk will get even stronger if HY spreads break back above 5%.
Consumer confidence is outright falling while US large stocks make new highs. Consumer confidence is highly correlated with equity prices for obvious reasons. But recently consumer confidence has taken a nosedive.
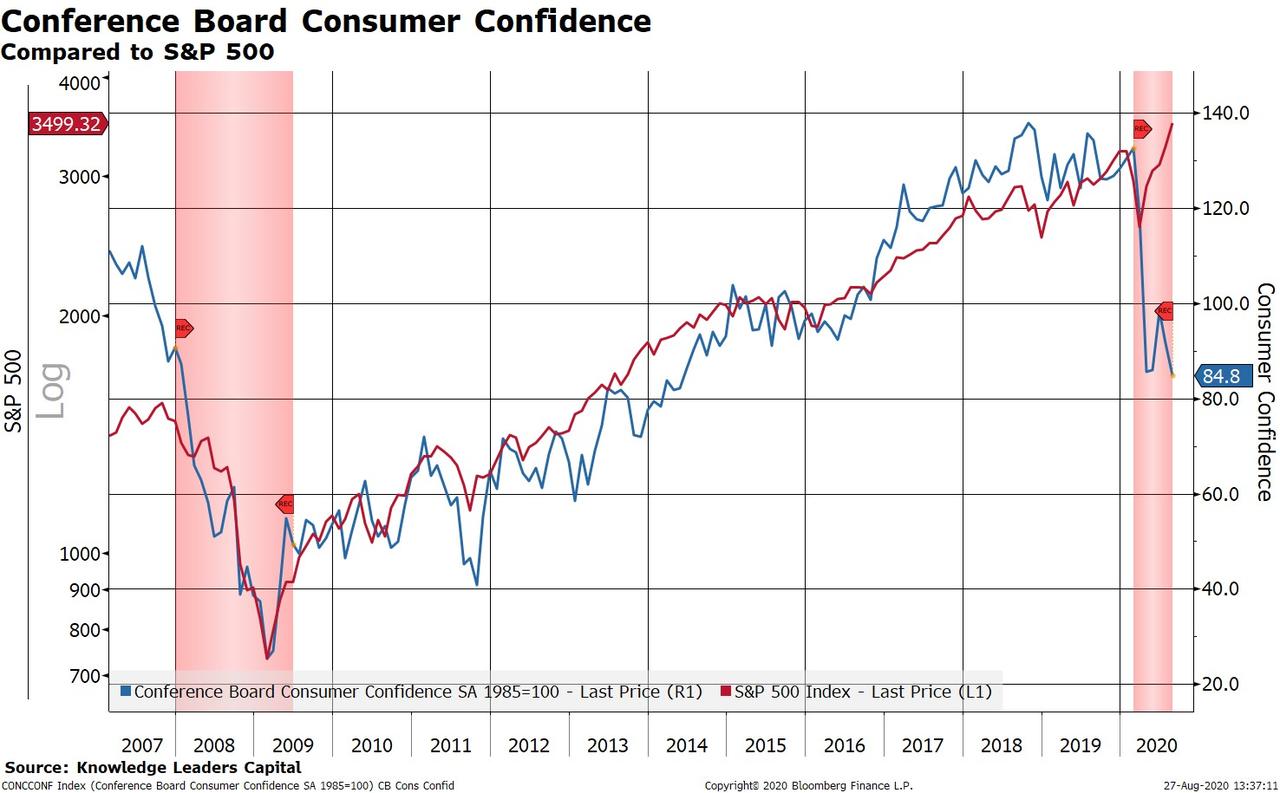
This is in part due to reduced unemployment benefit levels since the end of July combined with still high unemployment.
Bonus Chart
And then there is this. The option speculation index compares bullish and bearish options trades placed at the market open. Currently, option activity is skewed as heavily toward bullish strategies (buying calls or selling puts) as it was during the last days of the dotcom blowup.
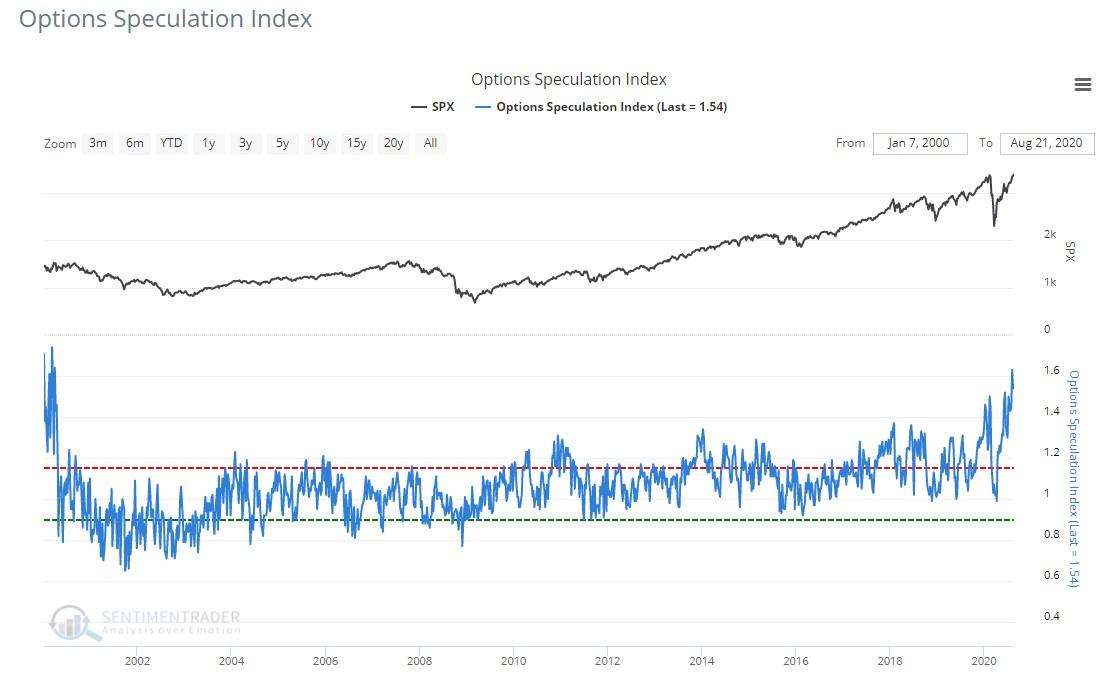
To be clear, a repeat of that scenario seems rather unlikely, perhaps just as unlikely as option speculation remaining at these levels.
via ZeroHedge News https://ift.tt/34HXdEv Tyler Durden