“Not There Yet” – The Correction Continues
Tyler Durden
Sun, 09/20/2020 – 11:20
Authored by Bryce Coward via Knowledge Leaders Capital blog,
We’ve been writing for the last month about the risks, and then the corrective activity in the stock market. Even as the market didn’t peak until the first few days of September, it “feels” like this pause has lasted longer than that. And yet, we don’t seem much closer to the end of this period than a few weeks back when it all began. What we mean is that while a few of the outrageous sentiment indicators such as options positioning have moderated a little, we have yet to see the kind of emotional flush/liquidation that is typically associated with good intermediate lows.
With that in mind, we highlight here a small number of things we’ll be looking for to help us assess if we are “there yet”.
1. Good intermediate-term lows come with spikes in volatility and hedging activity.
So far, volatility as measured by the VIX has actually gone down a bit during this selloff as a result of some unwinding of speculative call option activity that sent implied volatility through the roof in August.
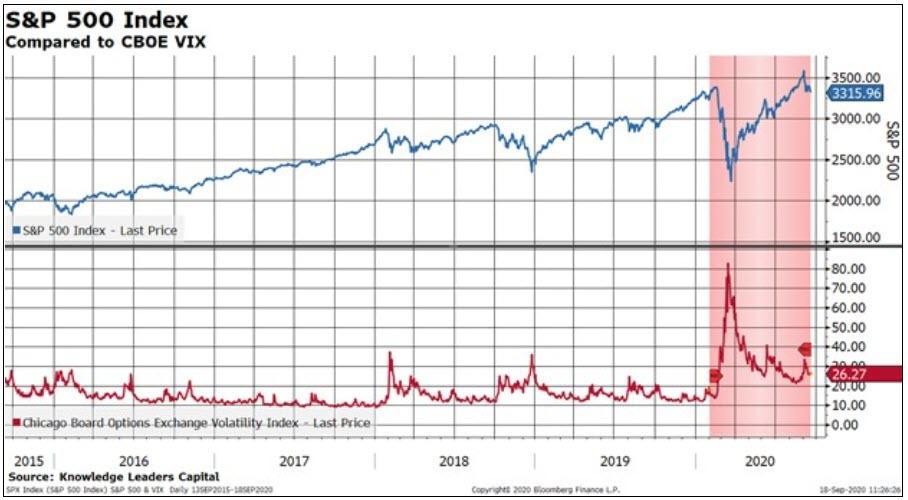
Odd as that scenario was, we still would expect a meaningful move back up in volatility as the selloff progresses and larger daily moves in stocks get priced in. Furthermore, good lows are almost universally accompanied by a pick up in downside hedging activity. We can measure said activity using the put/call ratio.

It’s still below 1 indicating more calls being bought than puts even as the S&P 500 was down as much as 1.6% on Friday.
2. Good intermediate-term lows come with high levels of individual stocks making new cycle lows.
One feature of selloffs is that they are a clearing mechanism that usually permeates the market very broadly. Said differently, lots of stocks get sold off to new cycle lows before the thing is over. Currently, the percent of stocks making new 4-week lows is pretty slim, reflective in the fact that the NASDAQ 100 is the epicenter of the recent downdraft.
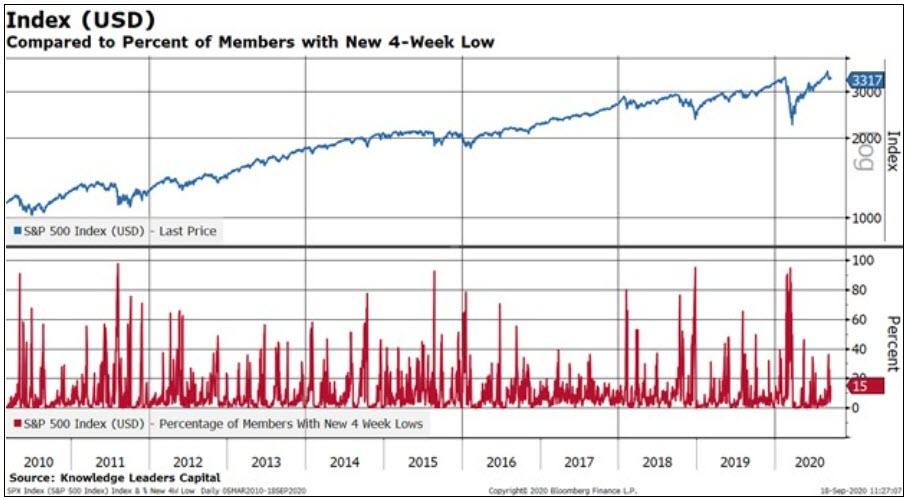
We’d expect the breadth of the selloff to expand as we get closer to an actionable low.
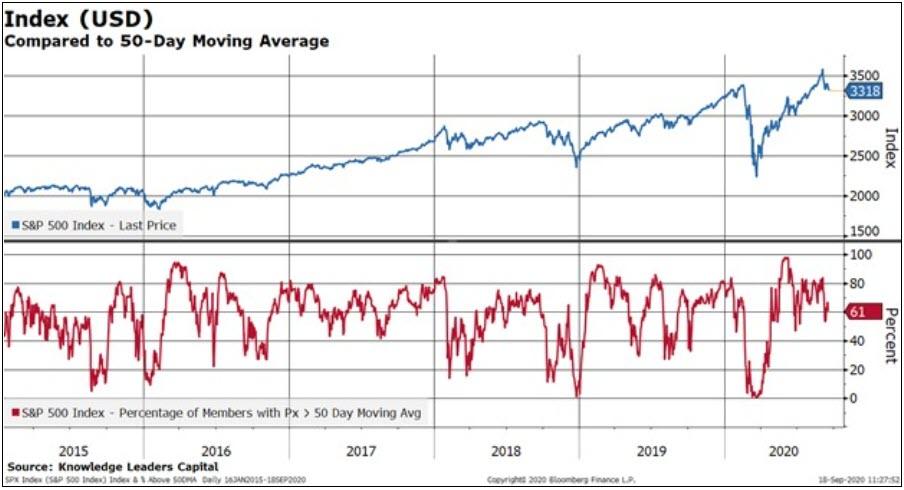
3. Good intermediate-term lows come when lots of stocks not only make new lows, but become oversold too.
The term “oversold” can be defined in a lot of ways, but one way to is to measure the breadth of stocks trading below various moving averages. In the case below, we measure the percent of stocks trading below their own 50-day moving average. Intermediate-term selloffs have typically seen this indicator in the 10-20% range as opposed the current reading of 61%.
4. Good intermediate-term lows come when flight to safety trades catch a bid.
There are many such trades, but two are long-term “risk free” bonds and the US dollar Japanese yen cross. Rates typically selloff aggressively and the yen usually firms nicely as risk-off positioning is increased. It’s possible the long-bond is depleted of signal these days as the pricing mechanism has been so aggressively distorted.
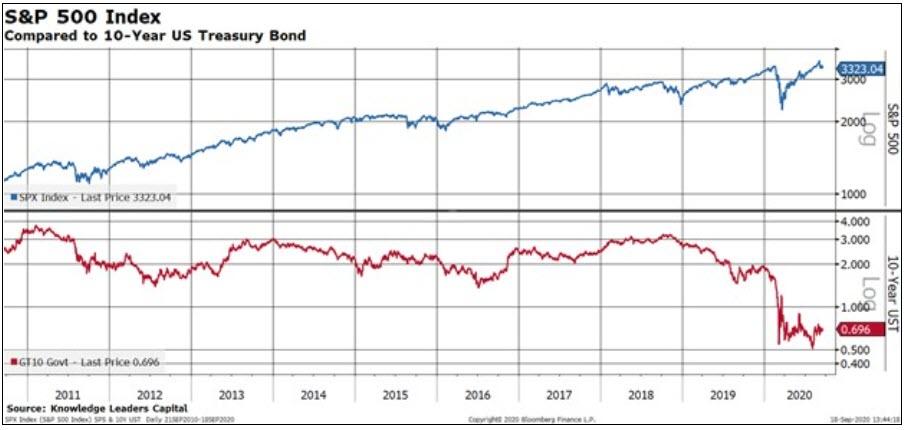
Even so, we’d still expect something out of bonds even if risk-free duration doesn’t quite have the spunk it used to. The signaling from the yen may not be as distorted, but even here the strength in the yen has been muted.
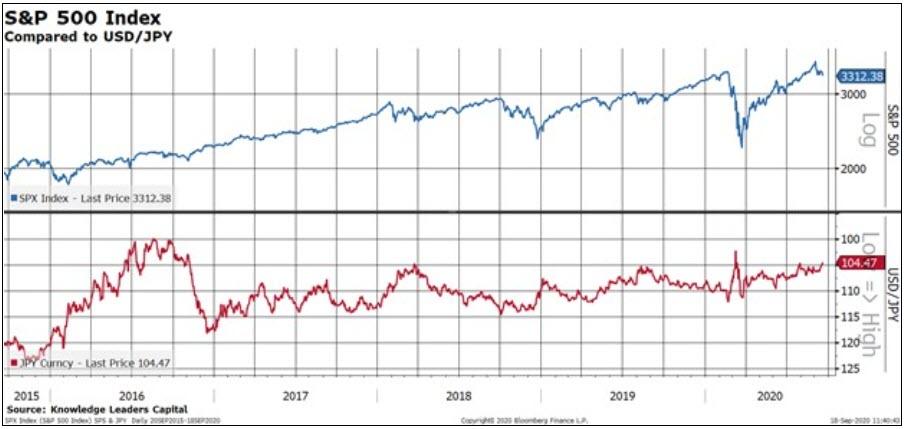
A more aggressive move in the yen toward 100 would be a good indicator of stress in the system, which is usually necessary for good intermediate lows to develop.
5. Good intermediate-term lows come with more accommodative policy.
This week we had the Fed basically tell the world that it won’t raise rates until 2023. That’s pretty accommodative, but it was also widely expected. What markets need/want is more from the fiscal side to fend off a second wave of layoffs and/or second-order effects of the high unemployment rate. Right now the probability of such action before the election seems to be diminishing by the day. Maybe the equity vigilantes will force the issue?
via ZeroHedge News https://ift.tt/3kyCDLz Tyler Durden