Budget Office Releases Terrifying Long-Term Debt Forecast
Tyler Durden
Tue, 09/22/2020 – 14:45
Back in January, when the CBO presented its latest long-term debt forecast, we – and Albert Edwards – said that this was nothing short of a “ticking timebomb“, one which convinced Albert Edwards shortly after that helicopter money was on its way. Just over a month later, this prediction came true when the Fed unleashed unlimited QE with the explicit intention of monetizing all near-term Treasury issuance in collaboration with the Treasury. The reason: the US economy was about to incur $3 trillion in debt to fund the biggest fiscal stimulus in US history, and much more to come after now that Magic Money Tree has been unleashed on the US with wide segments of the population now expecting Universal Basic Income for the foreseeable future.
Unfortunately, this also meant that the CBO’s already catastrophic long-term debt forecast had become woefully outdated, which is why we were looking forward to today’s latest Long-Term Budget Outlook report from the CBO.
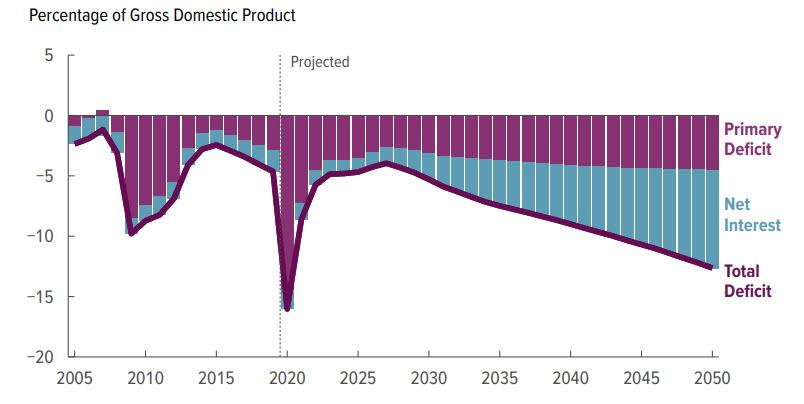
It did not disappoint: as the CBO openly admits, now that the US has fully embraced helicopter money, “deficits grow from an average of 4.8 percent of GDP from 2010 to 2019 to an average of 10.9 percent from 2041 to 2050, driving up debt. Net spending for interest rises rapidly and accounts for much of the growth in total deficits in the last two decades of the projection period.”
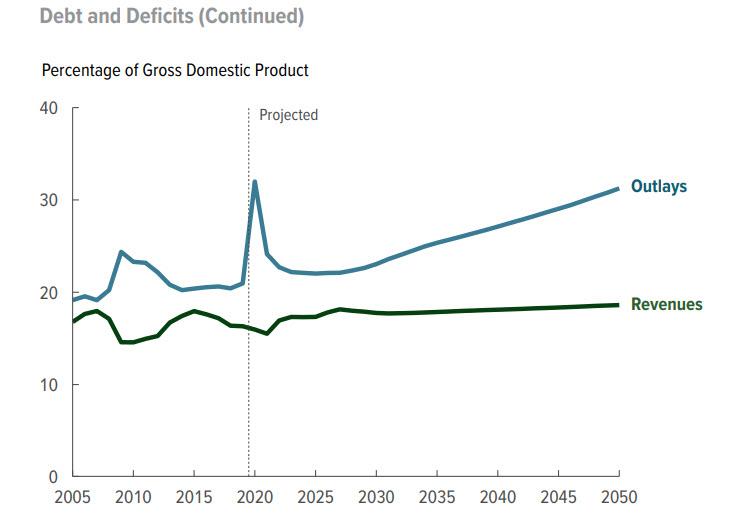
Another way of visualizing this: growth in outlays vastly outpaces growth in revenues, “resulting in larger budget deficits over the long run.”
The biggest source of government spending: interest on Federal debt, which surpasses mandatory spending in total terms around 2030, then surpasses both total Discretionary Spending and Social Security around 2040-2045, and then around 2050 becomes the second biggest US federal outlay only after healthcare programs. At that pace, however, it surpasses healthcare spending around 2055 at which point the US is officially a Minsky Moment republic, where the biggest outlay for the government is interest on the US mountain of debt.
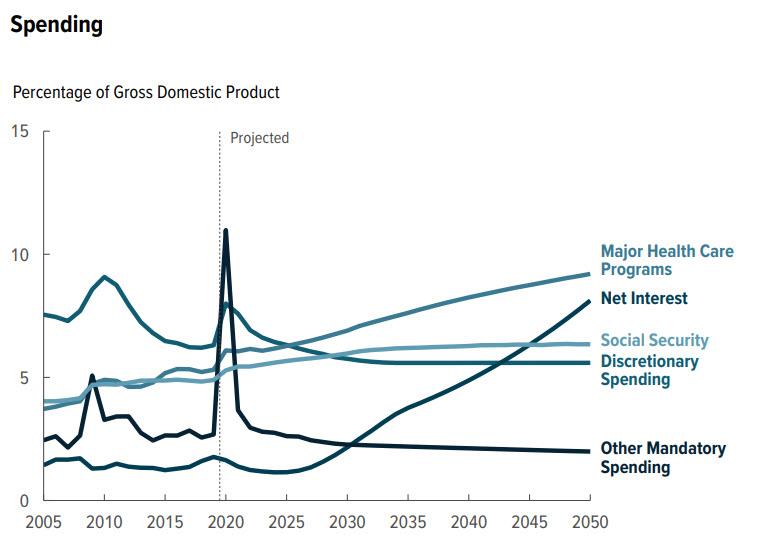
Of course, since the bond market won’t just sit there and wait for the US to become one giant interest expense ponzy scheme, expect interest rates to soar much faster than the CBO currently projects, which means the D-Day when interest spending become the primary government outlay will come much sooner.
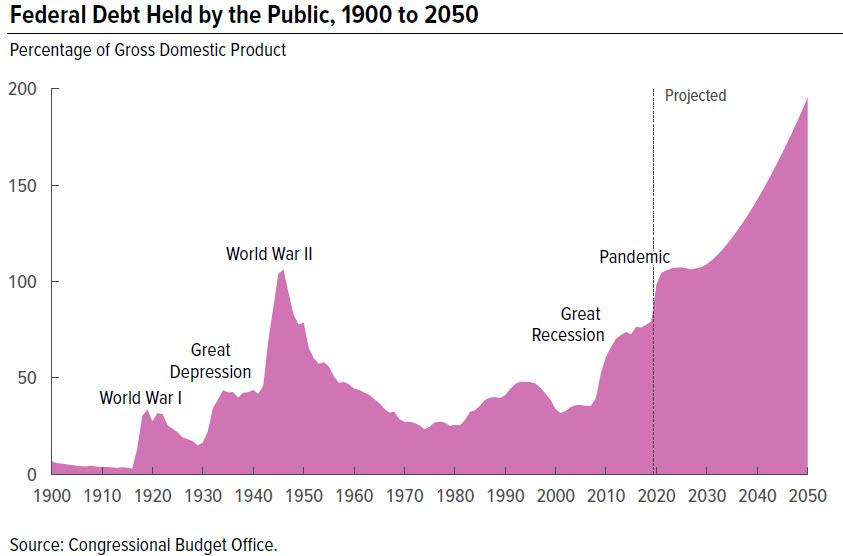
Which brings us to the punchline: the amount of debt itself as projected by the CBO. As the budget agency explains “federal debt held by the public surpasses its historical high of 106 percent of GDP in 2023 and continues to climb in most years thereafter. In 2050, debt as a percentage of GDP is nearly 2.5 times what it was at the end of last year.… Relative to the size of the economy, federal debt is higher in this year’s projections than it was in last year’s projections. The economic disruption caused by the 2020 coronavirus pandemic and the federal government’s response to it contribute significantly to that difference”
The CBO also provided the following color to explain why debt exploded even before the Covid pandemic.
Federal debt held by the public has increased significantly in recent years. At the end of 2007, federal debt was 35 percent of GDP. Deficits arising from the 2007–2009 recession and from policies implemented to counter the effects of the downturn caused debt to grow in relation to the economy over the next five years. By the end of 2012, debt as a share of GDP had doubled, reaching 70 percent, and it has climbed since then, reaching 79 percent by 2019.
Next the CBO gives a terse discussion on why debt is projected to continue to grow even more:
Debt as a percentage of GDP is projected to increase in most years as the government incurs budget deficits that are large relative to the growth of the economy. If current laws generally remained unchanged, federal budget deficits would be substantially larger over the next 30 years than they were over the past 50 years. In CBO’s projections, deficits rise after 2030 as mandatory spending—in particular, outlays for the major health care programs—and interest payments on federal debt grow faster than revenues. That growth in deficits causes projected debt to rise as a percentage of GDP over the 2030–2050 period.
Finally, here is the most terrifying chart in the latest CBO forecast – and of all CBO forecasts released yet – which as hinted in the title, is the one which projects US debt for the next 30 years, and shows that over the next three decades nothing short of hyperinflation, or war, can save the US.
via ZeroHedge News https://ift.tt/2RSQJek Tyler Durden