Visualizing The State Of Democracy, By Country
Tyler Durden
Tue, 09/22/2020 – 04:15
From Norway to North Korea, governing systems differ around the world. But, as Visual Capitalist’s Iman Ghosh asks (and answers below) has the world become more or less free in the past decade?
This visualization from Preethi Lodha demonstrates how democracy levels of 167 countries have changed since 2006. The original data comes from the Democracy Index, which is compiled annually by the Economist Intelligence Unit.

Click image for full-sized interactive version of this graphic
Four Levels of Democracy
First, it’s important to understand the classifications made by the Democracy Index.
Based on answers to 60 questions across a nation’s electoral process, civil liberties, government functions, political participation and political culture, countries are assigned a range of scores in the Democracy Index.
Based on these scores, a nation automatically falls into one of the following four types of governance. Here’s which category fits the bill, depending on the range of scores:
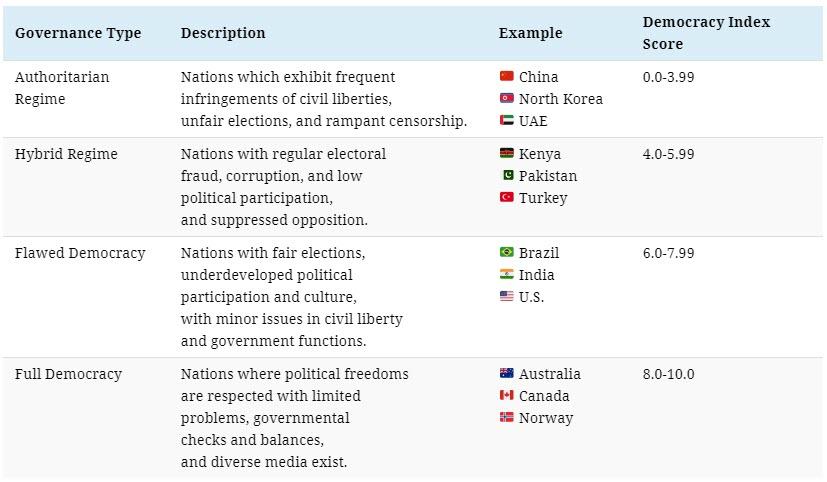
One thing that stands out is that many hybrid regimes and flawed democracies are also considered high potential emerging markets, but are held back by their political instability.
Notable Improvements
In recent times, public demonstrations have been a major cause behind increases in Democracy Index scores and changes in governance classifications.
Algeria moved from authoritarian to hybrid regime in 2019, the only country in the Arab region to do so in the index. This came after sustained protests against the previous president, Abdelaziz Bouteflika—who had served for 20 years.
Chile experienced similar turmoil, for the better. After a spike in the scale of middle class unrest over inequality and unfair policies in late 2019, the political participation moved it up from a flawed to full democracy.
Sliding Countries
The U.S. has one of the oldest democracies in the world. However, it was downgraded from a full to a flawed democracy as of the 2016 index, a status that had been “teetering” since before then, according to the report that year.
Venezuela dropped into an authoritarian regime in 2017, and it doesn’t seem to be improving anytime soon. The state was found to use the COVID-19 pandemic as an excuse to crack down on any dissent against the government.
Global Change in Democracy Levels
All in all, the average global democracy score worldwide emerged at 5.48 in 2019, although it’s clear that certain countries pull this value towards the opposite extremes.
North Korea, an authoritarian regime with a 1.08 score, has remained consistently one of the lowest ranked countries in the index. Meanwhile, its alphabetical successor Norway steadily keeps up its high score streak, with 9.87 being the best example of a full democracy in 2019.
Here’s how many countries made up each system of governance over the years, and the global Democracy Index score for that year.
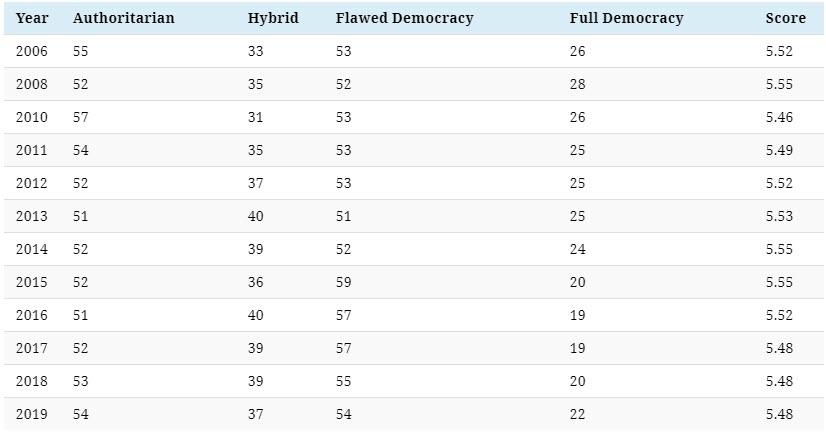
Authoritarian regimes peaked in 2010 with 57 countries, whereas the full democracy category peaked in 2008 with 28 countries.
Since 2006, the average global score has slid from 5.52 to 5.48, and the total of countries categorized under full democracy decreased from 26 to 22.
Does this signal an increasingly divided world? And will the global pandemic—which is already delaying elections—have a further pronounced effect on backsliding these democracy scores?
via ZeroHedge News https://ift.tt/36a6xCb Tyler Durden