Which Came First: Loans Or Deposits? An Unexpected Answer From JPMorgan’s Balance Sheet
Tyler Durden
Tue, 10/13/2020 – 13:10
There was a remarkable disclosure in the latest JPMorgan earnings report: the company reported that in Q3, its average deposits rose by a whopping 30% Y/Y, and up 5% from Q2, to just over $2 trillion, even as the average amount of loans issued by the bank were virtually unchanged Y/Y at $991 billion, and down 4% from Q2.
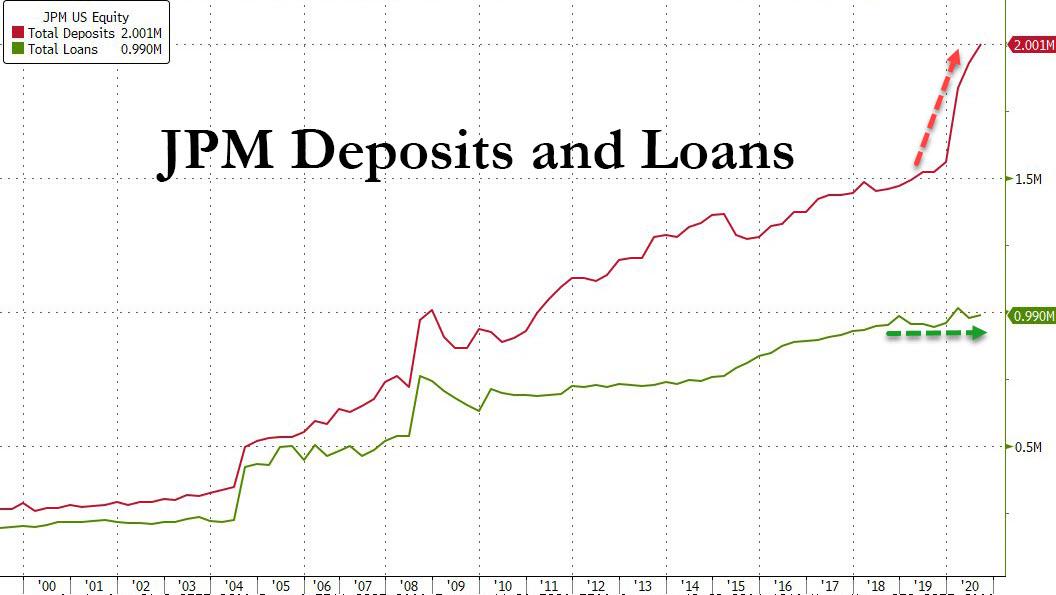
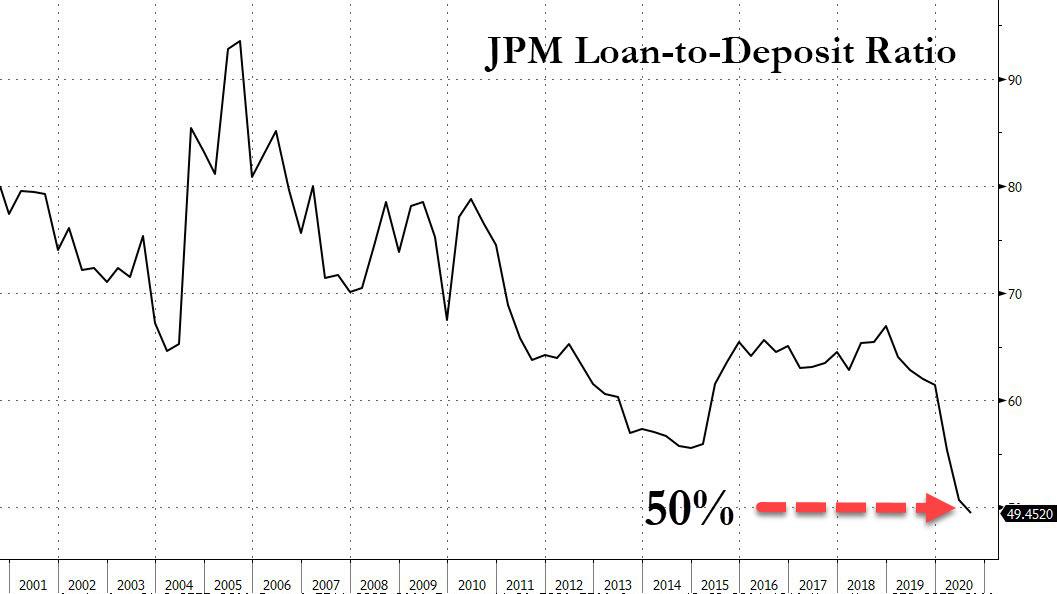
In other words, for the first time in its history, JPM had 100% more deposits than loans, or inversely, the ratio of loans to deposits dropped below 50% for the first time ever:
A similar, if not quite as acute pattern emerged at Citigroup, where deposits similarly hit a new all time high, even as the bank’s loans have been virtually unchanged for the past decade.
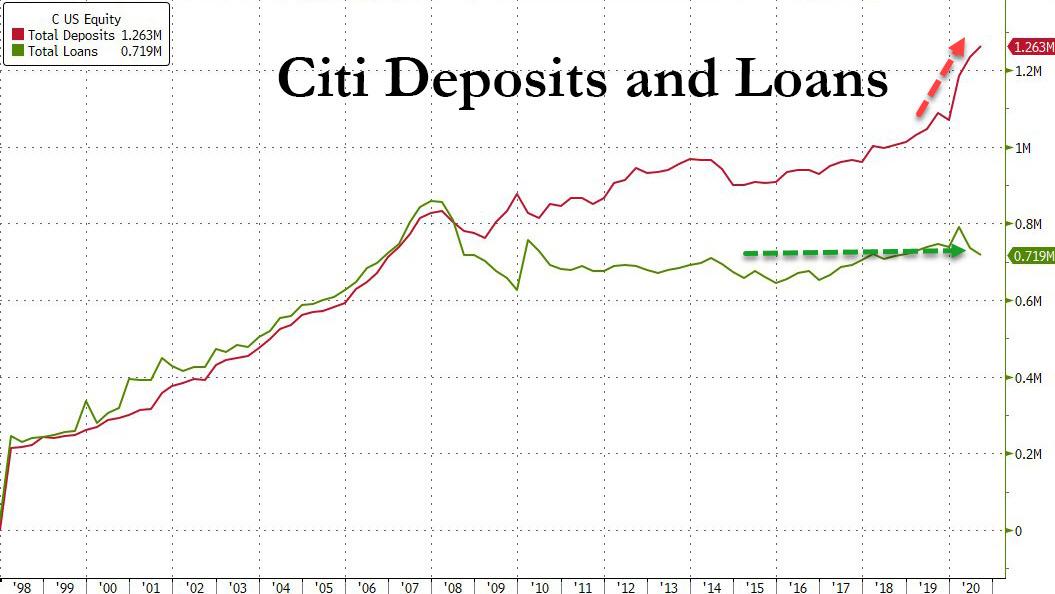
And while Citi has not quite caught up with JPM in having double the deposits compared to loans, what the chart above reveals even clearer is that the unprecedented divergence between deposits and loans started just as the Fed launched QE1 and has only grown since then.
There are two implications one should draw from the collapsing loan-to-deposit ratio. The first, more superficial one was flagged by Bloomberg today, in that this ratio is “a closely watched metric that measures how much lending a bank is doing when compared to its capacity to lend. For reference, [for JPM] the ratio was 64% this time last year.”
The second, and far more profound implication, the one that Bloomberg did not touch upon, is arguably the most fundamental question in modern fractional reserve banking: what comes first, loans or deposits, in other words do private, commercial banks create the money in circulation (by first lending it out) or is the central bank responsible for money creation.
While we will update this analysis when we get the deposit and loan data from the remaining money-center banks such as BofA and Wells later this week, the pattern is clear: there are now far more deposits than there are loans in the US banking system.
This is a problem because most conventional monetarists will argue that loans always come first, and only then do banks receive deposits. Well, clearly that’s no longer the case, and on its surface, the JPM data would suggest that the conventional process of deposit creation via loans is terminally broken.
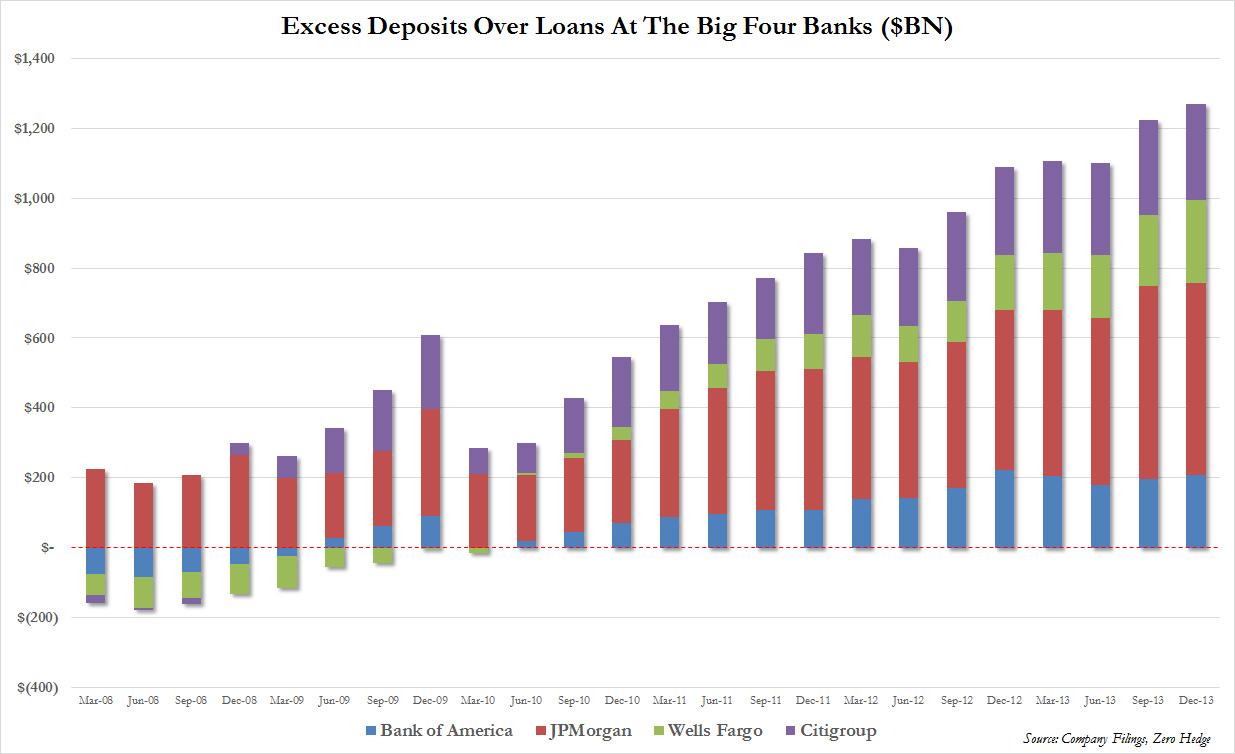
Indeed, that’s precisely the case with the missing link being – drumroll – the Fed, as we explained all the way back, in 2014. Here is the punchline of what we said then, when we did a similar analysis observing what was already a record amount of excess deposits over loans:
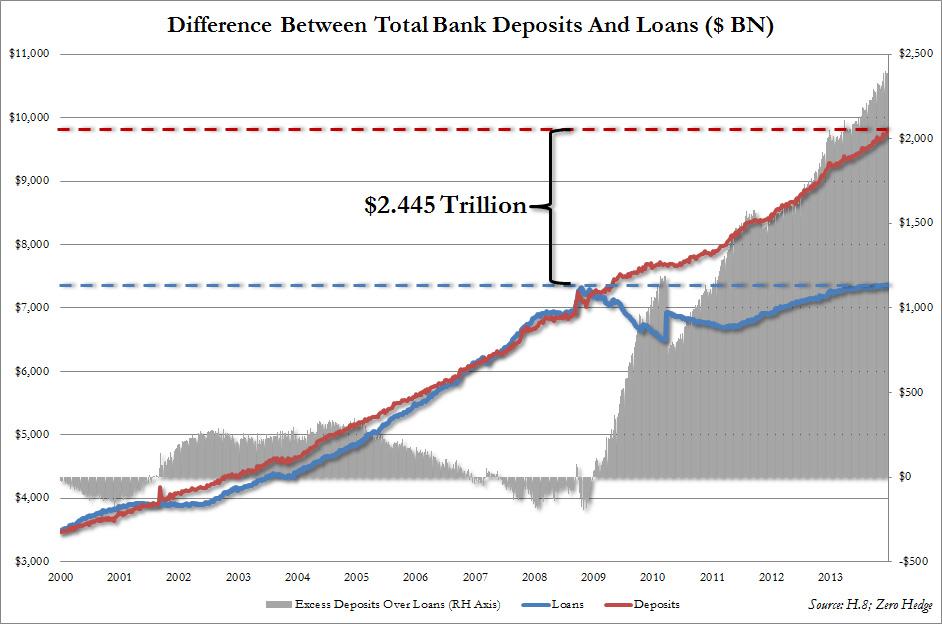
… how does the record mismatch between deposits and loans look like? Well, for the Big 4 US banks, JPM, Wells, BofA and Citi it looks as follows.
What the above chart simply shows is the breakdown in the Excess Deposit over Loan series, which is shown in the chart below, which tracks the historical change in commercial bank loans and deposits. What is immediately obvious is that while loans and deposits moved hand in hand for most of history, starting with the collapse of Lehman loan creation has been virtually non-existent (total loans are now at levels seen at the time of Lehman’s collapse) while deposits have risen to just about $10 trillion. It is here that the Fed’s excess reserves have gone – the delta between the two is almost precisely the total amount of reserves injected by the Fed since the Lehman crisis.
So what does all of this mean? In a nutshell, with the Fed now tapering QE and deposit formation slowing, banks will have no choice but to issue loans to offset the lack of outside money injection by the Fed. In other words, while bank “deposits” have already experienced the benefit of “future inflation”, and have manifested it in the stock market, it is now the turn of the matching asset to catch up. Which also means that while “deposit” growth (i.e., parked reserves) in the future will slow to a trickle, banks will have no choice but to flood the country with $2.5 trillion in loans, or a third of the currently outstanding loans, just to catch up to the head start provided by the Fed!
It is this loan creation that will jump start inside money and the flow through to the economy, resulting in the long-overdue growth. It is also this loan creation that means banks will no longer speculate as prop traders with the excess liquidity but go back to their roots as lenders. Most importantly, once banks launch this wholesale lending effort, it is then and only then that the true pernicious inflation from what the Fed has done in the past 5 years will finally rear its ugly head.
The above also explains why even as the Fed has pumped trillions in reserves into banks, which by transformation have ended up as deposits on bank balance sheets, the velocity of M2 money has plunged to an all time low (and will soon drop below 1.0x), as loan demand is nowhere near enough to offset the Fed’s forced deposit creation which incidentally ends up not in the economy but in capital markets, resulting in broad – ad wage – deflation and asset price hyperinflation.

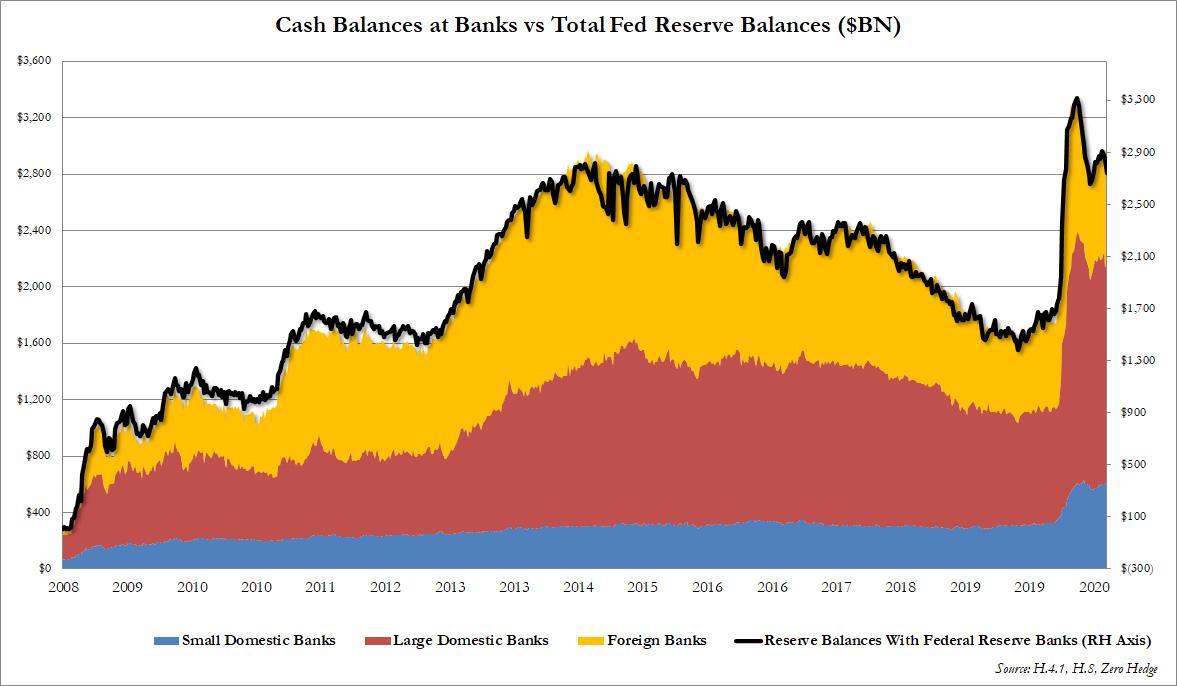
And, as regular readers know too well, it also means that the excess reserves injected by the Fed end up as cash across the US financial system, including both domestic and international commercial banks.
We will update this analysis tomorrow once we have the full bank data, however the take home message for now is that the next time someone says that under fractional reserve banking deposits are always a consequence of loan creation – one of the core pillar of such idiotic theories as MMT – just show them the chart above.
via ZeroHedge News https://ift.tt/3iVOSAK Tyler Durden