The VIX Is Getting Close To A Critical Level
Tyler Durden
Fri, 10/30/2020 – 12:05
Submitted by Nick Colas of DataTrek Research
Three thoughts on today’s US and global equity market selloff and recent volatility more generally:
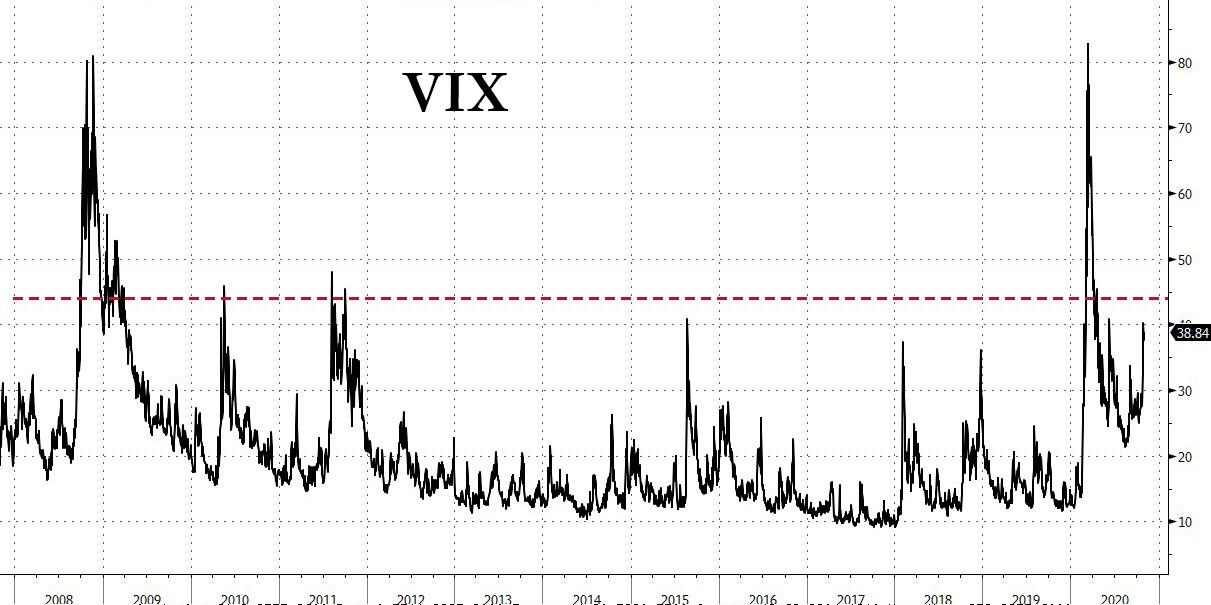
#1: Let’s start with where the CBOE VIX Index is trading and what this “Fear Gauge/Price of Portfolio Hedging” measure says about near term market sentiment:
-
Today is only the 203rd time that the CBOE VIX Index has closed over 40 (at 40.3) since January 1990, when the modern version of the index launched. That is just 2.6 percent of all trading days from that starting point.
-
Based on daily closes back to 1990, a 44-handle VIX is the statistically significant level that indicates genuinely high market uncertainty. The average VIX close over the last 30 years is 19.44 and the standard deviation is 8.12, so three standard deviations away from the mean is therefore 43.8, which we round to 44.
-
Going back to 1990, there have been 124 VIX closes above 43.8, or 1.6% of the distribution. That means the VIX is more fat-tailed than a normal curve, an observation well-known to anyone who has read Taleb’s Black Swan book.
Now, let’s make the entirely fair assumption that we’re not done with US equity market volatility and the VIX does get to 44, that 3-sigma line in the sand. What then?
-
History says a +44 VIX means you have a decision to make, because 94 percent of the observations back to 1990 when the VIX closed over that level occurred in just 2 timeframes: 2008/2009 and 2020.
-
If you believe the current setup looks like 2008/2009, you should consider reducing risk. The first VIX close over 44 in that period was September 30th, 2008, with the S&P at 1166. It would not recover that level for 18 months.
-
If you think we’re replaying March – April 2020, then it is fine to add risk even as the VIX tops 44. The first close over that level was on March 6th, 2020 with the S&P at 2,972. By May 1st, we were higher.
-
There is a bit of grey area with a VIX between 44 – 46, because of the 26 days back to 1990 with closes in this range there are a variety of oddball outliers dated 1998, 2002, 2011 which make up 27 percent of the observations.
The bottom line here is simple: the VIX is getting close to an important level.
#2: The most substantive argument that 2008 – 2009 is the more accurate comparison just now centers on:
A potential fiscal policy black hole in Washington due to a change in political control during a Presidential election year. Congress and the White House spent a lot of time in Q4 2008 buttressing the US financial system with TARP, but fiscal stimulus only came in February 2009 with a new President and Congress. That delay made the Great Recession immeasurably worse.
We potentially have the same setup now, with a US election next week.
A lack of clarity about how badly the “real economy” is doing. It’s easy to point fingers at 2008 (as we just did) but we should also recall that in Q4 2008 US unemployment rates and initial claims for unemployment insurance were still at levels more commensurate with merely a garden variety recession. Peak claims only occurred in March 2009 and peak unemployment would not arrive until October 2009; both were 30-50 percent worse than Q4 2008.
This time around we have a very fluid situation around the US labor market, with tremendous volatility around key data points here and even less information about what Q4 economic growth might be given the potential need for regional lockdowns.
#3: Now, let’s look at the bullish side of the coin:
As much as people say Wall Street and Main Street are disconnected, we would argue that nothing focuses Washington as much as a bunch of sequential down 3 – 5 percent days on the S&P 500. No one, whether they win or lose an election, wants a repeat of the Great Depression when DC policymakers shrugged off the 1929 Crash and believed “prosperity is just around the corner”.
Also, current corporate profitability is still decent, although it is hard to know exactly what it would be without the fiscal stimulus from earlier in the year.
Finally, even if a vaccine is slow to roll out, we have less than a year before economic life starts to look more normal. Markets discount corporate earnings 6-12 months out, well within this timeframe.
The thing we want you to take away from this brief scenario analysis is that the VIX is clearly signaling enough uncertainty that we should prepare for further volatility. We don’t get to a 40-handle VIX by accident. You know our stance: more fiscal stimulus will come, corporate profits will continue to improve, political uncertainty will wane, and 2021 will see further economic improvement. But we respect what the market is saying: be careful of what you assume.
via ZeroHedge News https://ift.tt/3jOUk9a Tyler Durden