Market Drops As Traders Head For The Pre-Election Exit
Tyler Durden
Sun, 11/01/2020 – 11:35
Authored by Lance Roberts via RealInvestmentAdvice.com,
Market Breaks Support
We have discussed how the markets drifted from one stimulus headline to the next for the past several weeks. Stimulus. No Stimulus. As noted, the daily swings made it a challenging environment to navigate.
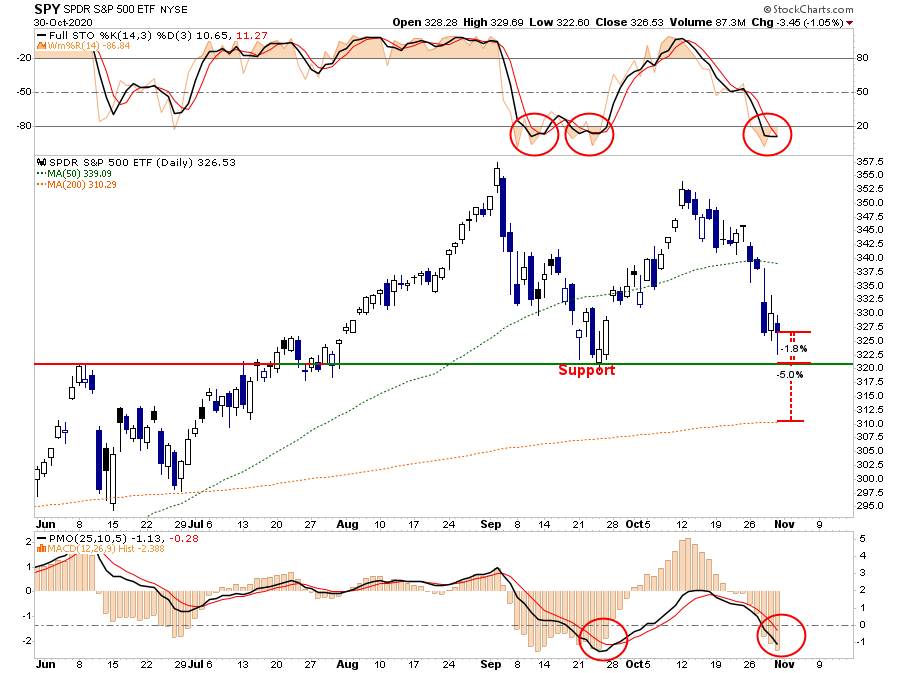
This past Thursday, in our daily “3-Minutes” video, we discussed the recent break of support, our indicators, and why there was no “safe place” to hide. The sell-off aligns with seasonal weakness but also the realization that “no stimulus” is coming.
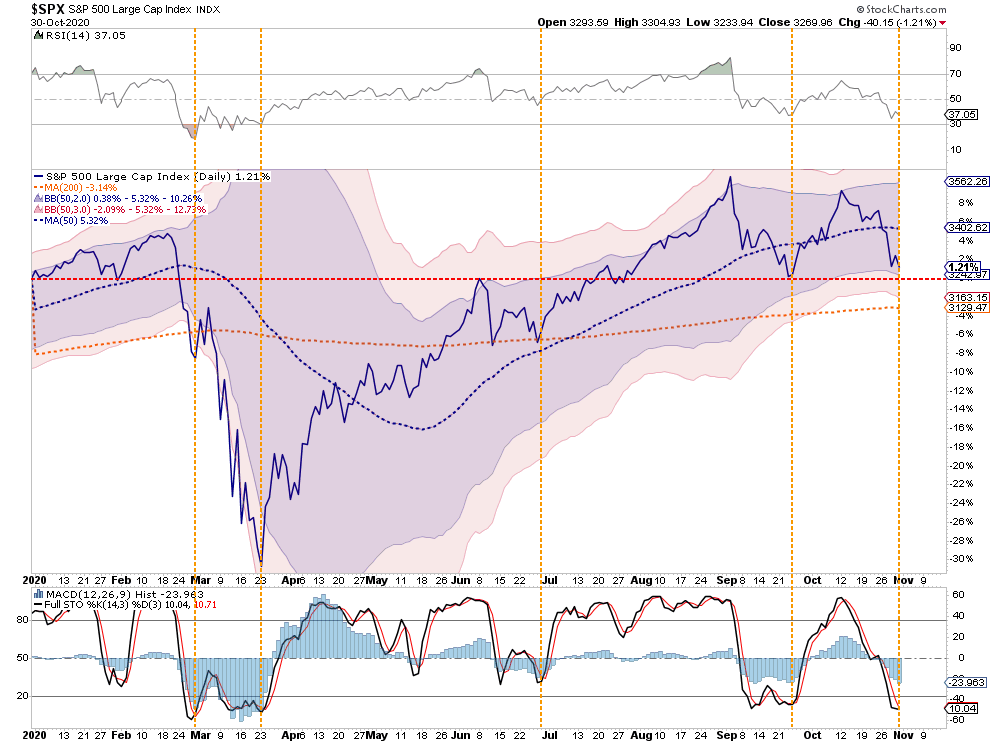
As noted in the video, all of our “sell signals” have been intact for the last few weeks suggesting more downside risk near term. Those signals have now reversed to the point where we are likely to see a decent reflex rally starting as early as Monday. As noted in the year-to-date performance chart below, the market is 2-standard deviations below its 50-dma and is close to the September low support. Performance is positive year-to-date at 1.21%, which still argues for a re-election of the incumbent President.
Sold Out
Given the amount of selling over the last few weeks, it is not surprising to see most of our short-term technical indicators back at lows. Again, as noted above, such suggests that a reflexive rally is possible in the next few days.
Such a rally will provide an opportunity to rebalance portfolio risks accordingly. As we will discuss momentarily, the markets will begin to process the election’s impact on various sectors and the market itself.
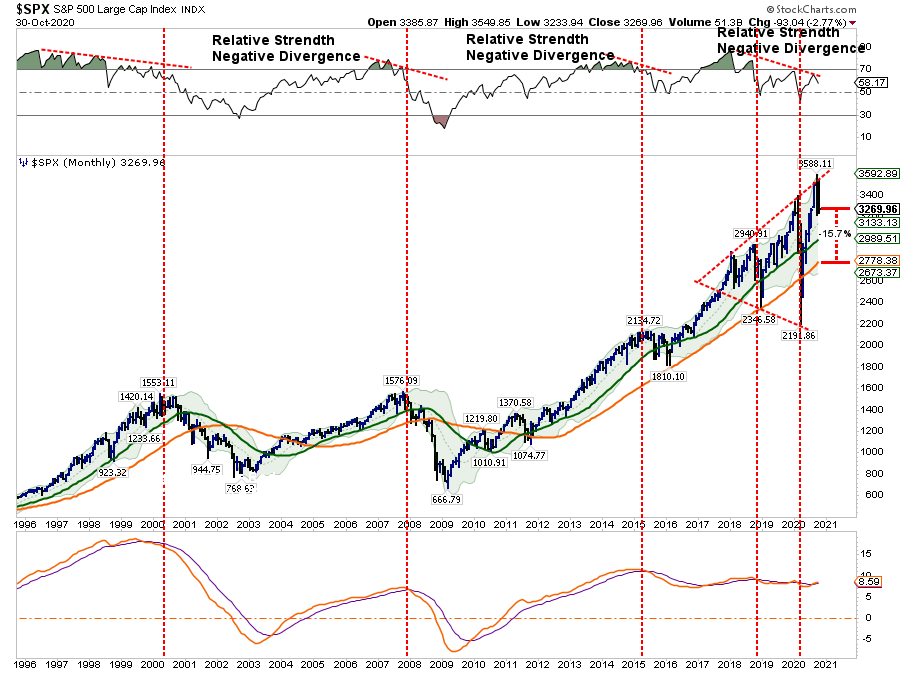
However, the economy’s disconnect remains longer-term, which can not last as earnings come from economic activity. While the very short-term trading environment is conducive for a rally, the longer-term “investing” environment is still problematic with weakening relative strength, participation, and fundamental issues.
Depending on your investment time horizon, it is crucial to weigh both charts analysis concerning your current allocation, duration, and ability to withstand volatility.
Just as we stated back at the September lows, “this, too, is a sellable rally.”
Still Trading With Election Year Stats
Last week, I sat down with Richard Rosso, CFP, and Danny Ratliff, CFP, to discuss both candidates’ policies. The video below covers the impact of rising debts and deficits, long-term economic growth, and how markets have historically responded to an election.
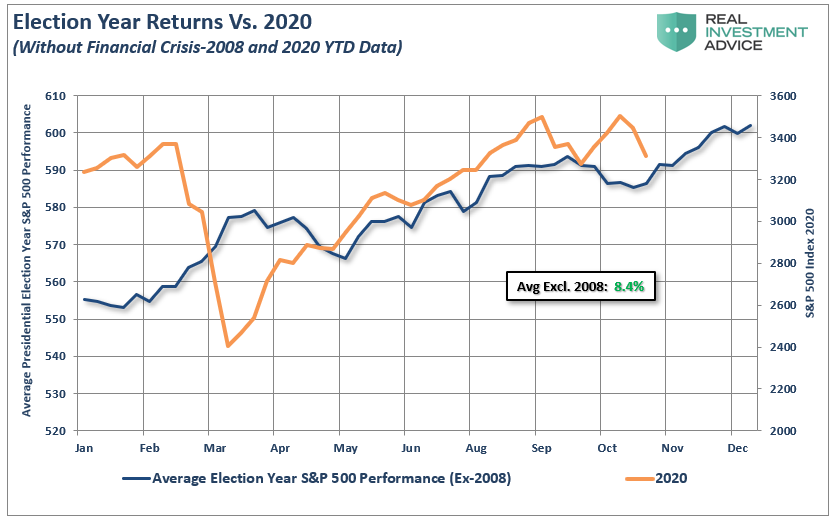
Currently, the markets continue to trade in line with election year statistics. While the markets have certainly been under pressure over the last few weeks, the decline has remained orderly for the most part. As noted previously:
“Will policies matter? The short answer is, “Yes.” However, not in the short-term. Presidential platforms are primarily ‘advertising’ to get your vote. As such, a politician will promise many things that, in hindsight, rarely get accomplished.
Therefore, while there currently much debate about whose policies will be better for the stock market, historically and statistically speaking, it doesn’t matter much. A look back at all election years since 1960 shows an average increase in the market of nearly 8.4% annually (excluding the 2008 ‘financial crisis and current 2020 performance.” – Selloff Overdone
Please understand me. There is indeed downside risk to the market currently with plenty of catalysts at hand. However, given the markets have worked off a large amount of the previous overbought condition, it reduced the “risk” of a substantial market decline.
We will discuss how we are managing the market currently in a moment. But first, I wanted to touch on the GDP report.
A Word About That Boomer GDP Report
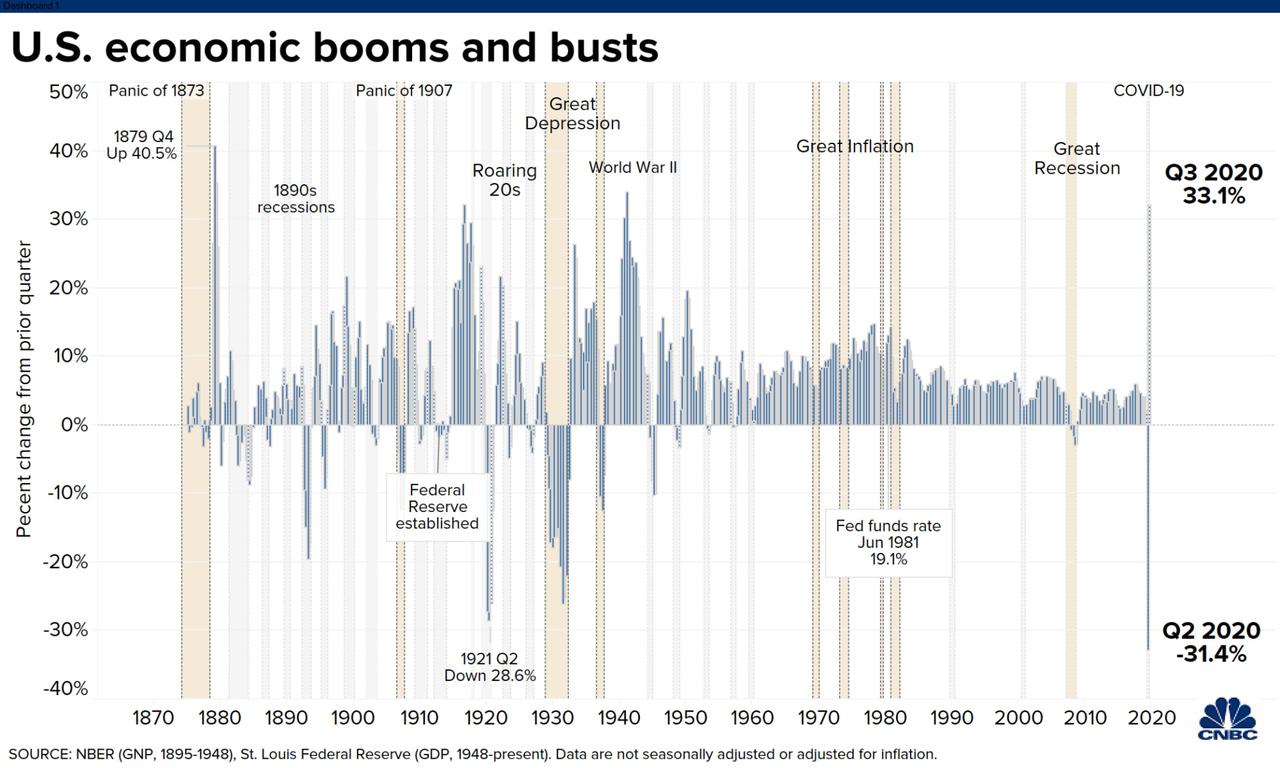
On Thursday, the Bureau Of Economic Analysis delivered “great” news. In the third quarter of 2020, the U.S. economy grew an astounding 33%. Here is a snip from CNBC:
“Coming off the worst quarter in history, the U.S. economy grew at its fastest pace ever in the third quarter as a nation battered by an unprecedented pandemic started to put itself back together.” – CNBC
Here is the problem.
You sit down at a poker table in Las Vegas with $100. On the first hand, you lose 31.4%—that hurt. However, on the other hand, you go “all-in” and win 33.1%.
So, you are now ahead, right?
Not so fast. Here is the math.
-
$100 X -31.4% = $68.6
-
$68.6 X 33.1% = $91.31
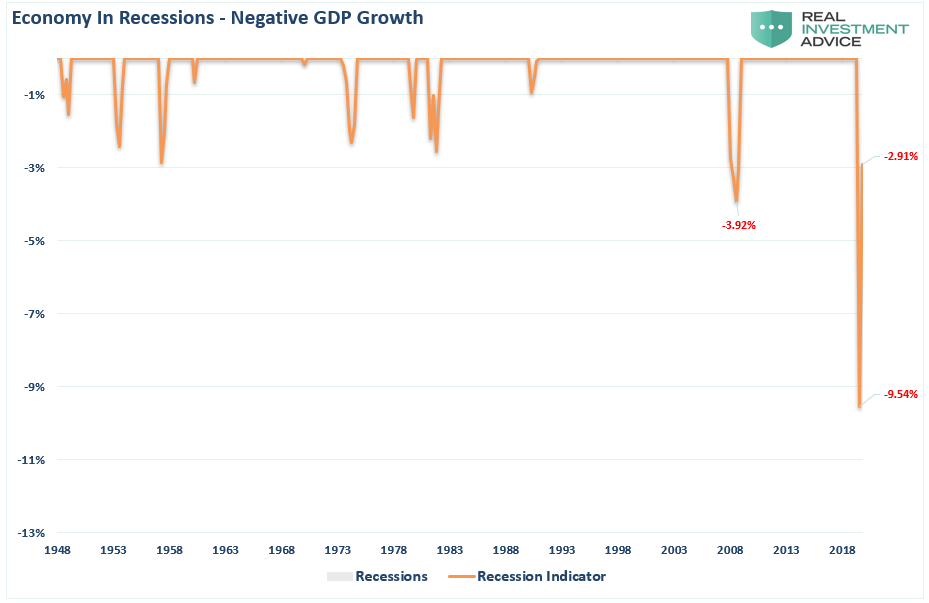
When it comes to the economy, the math is the same. As shown below, despite a “boomer” GDP report in Q3, the economy remains in one of the deepest recessions on record other than2008.
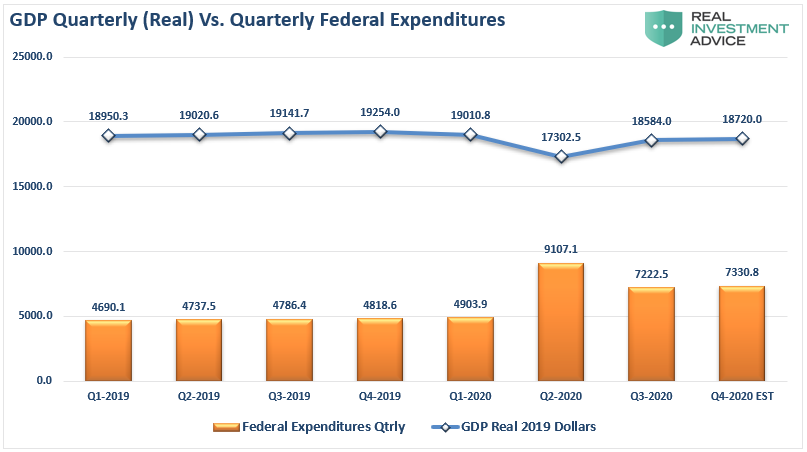
The bad news is that without further fiscal stimulus, economic growth will contract in Q4. Economic growth will contract if federal expenditures fall back to previous levels of roughly $4 Trillion per quarter. In Q4, expenditures will need a run rate of over $7 Trillion to grow the economy at 2%.
The Fed will have a lot of “monetizing” to do.
Growth Won’t Return To Pre-Pandemic Trends
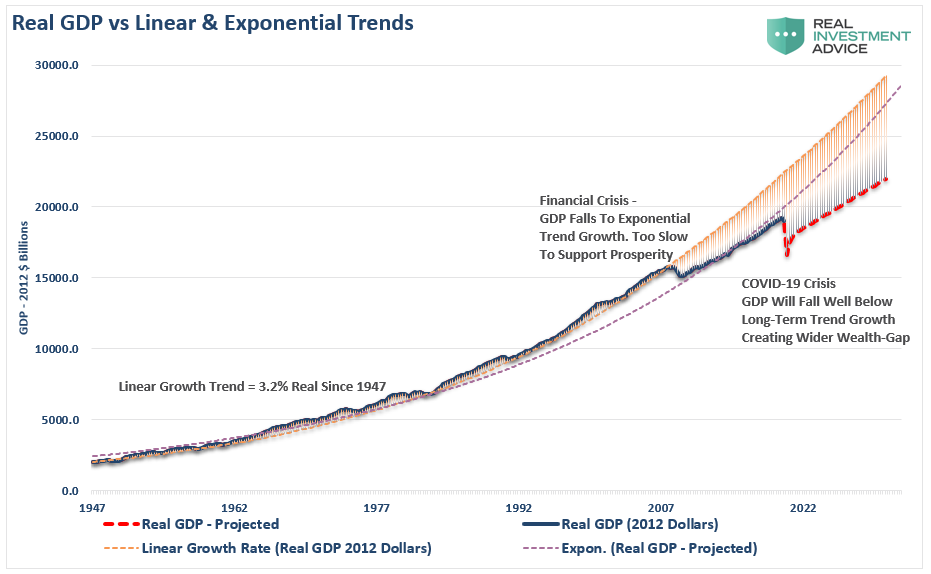
Before the “Financial Crisis,” the economy had a linear growth trend of real GDP of 3.2%. Following the 2008 recession, the growth rate dropped to the exponential growth trend of roughly 2.2%. Instead of reducing the debt problems, unproductive debt, and leverage increased.
The “COVID-19” crisis led to a debt surge to new highs. Such will result in a retardation of economic growth to 1.5% or less. As discussed recently, while the stock market may rise due to massive Fed liquidity, only the 10% of the population owning 88% of the market will benefit. In the future, the economic bifurcation will deepen to the point where 5% of the population owns virtually all of it.
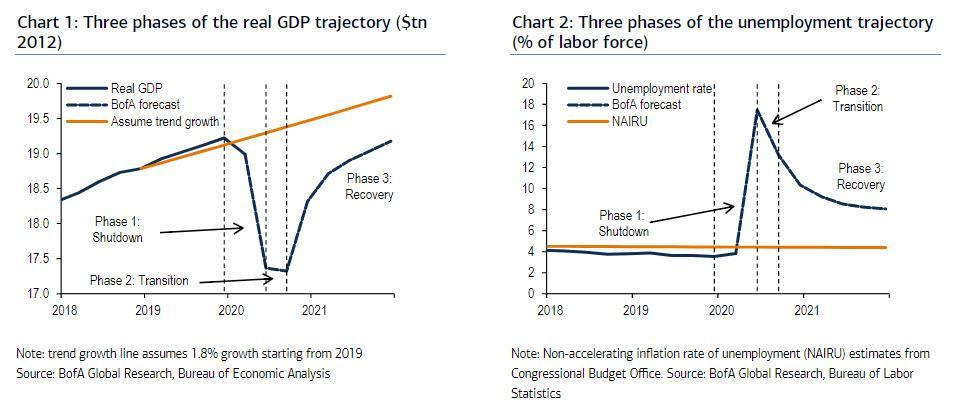
However, this isn’t just my opinion. As noted by Zerohedge, a permanent loss in output in the U.S. is likely. BofA laid out the pre-covid trend growth and compared it to base case recovery.
Given the permanent loss in output and rising unproductive debt levels, the recovery will be slower and more protracted than those hoping for a “V-shaped” recovery. The “Nike Swoosh,” while more realistic, might be overly optimistic as well.
However, this is the most crucial point from BofA:
The U.S. economy will never return to either its long-term linear or exponential growth trends.
Such has important considerations for long-term investors when it comes to revenue, earnings, and market valuations.
But that is a topic for next time.
For now, let’s get through the election.
Don’t Be That Guy
Our friend Victor Adair shared some of his valuable trading wisdom with our RIAPRO Subscribers (30-day Free Trial) this week, which dovetails with our views.
“The most important thing I do with my trading is to constantly try to identify and monitor the risks I’m taking. Importantly, have strategies in place to control those risks. I think that contributes more to my trading success than picking what to buy or sell. Such is particularly the case given most traders lose money on more than half of the trades they make.
I use stops and keep the time horizon of my trading in sync with the time horizon of my analysis. I watch out for concentration (very important in this current “all one market” environment.) Importantly, I keep my size modest and I make sure no one trade is important. It’s just another trade.
But probably the most dangerous, elusive yet pervasive risk I have to deal with is my innate desire to assign some “reasonable cause” to price action. Such as, “Gold went up today because traders fear that the Fed will tolerate higher inflation.”
I say that’s dangerous because it’s SO easy to be “right” (make money on a trade) for the wrong reason. Once a trader assumes he knows what’s driving prices he’s going to be more aggressive. If he really was right for the wrong reason then he’s going to “dig in his heels” when the market goes against him. That is how you wind up losing WAY too much money.
I don’t want to be that guy.”
via ZeroHedge News https://ift.tt/2TFLUGi Tyler Durden
