Animated Map: U.S. Presidential Voting History By State (1976-2016)
Tyler Durden
Tue, 11/03/2020 – 17:45
As Americans go to cast their votes, considerable uncertainty remains about which candidate will be elected president. However, history can provide some clues as to how voters may act.
While some states have consistently seen Democrat or Republican victories, as Visual Capitalist’s Jenna Ross details below, other “swing states” have flipped between the two parties depending on the year.
In this graphic, we use data from the MIT Election Data and Science Lab to show U.S. presidential voting history by state since 1976.
Each State’s Winning Party
To calculate the winning ratio, we divided the votes for the state’s winning party by the total number of state votes. Here’s another look at the same data, visualized in a different way.
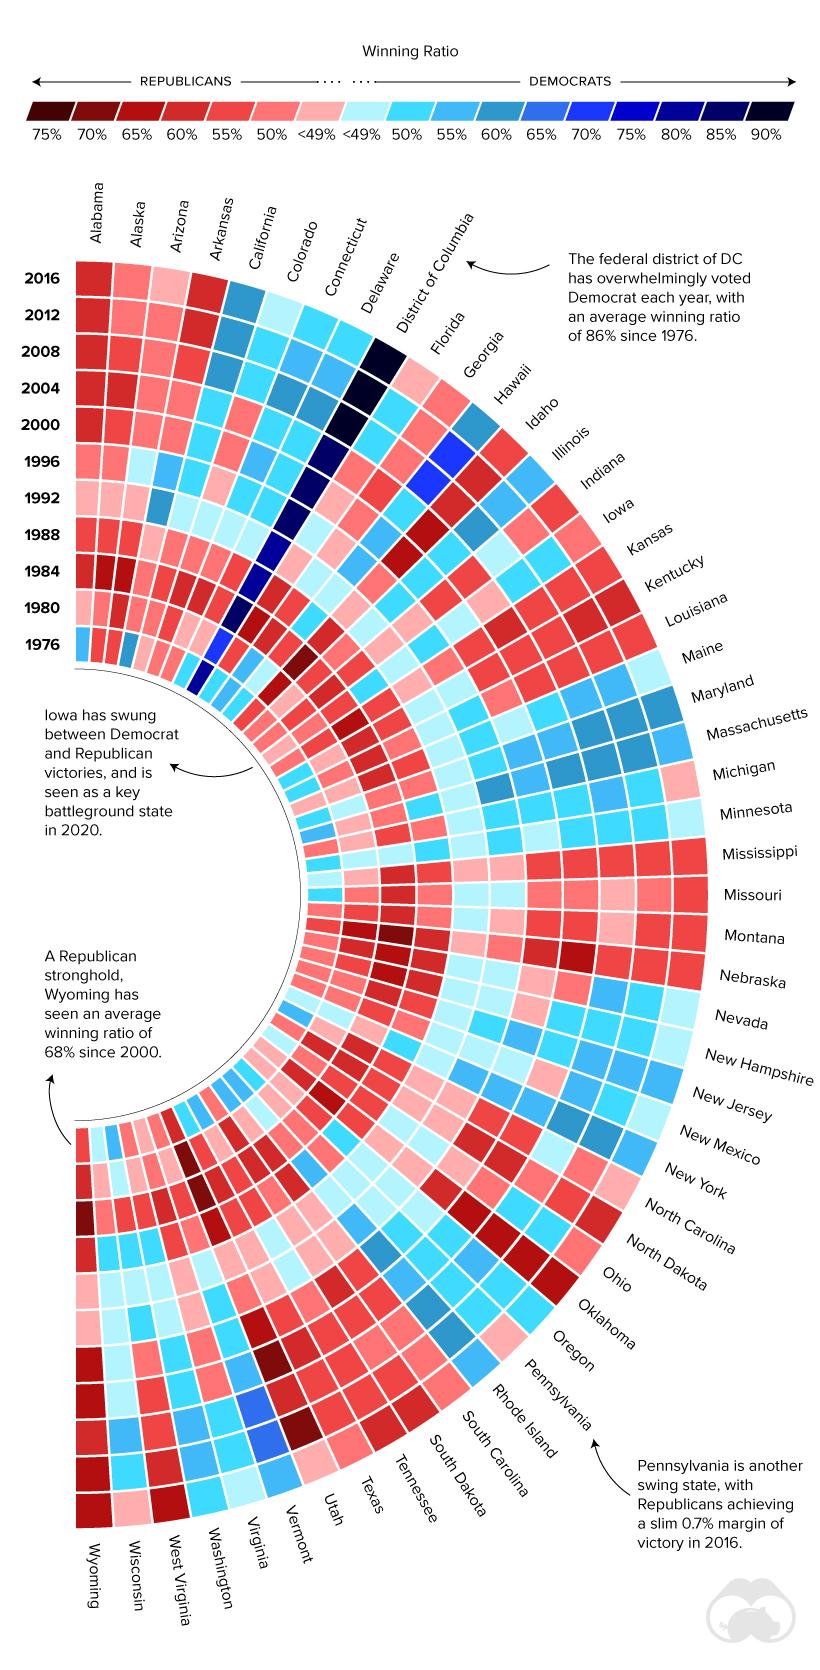
As the voting history shows, some states—such as Alaska, Oklahoma, and Wyoming—have consistently supported the Republican Party. On the other hand, Hawaii, Minnesota, and the District of Columbia have been Democrat strongholds for many decades.
The District of Columbia (D.C.) is a federal district, and is not part of any U.S. State. Its population is urban and has a large percentage of Black and college-educated citizens, all of which are groups that tend to identify as Democrat.
Swing states typically see a close contest between Democrats and Republicans. For example, Florida’s average margin of victory for presidential candidates has been just 2.6% since 1996, by far the lowest of any state. It’s often seen as a key battleground, and for good reason: the candidate who wins Florida has won every election since 1964.
Memorable Election Years
Within U.S. Presidential voting history, some election results stand out more than others. In 1984, President Reagan was re-elected in a landslide victory, winning 49 out of 50 states. The remarkable win has been credited to the economic recovery during Reagan’s first term, Reagan’s charisma, and voters’ opposition to the Democrat’s planned tax increases.
In 1992, self-made Texas billionaire Ross Perot ran as a third-party candidate. He captured almost 19% of the popular vote, the highest percentage of any third-party presidential candidate in over 80 years. While he gained support from those looking for a change from traditional party politics, Bill Clinton ultimately went on to win the election.
Most recently, the 2016 election took many people by surprise. Despite having a strong lead in the polls, Hillary Clinton was defeated by Donald Trump. A total of 30 states saw Republican victories, eager for change after eight years of Democrat leadership.
A Look Ahead
Is it possible to predict the 2020 presidential election? As the last election showed, polls are not a perfect measure. They represent a snapshot in time, may overrepresent certain population groups, and measure voter attitudes rather than behaviors, among other factors.
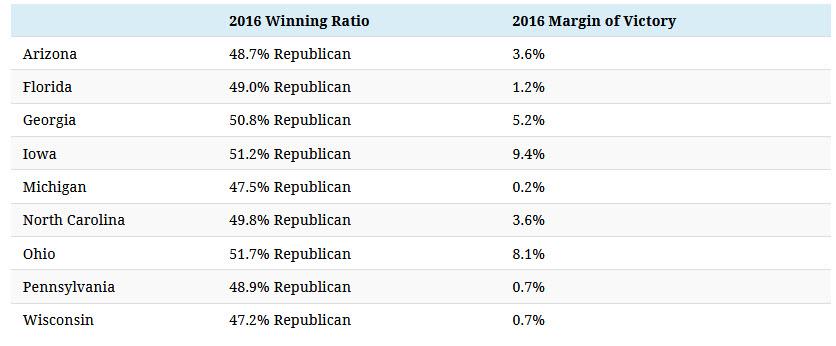
All saw Republican victories, but six out of nine states won by a margin of less than 5%. Trump and Biden’s success in these states may well determine the outcome of the 2020 election.
While there’s no crystal ball, swing states may offer the most insight as to where things are heading. Here are nine states that have been identified as battlegrounds, and how they voted in the 2016 election.
via ZeroHedge News https://ift.tt/38auHNQ Tyler Durden