2021: Fastest Earnings Recovery Ever?
Tyler Durden
Tue, 11/17/2020 – 08:10
As mentioned in “Markets” today, we want to take a deep dive into Wall Street’s S&P 500 profit projections for 2021 in Data. Three points here, using FactSet’s weekly Earnings Insight report for the Street’s out-year expectations (link to their full report below).
#1: Analysts expect 2021 to be a record year for S&P 500 profitability, the fastest return to new-high earnings since at least the 1980s.
-
Based on the latest FactSet data, the Street is looking for $168.38/share on the S&P next year. This would be 3.9 percent higher than 2019’s all-time high of $163.02/share.
-
The more typical recovery time to new-high profits is 3 ½ to 4 years, as the following quarterly historical analysis using S&P’s own data for operating EPS shows:
In the late 1980s – early 1990s cycle, it took 4 years for the S&P to see earnings per share get back to their old highs (Q3 1989’s $6.53/share to Q3 1993’s $6.57/share).
In the late 1990s – early 2000s cycle, it took 3 ½ years (Q3 2000’s $14.88/share to Q4 2003’s $14.88/share).
After the Financial Crisis, it took the S&P 4 years to recoup its earnings power (Q3 2007’s $24.06/share to Q3 2011’s $24.86/share).
-
While it therefore might seem a stretch to think 2021 can post record-high earnings, keep in mind that Q3 2020 was so strong that we’re only talking about 9 percent growth in 2021 from Q3 2020. The S&P posted $38.74/share in Q3, which annualizes to $155/share. Next year’s estimate of $168.38/share is 8.6 percent higher.
Takeaway: start with a solid base of corporate earnings in Q3 2020, add what we all hope is a highly effective virus vaccine, stir in still-low interest rates and decent (for the conditions) consumer spending, and you SHOULD get record high 2021 earnings. A presumably still-split Congress means corporate tax rates should not rise next year, another important ingredient of course.
#2: This earnings growth should come from more cyclical sectors like Industrials, Consumer Discretionary and Materials, but the Street expects every sector to show at least 5 percent bottom line improvement and 3 percent revenue comps to 2020.
Here are the FactSet charts showing the sector-by-sector revenue (first image) and earnings (second image) comps for 2021:
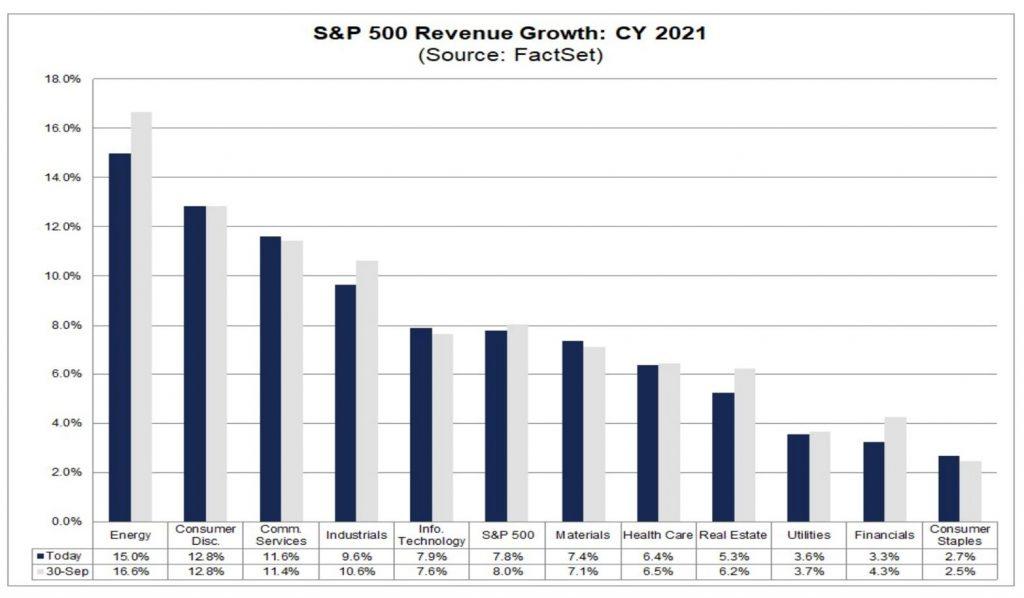
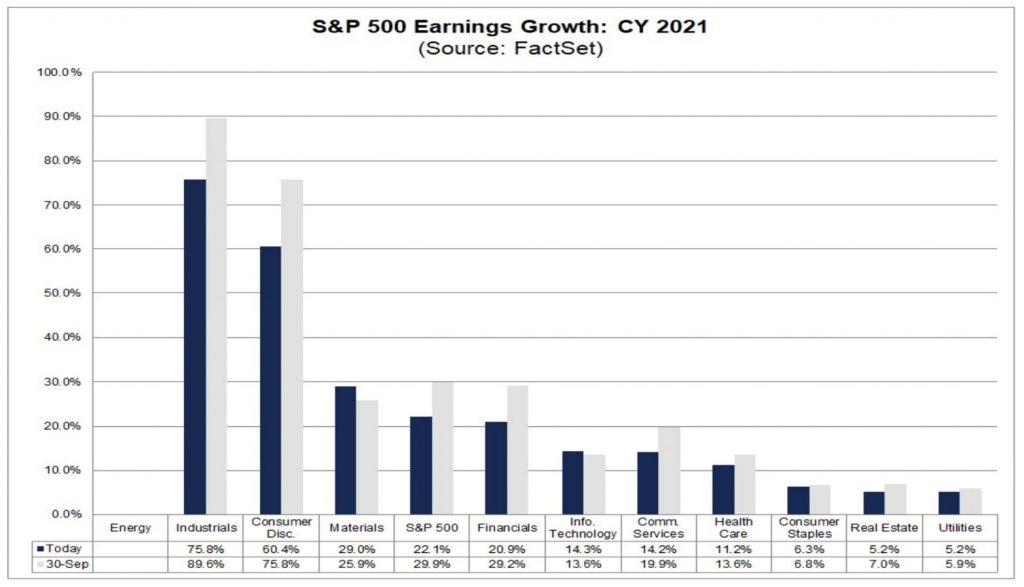
The important thing to note here is just how much 2021’s expected earnings growth outpaces revenue growth everywhere except Real Estate. Look at the aggregate S&P numbers: 7.8 percent revenue growth translates into 22.1 percent earnings growth. Three points on this:
-
Typical earnings leverage is more like 3-4 points. Revenue growth of 3 percent yields earnings growth of 6-7 percent because some portion of a company’s cost structure is fixed. But… under more ordinary circumstances there’s always cost-creep in corporate income statements that make 3-4 points of leverage more of a ceiling than a floor.
-
The only time you can pencil in 14 points of leverage (as the Street is doing now for 2021) is very early in an economic cycle. That’s because managements are still very cautious about adding unnecessary expenses right after a recession and this – along with better/richer mix revenue streams – creates outsized earnings leverage.
-
Look at the 3 leftmost bars in the second graph, and you’ll see they are all high fixed cost industries where operating leverage is high (Industrials, Consumer Discretionary, Materials). Energy may not post a profit in 2021, but you’ll see in the first graph that it is expected to see the largest percentage revenue improvement of any S&P sector.
Takeaway: as much as the Street’s assumption of 14 points of S&P 500 operating leverage in 2021 might sound way too high, given all that’s occurred in 2020 it could actually be low if revenues recover more strongly and cost containment measures remain in place. Also worth considering: many companies are still not giving earnings guidance for Q4 2020 or 2021CY. Both those points add up to a lot of uncertainty, to be sure, but also a lot of potential for upside earnings leverage in 2021.
#3: Everyone knows US equities are richly valued just now, but given the dynamic we’re laying out here today that’s entirely understandable. Consider this FactSet chart, which shows each sector’s valuation based on 12-month forward expected earnings:
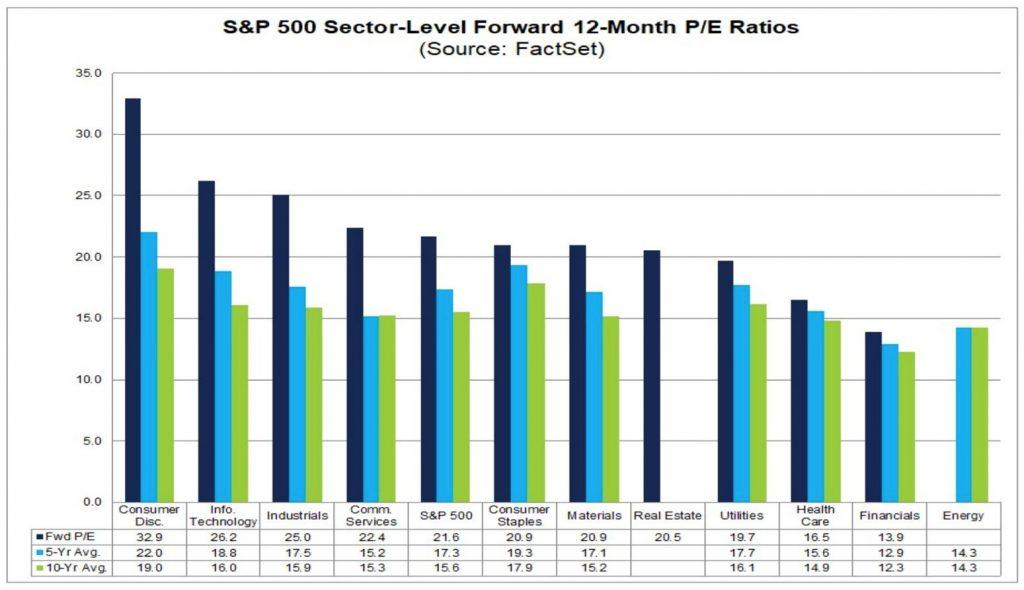
The dark blue bars represent current forward PE ratios, and the light blue/green bars show the 5-/10-year averages. The widest spreads between dark blue and light blue/green are either in sectors that have proven themselves largely recession-proof in 2020 (Tech, Comm Services) or have outsized earnings leverage in 2021 (Consumer Discretionary, Industrials, and Materials).
Takeaway: the S&P 500 is trading at 21.6x earnings, 40 percent its 10-year average, for basically one fundamental (i.e. not interest rate-related) reason. Markets think Wall Street’s 2021 numbers are too low by at least 10 percent. If 2021 comes in at $185/share rather than $168/share, then the S&P would be trading for 19x earnings today. Given long term rates are at 1 percent, that sort of multiple makes sense.
The bottom line to all this: equity valuations during cyclical recoveries always feel high, and the US stock market right now is no exception. We have a few unusual factors to put in the mix as well, ranging from the effect of the virus on the Q4/Q1 global economy to a new political setup in Washington. We’ll close on this thought, though: if you don’t believe US corporate earnings can show dramatic operating leverage in 2021 then now is the time to consider lightening up on risk exposure.
via ZeroHedge News https://ift.tt/2IAvQny Tyler Durden