No, Low Rates Do Not Lead To Higher Earnings Multiples: What That Means For Markets
Tyler Durden
Sat, 12/05/2020 – 18:35
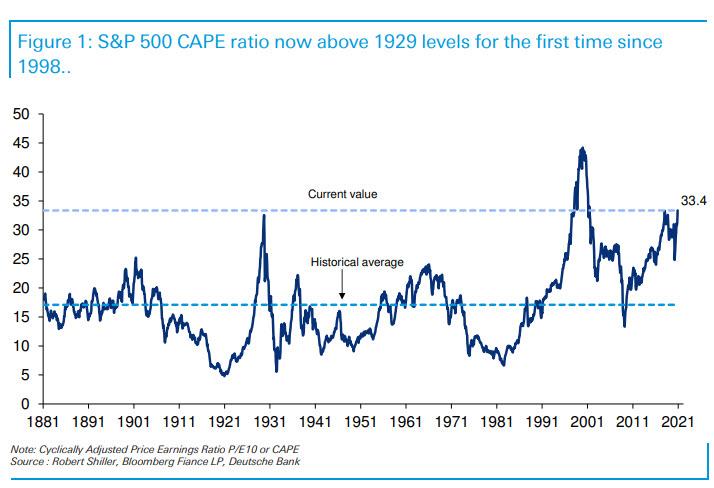
With the S&P closing Friday at a new record high just shy of 3,700, which as we showed last week translates into a Shiller CAPE ratio now above levels where it was on the eve of the crash of 1929 for the first time since the dot com bubble…
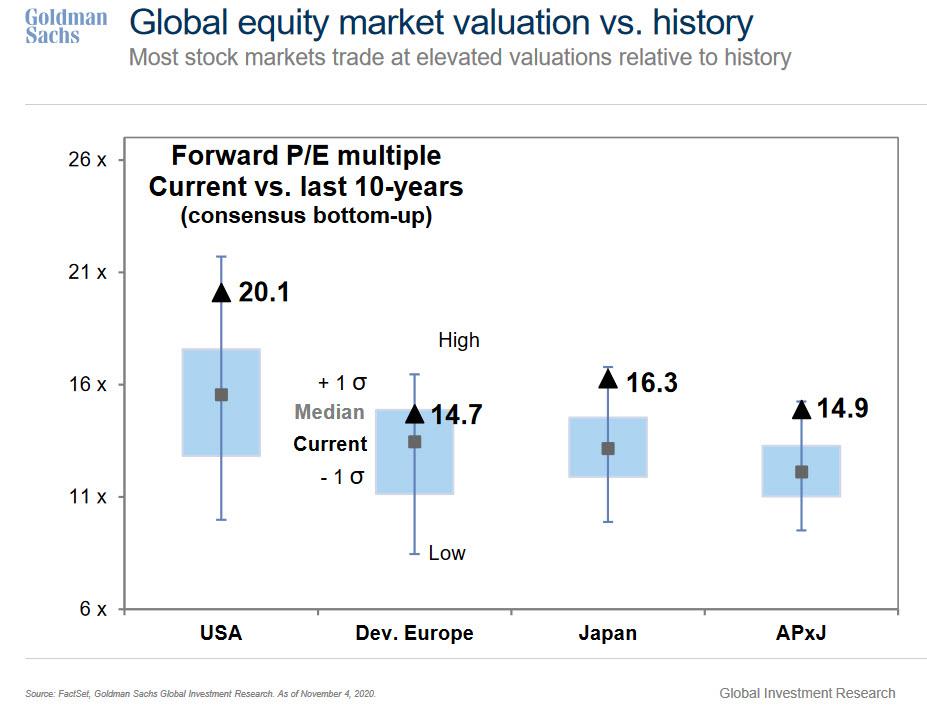
… even Goldman has been forced to admit that stocks around the globe are at extremely elevated valuations relative to history not just on a forward P/E multiple basis…
… but across all valuation metrics…

… with one exception: the equity risk premium, which is also used in the so-called “Fed model”, both of which boil down to a simple concept: that low interest rates (and rates are now the lowest they have been in 4000 years of history) justify – and “allow” – high earnings multiples, implying that even if stocks are extremely overvalued since rates are at historic lows, investors have no choice but to keep buying stocks as there are no alternatives.
But is that true?
That’s the question which Gerard Minack, of Minack Advisors, raised this week as Bloomberg’s John Authers noted: do low interest rates on their own lead to higher earnings multiples?
Well, contrary to what Goldman, Morgan Stanley and virtually every other bank writes using the “Fed Model” as the only valuation-based justification for projecting even higher S&P500 targets in 2021 and onward (most banks predict the S&P will rise another 10-15% next year), Minack’s answer is a resounding no: it’s not rational to bid up stocks just because rates are low.
The reason is blindingly simple to anyone whose pay doesn’t depend on goalseeking a bullish narrative, namely that “all else is not equal”, or in other words, interest rates are usually low – i.e. disinflationary – because growth is bad, and as Authers redundantly clarifies, when growth is bad that tends to be bad for equities (except, paradoxically, now when collapsing global GDP has pushed world stocks to record highs).
Minack digs deeper to find that there is a curved relationship between rates and equities over time: when rates come down from very high levels, equity multiples tend to improve, but when rates then drop to very low levels, equity multiples fall because this generally means that the economy is mired in a recession.
The chart below from Minack maps the CAPE on one scale against the 10-year yield on the other for every month since 1925. It shows that the relationship between the two isn’t that strong. In fact, the best fit Minack can find, excluding the bubble dot-com years, has an R-squared of only 0.12, meaning only a weak correlation:
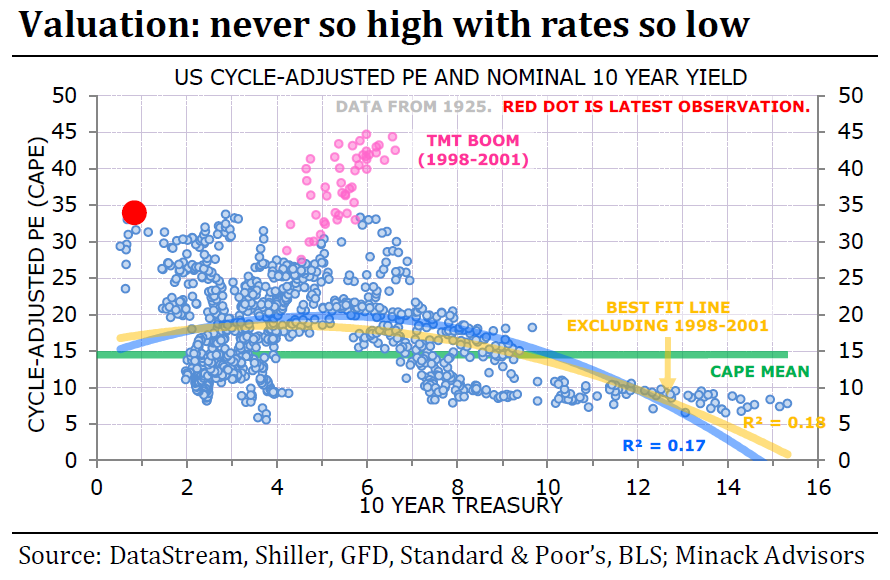
As Authers points out the dot-com bubble readings, in pink, are almost off the chart — irrationally high multiples given the interest rates of the time (everyone knows what happened next). The current reading, shown in bright red, is clearly alarming as it’s the only time outside of the dot com bubble when the CAPE ratio was this high. This isn’t a well-explored end of the spectrum, obviously, but stocks do look expensive… and of course, Wall Street is quick to point out that this is justified due to the record low yields. Further bolstering the bullish case, one can extrapolate Shiller’s logic to show that one would expect the excess yield to rise further as rates get to extreme lows. If the relationship with rates held as anticipated in his chart, then the excess yield as calculated by Shiller would be roughly double what it is now (and stocks, on Shiller’s suggested methodology, would look like a screaming buy).
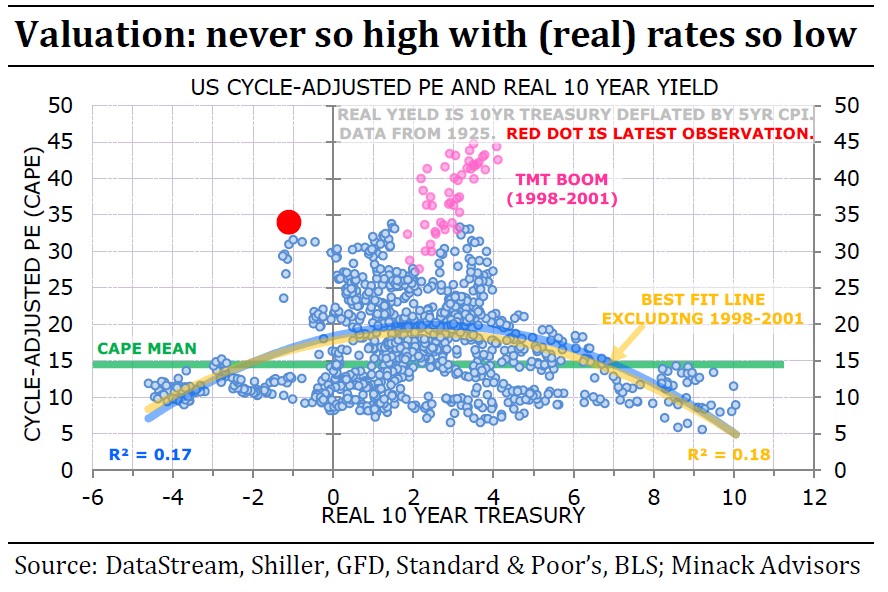
What if instead of nominal one uses real yields? Minack repeats his exercise to account for inflation, looking precisely at real yields which as one can imagine, are low present, but not historically unprecedented. As Bloomberg’s Authers writes, this exercise gives a slightly better correlation, “makes the dot-com bubble look like more of an outlier and, sadly, also makes the current point look like more of an outlier.” In short, while there have been a number of observations with 10-year nominal yields below the rate of inflation in the past, this is the most expensive that stocks have ever been during such a period:
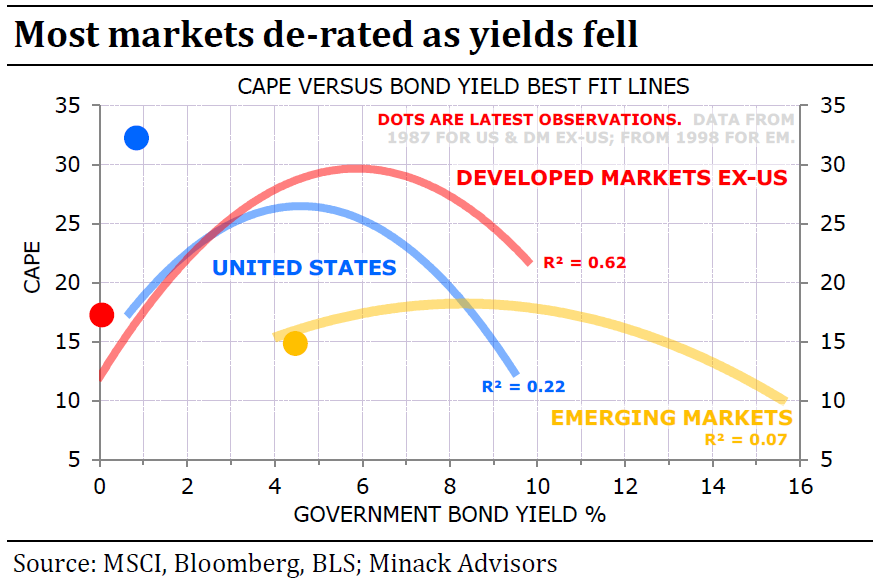
What is particularly notable is that not every market is an outlier like the US: the next chart, which uses nominal yields since 1987, compares CAPEs and 10-year yields for developed markets outside the U.S., emerging markets, and the U.S. While the US is clearly a bubble, stocks outside the U.S. appear to be reasonably valued given the level of interest rates. It is only U.S. stocks look wildly overpriced across most valuation metrics as even Goldman would agree:
And here a nuance emerges: as Authers points out, in an intriguing development, the U.S. relationship between yields and earnings multiples has started to differ from its historic pattern only in the last six years. In other words, until the end of 2013, there was a much more discernible correlation, with an R-squared of 0.38. But since the end of 2013, earnings multiples have been without exception higher than the previous relationship with interest rates would have suggested. In fact, they have never been further away. To be clear, this means that they now look unambiguously expensive, given where interest rates are, even though interest rates are so low:
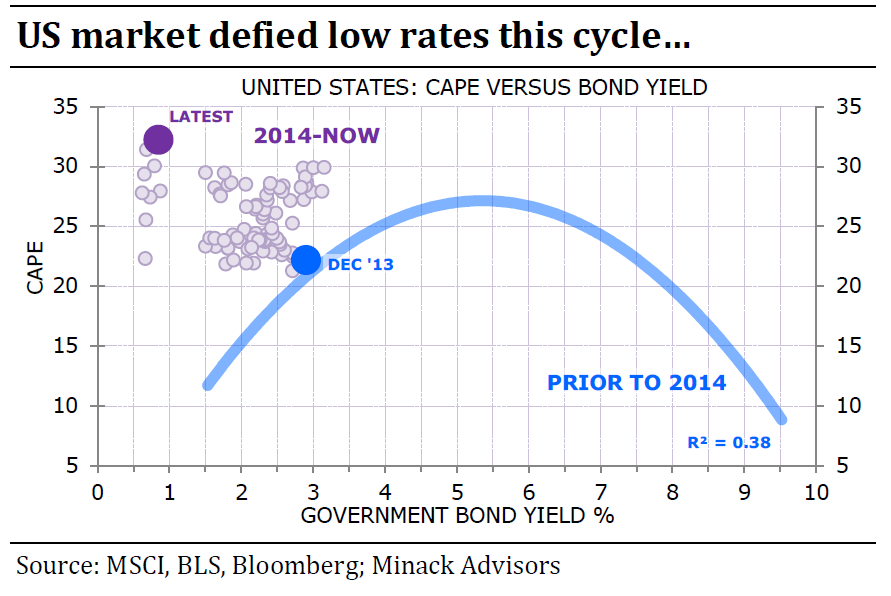
According to Authers, we can learn two things from this chart:
- One is that the relationship between rates and earnings multiples changed at some point early in the last decade in the U.S., presumably when investors got used to the notion of enduring “lower for longer” rates coupled with low inflation. One possibility is that this was due to the belief that the traditional relationship between rates and the economy had broken down, in other words the advent of central planning by banks broke one of the most fundamental valuation relationships.
- The second is that whatever is driving multiples higher, it isn’t rates. As the chart shows clearly enough, rates have been on or about where they are now for nine months. Earnings have dipped and then recovered, and yet this is the most expensive that stocks have been.
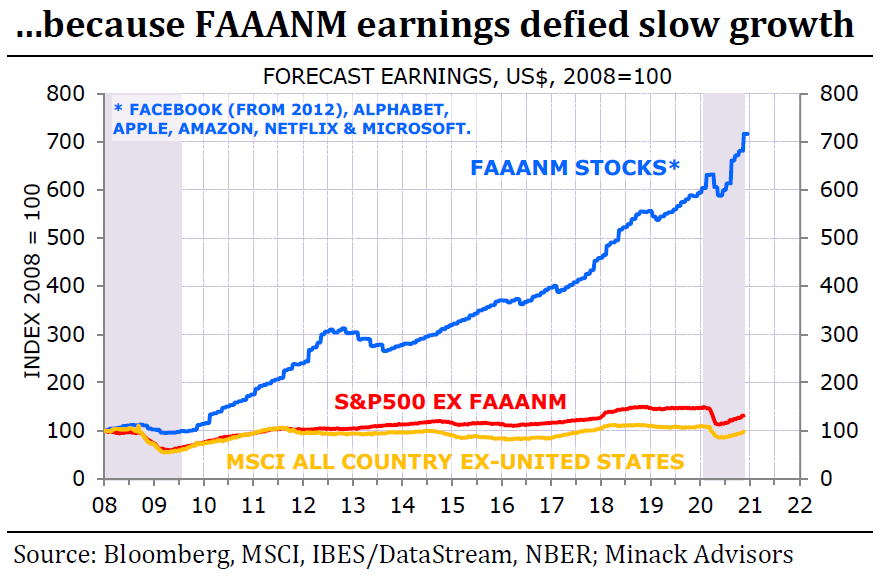
In an attempt to find out what is driving multiples, Minack next turns to the FANG stocks, which he defines as the FAAANMs (for Facebook, Amazon.com, Apple, Alphabet, Netflix and Microsoft). The key finding is that their earnings have, until now, defied slow growth that defined the developed world during the post-crisis decade, and have even defied the slump that followed the Covid shock. The rest of the S&P 500, and indeed the rest of the world, did nothing remotely similar. The following stunning chart from Minack shows the internet platform groups’ earnings, rather than their share prices.
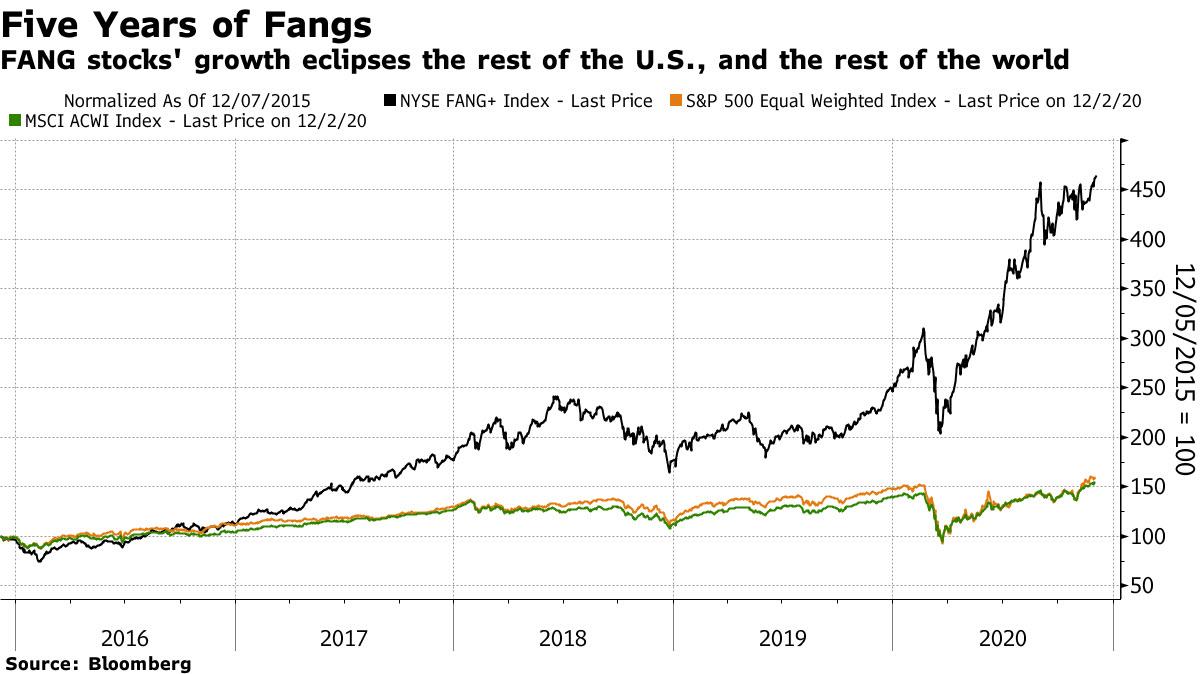
Of course, soaring earnings also mean soaring stock prices (especially when one applies record PE multiples), and on Friday the NYSE Fang+ index hit a new all-time high. As Authers shows, over the last five years, its performance has dwarfed that of the S&P 500, and the MSCI all-world index. While smaller stocks are beginning to make a relative comeback, the FANGs’ share prices are as high as they have ever been in absolute terms.
Putting it together, while much of the world has seen corporate earnings behave just as one would expect in a world of very low interest rates (i.e., in a very sluggish economy), a tiny group of U.S. companies have managed to defy that logic completely and seen their earnings explode, dragging the US stock market higher while leaving the 494 remaining S&P companies in the dust. And now, amid growing expectations of a post-vaccine boom, earnings estimates are rising even more. That leads stocks to trade at a higher multiple of past earnings. In other words, as Authers notes, “it is earnings expectations, not rates, that have brought the market up in the last month or so, on this logic, and it would be an earnings disappointment (presumably sparked by some disappointment with distribution of the vaccine) that would bring it down again.”
As Minack summarizes:
In short, the US has been exceptional – relative to both its own history and other markets – by re-rating in the low-rate post-GFC cycle. The reason global equities are re-rating now is because of improving growth expectations, not because rates are low. If the rally were to correct – and I think it’s getting frothy – then the catalyst will be a growth scare, not a rate scare. Having said that, it’s a terrific combination for equities if growth does improve as expected next year and rates stay low. That combination would be more beneficial for de-rated non-US markets than the re-rated US market.
Indeed, anywhere one turns, one can find banks pushing the argument for favoring non-U.S. equities over the U.S. – JPMorgan did that just this week, when it downgraded US stocks and upgraded Europe.
That said, even in a world where record low rates did not justify the record high in stocks, and as we have repeatedly cautioned the last thing markets want is to find out what will happen if rates do surprise by rising, especially if they spike higher in an uncontrolled manner similar to what happened during the 2013 taper tantrum when 10Y yields soared by 150bps in months. As Authers notes, “U.S. markets have been working on the assumption that they will stay low for a while. It has been an unspoken ceteris paribus clause” and for good reason: “The sharp corrections in response to slightly higher rates in 2013 and 2018 both forced central banks into climbdowns.”
This is also the worst case conceived by Morgan Stanley’s Michael Wilson who last week said that “with our economists forecasting 7.5% nominal US GDP growth next year, a 1% 10-year Treasury bond looks awfully mispriced on a 12-month view. This has implications for equity valuations, especially longer-duration ones like the Nasdaq and S&P 500.”
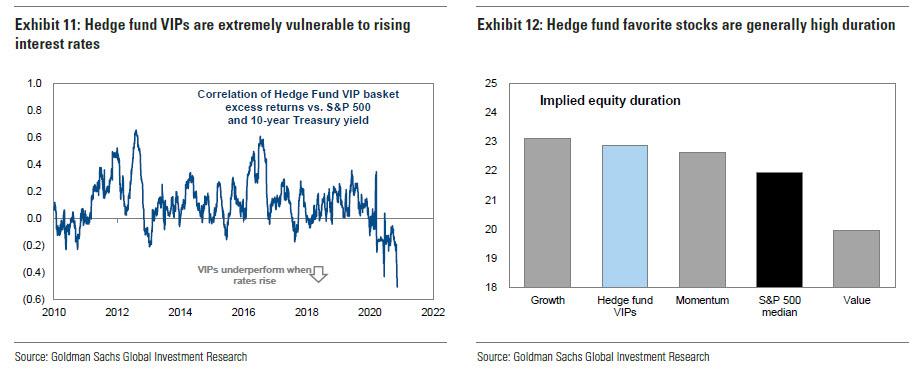
Conversely, shorter-duration cyclical and value stocks get a boost from better growth and higher interest rates – hence the rotation we have been witnessing in the equity markets from the Nasdaq to the small-cap Russell 2000 over the past few months as markets contemplate a full reopening of the economy. “We think this rotation has further to go if we are right about the economy and rates” according to Wilson.
Of course, the question is just how high will rates eventually go in a world where the recent record injection of M2 would suggest it is just a matter of time before we experience a record inflationary spike:
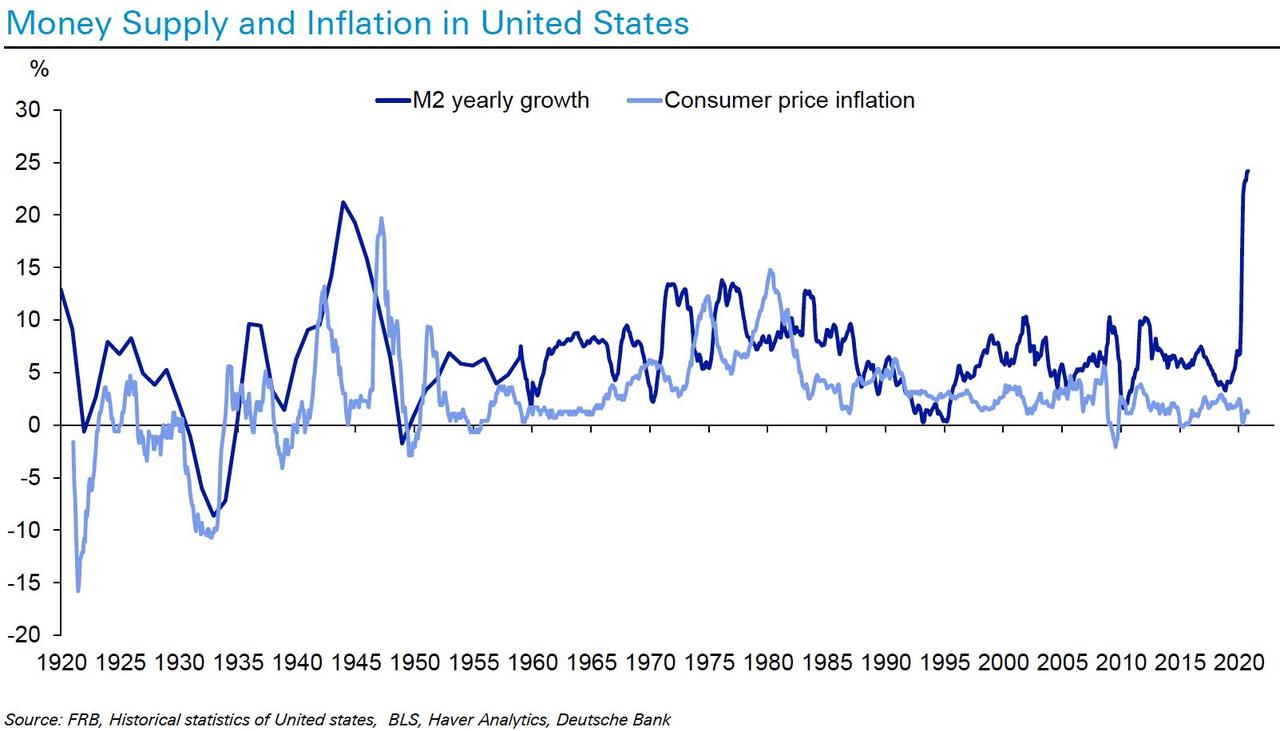
As Authers ominously concludes, “we don’t yet know the results of an experiment in which rates rise and central banks cannot climb down because the economy is growing and inflation is back” but we may very soon have to find out.
via ZeroHedge News https://ift.tt/37HUqeq Tyler Durden