Railroads Slashed Jobs In Nov To Lowest In Decades… As Stocks Soared To Record Highs
Authored by Wolf Richter via WOLF STREET,
Railroads responded to structural challenges by slashing jobs. Did nothing for volume but did everything for their stocks.
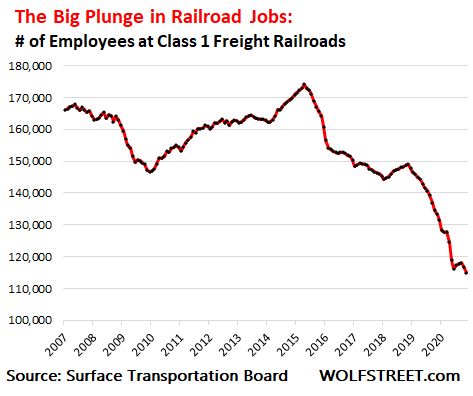
The North American Class 1 freight railroads – BNSF, Union Pacific, Norfolk Southern, CSX, Canadian National, Kansas City Southern, and Canadian Pacific – have been shedding employees since 2015, and in November they shed another 1.6% of their employees, from October, bringing the total down to 114,960 employees, according to data released by the Surface Transportation Board (STB), an independent federal agency. It was the lowest headcount in many, many decades.
November headcount was down by 13.7% from a year ago, down by 22% from the Great Recession low at the end of 2009 (147,000), and down by 33.5% from the recent high in April 2015 (174,000):
Railroads submit employment data – along with a slew of other operating data – to the STB on a monthly basis. I have excluded Amtrak (the National Railroad Passenger Corporation) because it is not a freight railroad (it too cut headcount).
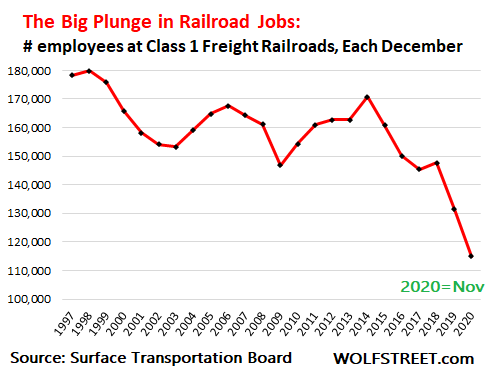
Back in 1997, which is as far back as the publicly released data by the STB goes, railroads employed 178,000 people. In 1998, railroads employed 180,000. Employment in November was down by 36% from 1998. The chart below shows Class 1 railroad employment in each year in December, except for 2020, when I used November (in recent years, headcounts dropped further from November to December):
Compared to November last year, each of the Class 1 railroads shed employees, in order of the number of remaining employees:
-
BNSF: -15.6% (35,081)
-
Union Pacific: -13.4% (32,046)
-
Norfolk Southern: -15.9% (19,199)
-
CSX: -9.0% (17,093)
-
Canadian National: -13.2% (6,183)
-
Kansas City Southern: -10.1% (2,718)
-
Canadian Pacific: -9.4% (2,640)
Since September 2016, which is as far as the STB’s monthly data by individual railroad goes back, some railroads have been busier than others shedding employees. All combined have shed 24.6% of their people. Each railroad, in order of the biggest shedders in percentage terms:
-
CSX: -30.5%
-
Norfolk Southern: -30.2%
-
Union Pacific: -29.5%
-
BNSF: -17.7%
-
Kansas City Southern: -9.3%
-
Canadian Pacific: -5.1%
-
Canadian National: -4.8%
The chart below shows the relentless progress in shedding employees by each of the railroads over the past four years:

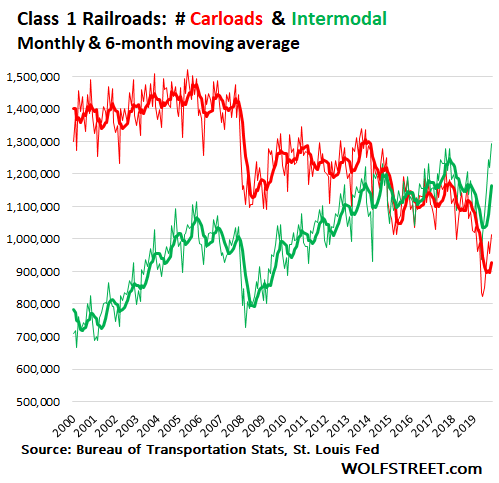
There are some structural challenges railroads have faced over the past two decades, including the decline of coal as the primary fuel for power generation (coal went from a share of 55% in the 1980s to a share of 23% these days). Coal – like other bulk commodities such as corn or petroleum products, and in addition to goods such as motor vehicles and industrial equipment – falls under the railroad metric of “carloads.” And the decline of coal is largely the cause of the long-term decline of carloads, from around 1.45 million car loads per month in 2005 and 2006, to just over 900,000 carloads currently.
The intermodal business (hauling containers and trailers) has been the growth sector for railroads. But this is precisely where competition from truckers has been ferocious, much of it based on service, such as speed, convenience, and reliability. And a deterioration in service sends container traffic to the highway.
The chart shows the originations of carloads (red) and intermodal (green) by all Class 1 railroads combined, monthly and their 6-month moving average:
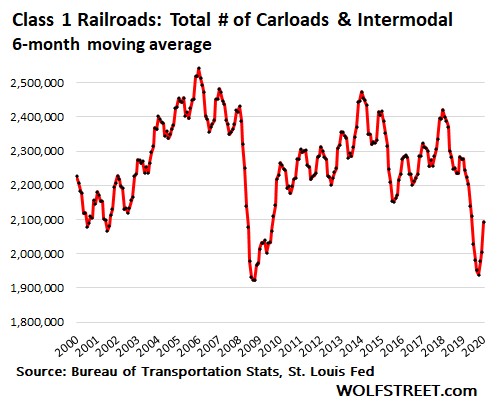
Total traffic volume over the long term, with all types of loads combined, puts the railroads in a highly volatile, cyclical, and horribly stagnant business. The good thing for railroads is that intermodal is a relatively high-margin business that brings in the dollars.
This chart of carloads and intermodal combined, as 6-month moving average, shows just how tough this business is, and rampant cost cutting, if it entails lowering service quality, will send more of the booming intermodal business to the highway. Total originations have dropped 16% since the peak in 2006:
Railroads have responded to the long-term challenges by cutting costs. The hottest cost-cutting system is Precision Scheduled Railroading (PSR), under which railroads attempt to operate their carload and intermodal business more efficiently, such as more point-to-point routing. Other folks have called it slash-and-burn because it ends up slashing headcount and capital expenses.
Some folks have come to believe that PSR actually stands for Positive Shareholder Reaction, because it has done precisely that; these days, everything boils down to pumping up share prices no matter what, even if it sends business to the highway.
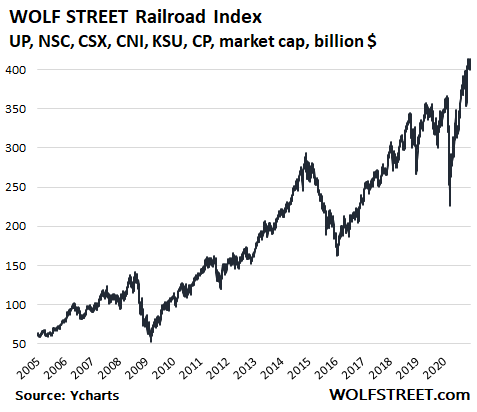
So this is the WOLF STREET Railroad Index, based on market cap in billions of dollars of Union Pacific [UNP], Norfolk Southern [NSC], CSX [CSX], Canadian National [CNI], Kansas City Southern [KSU], and Canadian Pacific [CP]. Union Pacific, given its market cap of $137 billion, currently weighs 33.5% in the index. BNSF is owned by Berkshire Hathaway and is not included.
The index is up 18.3% year-to-date, despite the plunge in March. Since the bottom in March, it’s up 80%. It has nearly tripled from the high before the Great Recession in August 2008, even as total carload and intermodal originations have dropped 17% from the peak in 2006. Shedding massive numbers of employees has a marvelous effect on stock prices (market cap data via YCharts):
* * *
Tyler Durden
Sun, 12/27/2020 – 15:00
via ZeroHedge News https://ift.tt/37Rw438 Tyler Durden