Dollar Freak Show
Authored by Sven Henrich via NorthmanTrader.com,
Who’s ready for a total freak show? Buckle in for I came across something interesting putting a couple of pieces of the market puzzle together.
In The Alternative View I outlined some charts I see as critically important to watch in 2021. One of these charts is the US dollar, particularly because it, against all popular sentiment, shows potential for a sizable bullish move to come in 2021.
I say potential because as chart technicians we look for predictive patterns to help assess future risk/reward. We are also perfectly aware that patterns can get invalidated or not trigger at all, but when patterns kick in and confirm price tends to follow the predicted path. Technical patterns emerge all the time and traders use them to define their entries and trade direction.
Patterns can emerge on an intraday day basis or in 15 minute charts, 2 hour charts and on longer time frames. Longer time frames are particularly notorious for testing the patience of the keen observers for they can take months to evolve and resolve.
If you read the The Alternative View you know about the declining wedge pattern and positive weekly divergence in the US dollar and I’ve been updating the chart on Twitter. For many wondering why Gold got hammered on Friday look no further to the US dollar which indeed began to show sudden strength after again tagging the lower trend line:
Yo dollar, what’s the holler?$DXY pic.twitter.com/tysylwE8Cc
— Sven Henrich (@NorthmanTrader) January 11, 2021
This tag happened on Friday.
Something else happened on Friday. $SPX tagged a key trend line as well:
Wild if true.$SPX pic.twitter.com/b7bKc4J9MA
— Sven Henrich (@NorthmanTrader) January 11, 2021
Odd. A coincidence that the US dollar and $SPX tag key trend lines on the same day?
So I went back and overlaid both tickers on a cash chart and behold, a total freak show:
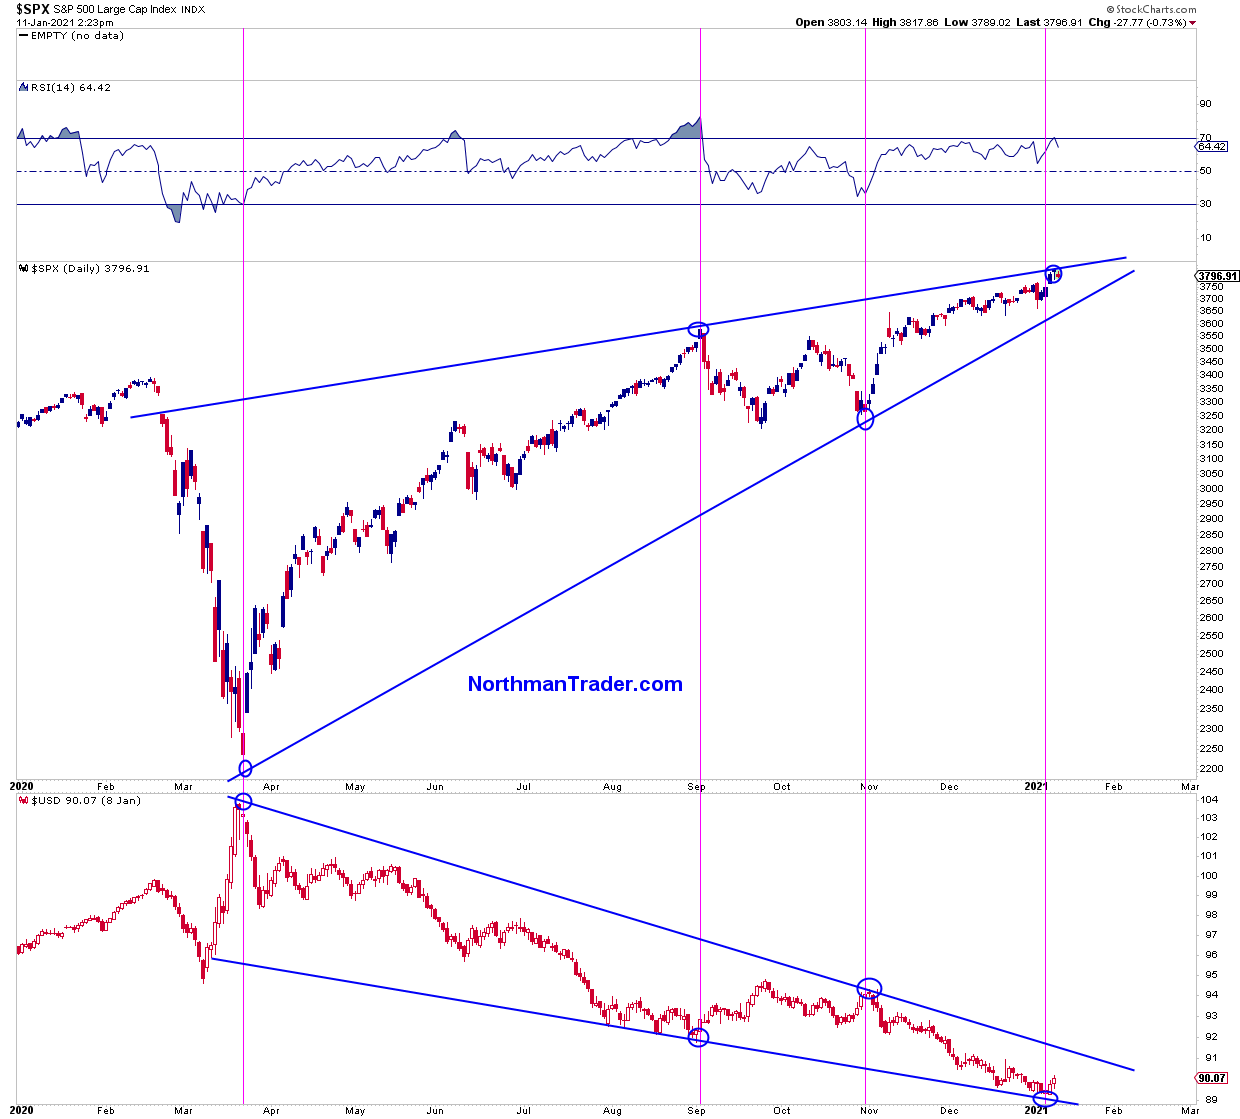
Not only are both tickers in giant wedge patterns, but the respective tags of their trend lines are virtually directly correlated.
The dollar peaked of course during the March lows, but ever since these trend lines have formed marking key pivots in price for the US dollar and the S&P 500.
Most notable here is that the lower US dollar trend line began forming in July and August, confirmed again in September and was firmed again with the tag last week. The message here: Markets are clearly reacting to this trend line and now $SPX has also confirmed its pattern with its 3rd tag of its upper trend line on Friday and rejection today.
Look also at the October/November high in the dollar marking the lows for the S&P 500. The relationship is well represented here.
The freak part in all this, to my eye, is that these wedge patterns have, for now, completely aligned in marking pivots in markets.
The declining wedge in the US dollar is a larger potential bullish pattern. The extremely large rising wedge in $SPX is a potential very bearish pattern.
Neither pattern is confirmed, both would need to see breakouts or breakdowns to confirm. And perhaps they will play ping pong first, i.e. tagging their opposite trend lines first again and continuing the pattern for longer, or they break altogether in which case markets would be subject to intense volatility and price correction.
We can’t know the when and we are respectful of the possibility these patterns may invalidate in the future, but the corollary nature of not only the price action and patterns, but their now obvious near perfect concurrent production of key price pivots at now established trend lines make this a chart correlation freak show that nobody should ignore and watch carefully.
* * *
For the latest public analysis please visit NorthmanTrader. To subscribe to our market products please visit Services.
Tyler Durden
Tue, 01/12/2021 – 10:52
via ZeroHedge News https://ift.tt/35yt4qO Tyler Durden