Goldman Prime: Sector Rotation Into Energy Begins With Massive, 6-Sigma Buying
Two weeks ago, we discussed why according to JPMorgan, the biggest short squeeze yet was set to begin next month as systematic funds, momentum chasers, trend followers and the CTA community in general cover their legacy shorts in the energy sector and go long.
As JPM quant Marko Kolanovic explained, “CTA funds have been adding Energy exposure. The reason is that 12-month momentum turned positive on Oil, and going forward signals will remain solidly positive.” However, this is in the context of a huge systematic net short overhang in the energy sector. In other words, energy – in all forms be it oil or energy stocks – remains the most hated sector across all investors.
In simple terms, the catalyst that forces the squeeze is the anniversary of the collapse in oil prices at the start of the Covid crisis, at which point various vol metrics followed by vol-control funds will reset and they will have no choice but to go long. That – and this is the punchline of Kolanovic’s thesis – will “change in mid-March, when the momentum signal for energy equities turns positive” which is also a gentle hint from the JPM quant to all the redditors out there: if you want to spark a truly historic short squeeze, one which forces systematic shorts to not only cover but to go long, do it where it hurts and buy some energy stocks.
Kolanovic was kind enough to even give you the timing: you have about a month to do so because JPM’s model momentum factor “will need to rebalance in March by closing ~20% of its allocation to Energy equity shorts, and adding ~2% to energy longs, for a ~22% net buying in Energy.”
What is the quantitative significance of these flows? Well, the Croatian quant calculates that if one roughly assumes that there is about ~$1Tr in equity long-short quant funds and that half of these funds are not sector neutralized, “the flows could be quite significant, roughly $20-$30bn.” It could be far, far more. As shown in the chart below, the ratio of energy shares shorted vs all other S&P 500 shares shorted, closely followed the commodity supercycle. And, remarkably, the most recent number of shares shorted for energy was 4 times the S&P 500 average.

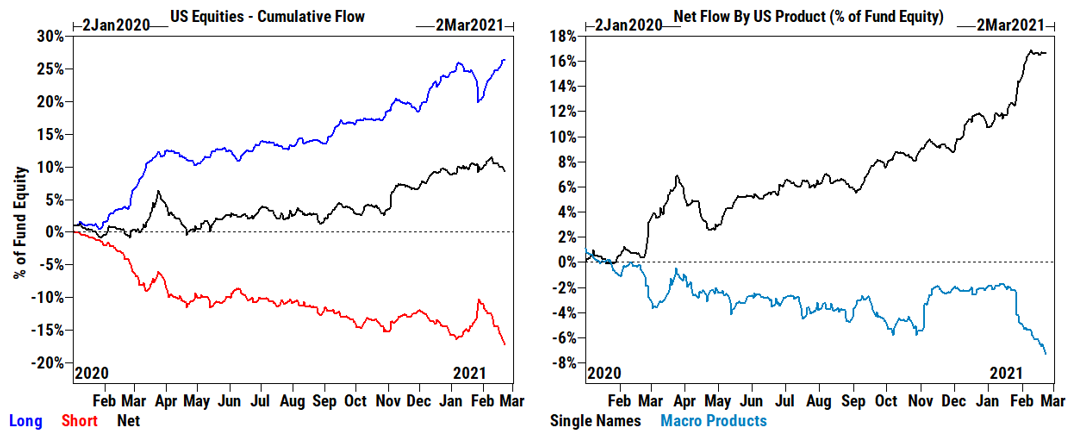
We then said that since vol-control funds are some of the dumbest money around and their actions can be anticipated well in advance. It now appears that said frontrunning of the CTA squeeze officially kicked off yesterday because according to Goldman prime on Monday, Feb 22, on the same day the bank saw the largest net selling in US Macro Products since Jan 27, the biggest increase in ETF shorts since November (offset however by aggressive buying in single names), it also observed the official start of sector rotation into energy stocks, as “energy stocks saw the largest 1-day net buying in more than two years” a +5.8 sigma move.
Here are the market details from Goldman’s Prime Service for Feb 22:
The GS Prime book saw the largest $ net selling since Jan 27th (-1.5 SDs vs. the average daily net flow of the past year), driven by short sales outpacing long buys 5 to 1.
- US equities and to a lesser extent EM Asia were the most net sold regions driven by short sales, while Europe was the most net bought driven by long buys. Asia saw little net activity on the day.
US equities – Largest $ net selling since Jan 27th (-2.0 SDs) driven by short sales in Macro Products
- Macro Products (Index and ETF combined) saw the largest net selling since Jan 27th. Macro Products have been net sold in 9 of the past 10 trading days.
- ETF shorts increased +4.3% – the largest 1-day increase since November – driven by Large Cap, Technology, and Corporate Bond ETFs. ETF shorts have increased +9% week/week (+25% YTD) and now make up 21.4% of the non-Index US short book, the highest level on our record going back to 2012.
- Single Names were modestly net bought overall (+0.2 SDs) – Sector flows were split driven by net buying in Energy (long buys > short covers), Real Estate (short covers > long sales), Comm Svcs (long buys > short sales), and Health Care (long buys > short sales) vs. net selling in Info Tech (short sales > long buys), Materials (long sales), Financials (short sales > long sales), and Consumer Disc (long sales > short covers).
Energy stocks saw the largest 1-day net buying in more than two years (+5.8 SDs), while Info Tech was the most net sold sector, the $ net selling was relatively modest (-1.0 SDs) driven by short sales.
- FAAMG (GSTMTMEG) – Collectively the TMT Mega Caps were modestly net bought yesterday, driven by risk-off flows with short covers outpacing long sales 1.4 to 1. The group had been net sold for four straight days (8 of the past 10) coming into yesterday – aggregate long/short ratio (MV) of the group had declined -33% MTD to 14.6, which is in the 23rd percentile vs. the past year.
- Most net bought industries – Oil, Gas & Consumable Fuels, Entertainment, Specialty Retail, Road & Rail, REITs, Food & Staples Retailing, Media, Household Durables
- Most net sold industries – Interactive Media & Svcs, Software, Capital Markets, Internet & Direct Marketing Retail, Chemicals, IT Svcs, Hotels, Restaurants & Leisure, Food Products
Tyler Durden
Tue, 02/23/2021 – 13:20
via ZeroHedge News https://ift.tt/3snRoVI Tyler Durden