This Is The Capitulation “Trigger Line” For CTAs Shorting Treasuries
Many eyebrows were raised by yesterday’s sudden move in Treasurys when following stellar economic data, treasury yields… tumbled, a move one would expect if the data had missed across the board. Commenting on the scale of the move, Charlie McElligott notes that yesterday’s escalation rally in US duration (as measured by ZROZ 25+ Year Zero Coupon ETF as proxy) was the 3rd largest 1 day return since the Nov 4 week prior to election, “and acted to further accelerate the rather dramatic countertrend reversal seen MTD in Equities thematics/risk premia.”
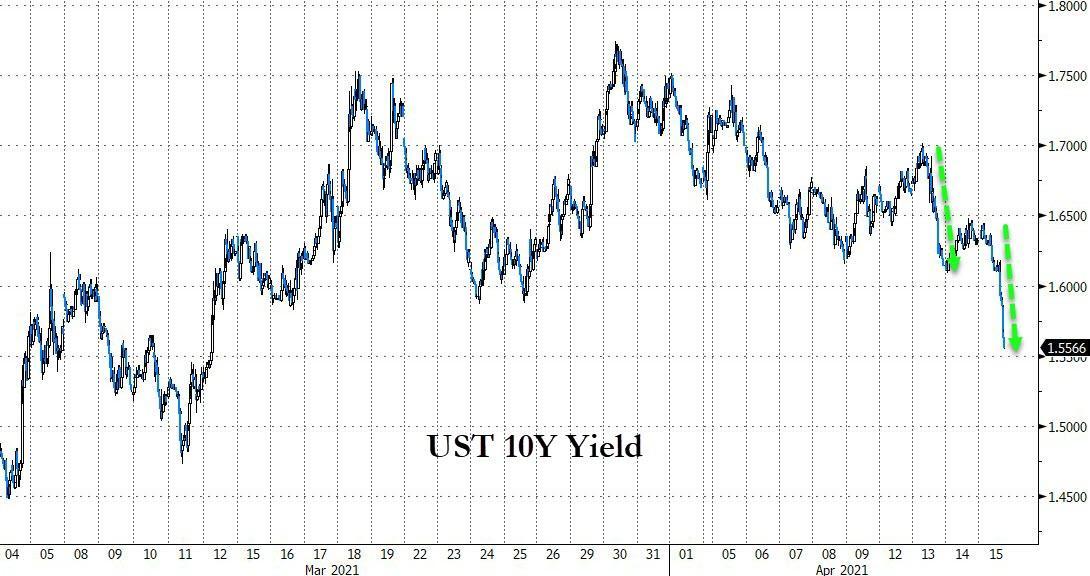
The explanation, which we first suggested and others piggybacked on, was aggressive short positioning heading into yesterday’s hot data – which perhaps wasn’t hot enough – and prompted a TSY short squeeze, or as Nomura’s Masanari Takada said, “short-term investors (global macro hedge funds, CTAs) have been conspicuously backing out of short positions in USTs.”
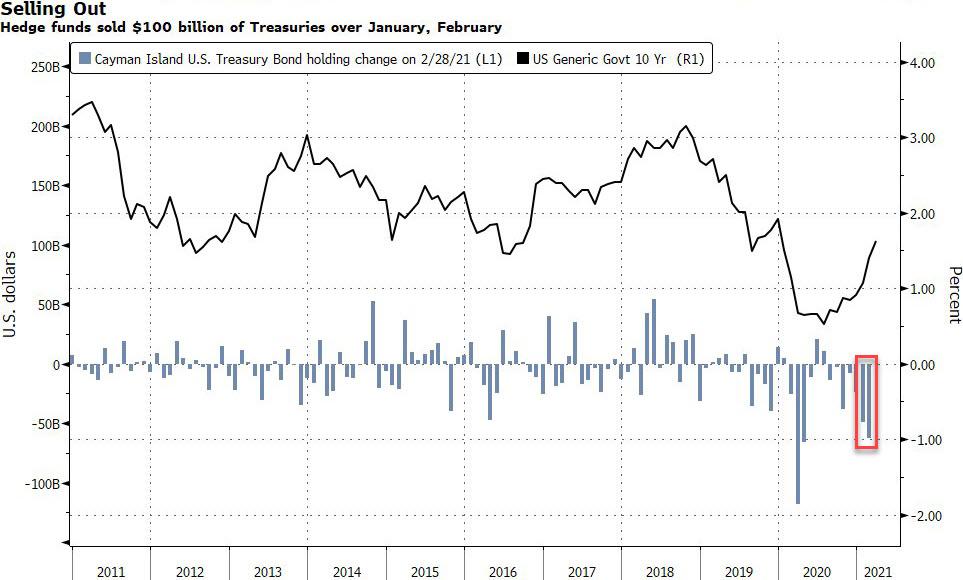
Speculation that leveraged (i.e. hedge) funds were positioned especially one-side, was reinforced by the latest TIC data, which showed a massive $100BN in securities sold by hedge funds – which in the TIC report are designated as the “Cayman Islands”, a financial center best known as a domicile for leveraged accounts – in the past two months as “Cayman” investors dumped $62 billion of US. paper in February, after selling $49 billion the previous month.
“Hedge funds overall were probably keenly involved in the rates move, but I don’t think they were alone,” said Richard Kelly, head of global strategy at Toronto-Dominion Bank. “The market broadly built up some decent short positions in a relatively short time.”
Today, in a post-mortem today, Nomura’s other quant, Charlie McElligott lists three potential catalysts behind the move – which also priced- out of an entire 25bps of rate hikes, where a short squeeze also emerges as the most likely culprit.
First, McElligott looks at the familiar April seasonality in Trasurys, which “is a known phenomenon”, and a large part of this current dynamic is the new Japanese FY commencing start April, where structural buyers of bonds are loading back into foreign fixed-income (particularly if on FX-hedged basis) after dumping in March; And indeed, Japanese MoF data shows the first full week of April as the largest 1w notional purchased of foreign bonds in 5 months @ $15.6B in aggregate.
Second, according tot he Nomura quant, there has been a domestic buy flow which matters, with the Nomura desk seeing
- 1) RM receiving in belly (big carry)
- 2) signs of pension de-risking/rebalancing into fixed-income out of Equities as they hit fresh multi-year “funded status” highs (see the enormous / record “stripping” activity in March, for example)
- 3) Bank portfolio buying of UST & MBS as loan growth remains “meh”
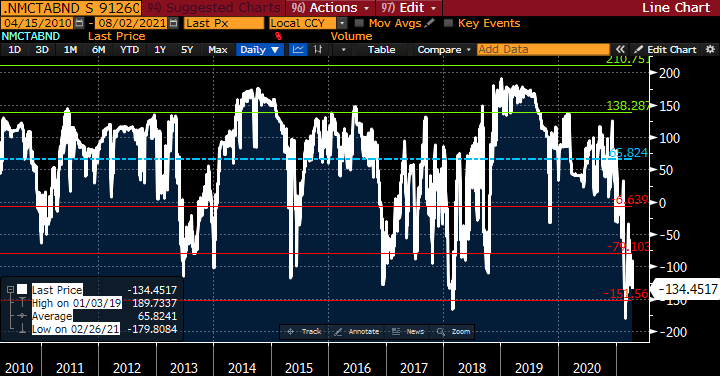
The third, and most likely reason behind yesterday’s outsized move, is simple short covering: as McElligott notes, a lot of this is “simply about stop-outs in profitable-yet-crowded shorts / steepeners—with particular focus on short-term trend CTA, where our analysis shows the aggregate notional $ “short” across our CTA model in G10 Bonds is -3SD dating back to 2010.“
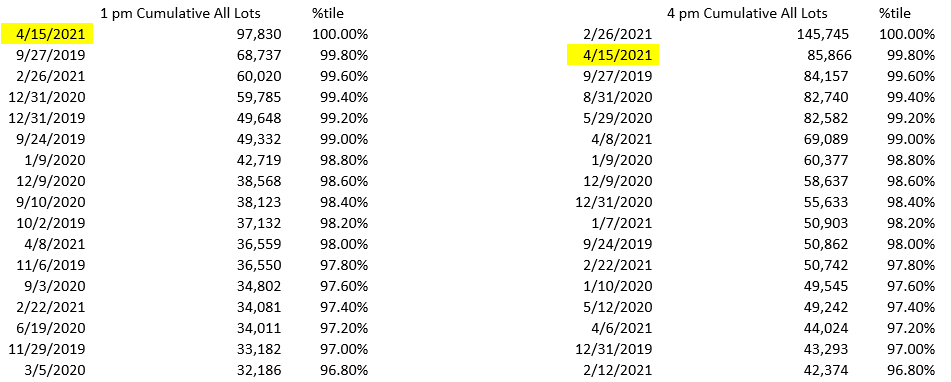
McElligott then notes that it is possible that the futures “imbalance” data in TY captured some of this short covering unwind/stop-out yesterday, with all lot size categories (but particularly “small lots” which is systematic fund proxy) were massively better to buy—by end of day Thursday, the cumulative 1d all lot imbalance “pressure” to buy was 99.7%ile since Aug of 2019 (start of our data history), and “where specifically, the cumulative 1d buy impulse up to 1pm was the largest aggregate contract “buy imbalance” we’ve ever seen (100th %ile).”
McElligott’s punchline is that “this recent bout of UST bull-flattening is largely a function of profit-taking and unwinds of crowded shorts and steepener positions, and as such, will likely see redeployment at “better levels” now that positioning is much cleaner…”
… as the sense is that the data overshoot and economic “escape velocity” into the peak of the YoY base-effect and vaccine implementation impact of data overshoot maxes out over the next few months again—which in-turn means 1) another pull-forward of pressure on the Fed to address “tapering” into Q4, in addition to 2) the potential now that the market’s focus could turn to EGB’s and the EU’s own “catch-up” trade as their own lagging “reflation awakening” could finally develop after their clumsy vaccine implementation “smooths” and the continent begins to reopen as catalysts for resumption of animal spirits in the inflation- and growth- overshoot next wave.
And while we agree that TSY shorts are just looking for the right “better level” at which to re-establish shorts, the inverse is also true and the lower yields drop, the more short covering will be observed.
But where?
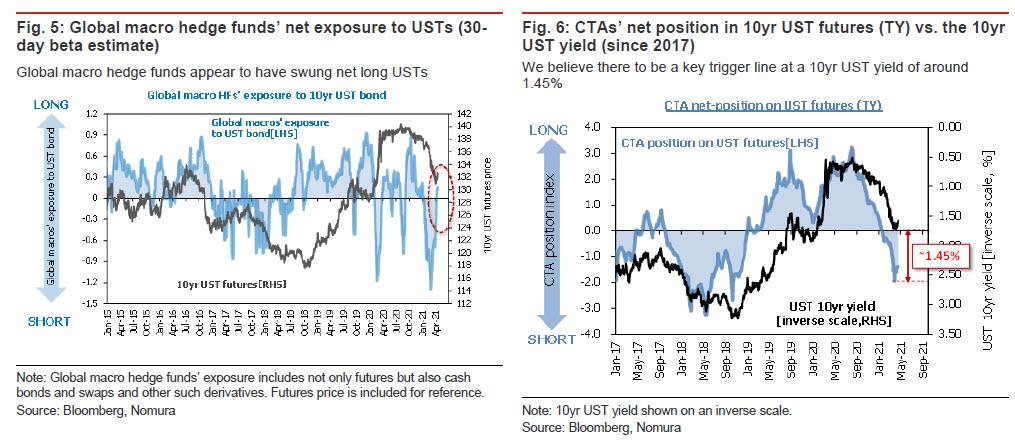
For the answer we gfo to the “other” Nomura quant, Masanari Takada who last week first noted that we are about to see a bout of short covering by CTAs, and who overnight writes that “the decline in the 10yr UST yield has been driven in part by shifts in supply and demand among speculative investors” and adds that by his estimates, global macro hedge funds got the ball rolling by covering short UST positions and then swinging net long (remember all those “Cayman” shorts noted above – don’t be surprised if next month’s TIC data shows a burst of Cayman buying).
As Takada further explains, “once the downtrend in prices for 10yr UST futures (TY) came to a halt, trend-following investors responded by putting themselves to the task of unwinding short positions.” Of course, speculators aren’t the only actors here (as McElligott noted above): longer-term investors (including Japanese investors) have also become buyers, with Japan’s Ministry of Finance revealing that Japanese investors were net buyers of foreign bonds by a margin of ¥1.7trn in the week of 4–10 April.
Which brings us to the $64 trillion question: what are the key levels for CTAs?
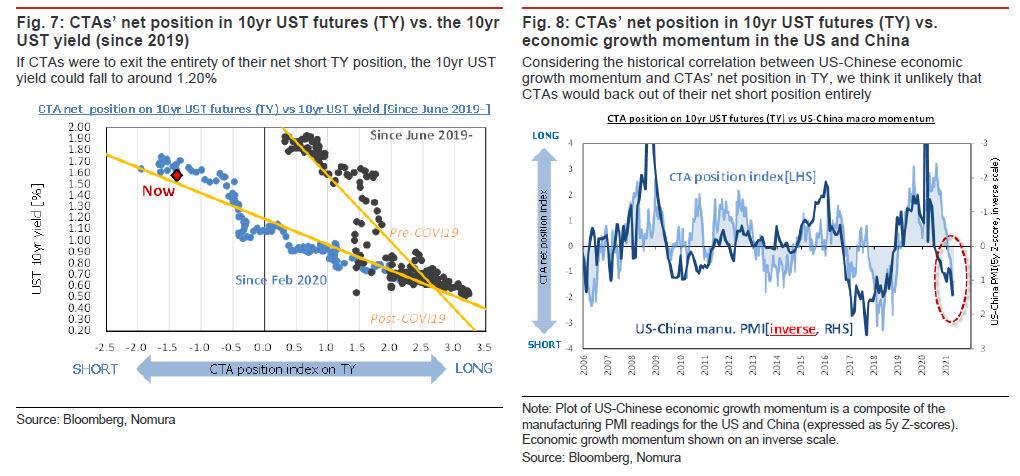
Nomura estimates that the two key trigger lines on the way down for 10yr UST yields lie at around 1.45% and 1.20%. According to the estimates output by the Japanese bank’s model, CTAs’ outstanding holdings of short positions in 10yr UST futures (TY) break even at around 1.45% on average.
This means that if the 10yr UST yield were to cleanly fall below this level, CTAs would be pressed into unwinding the remainder of their short futures positions, sparking even more buying. Should that happen, Takada writes, “the 10yr UST yield could very well make its way down towards 1.20%.” To put this another way, Nomura expects “CTAs to swing to the net long side in the market for UST futures (TY) if the 10yr yield were to fall below 1.20%” at which point a move back under 1% – purely on technicals of course, not at all on fundamentals – becomes distinctly possible.
All of this notwithstanding, Takada concedes that many market observers are still on the lookout for a rise in UST yields, given the strong expectations for normalization and reflation of the US economy. Indeed, as so many commentators have opined over the past 24 hours, there are probably a fair number of investors in standby mode waiting to sell the rally in USTs.
In any case, going by the present economic reality (as measured by economic growth momentum in the US and China), it seems unlikely that CTAs will actually exit their net short position in UST futures in its entirety. Accordingly, the Nomura quant sees the current short-covering by CTAs as mostly a short-term adjustment tuned to present market conditions “essentially a momentary position adjustment for purposes of profit-taking.” Ultimately, the CTA’s underlying stance on USTs is probably still bearish.
Tyler Durden
Fri, 04/16/2021 – 11:21
via ZeroHedge News https://ift.tt/3tpqHRp Tyler Durden