Why The Fed Is Dead Wrong On Inflation: Americans Have $3.5 Trillion In Savings For A Sunny Day
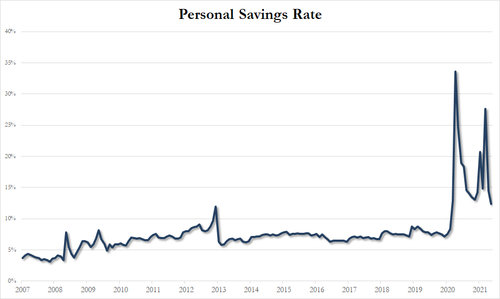
Even though the US personal savings rate has dropped substantially in recent months from its post-covid record high of 34%…
… when the US government unleashed the fiscal and monetary bazooka, it is certainly the case that there has been a very large surge in savings in the past 15 months, and as Bank of America economists write today, one of the biggest unknowns in the next few years is what happens to all the liquid savings that households have accumulated. The bank offers a new perspective on this question:
- The best measure of excess savings is the massive liquidity building up in bank accounts.
- Households are saving for a sunny day—the money remains in bank accounts because people want to spend it when they can.
- Expect a normalization of service spending, followed by a long period of unusually high spending.
But first things first: how much excess savings is there?
Bank of America answers this basic question by noting that there are three ways to measure the surge. The first is to identify specific government outlays that were likely mainly saved such as stimulus checks to healthy households. This approach comes up with some small numbers – less than a trillion dollars in windfall savings. This is the wrong approach, as one needs to look not only at direct deposits, but the indirect impact of stimulus dollars flooding the economy and at the fact that spending on services was constrained.
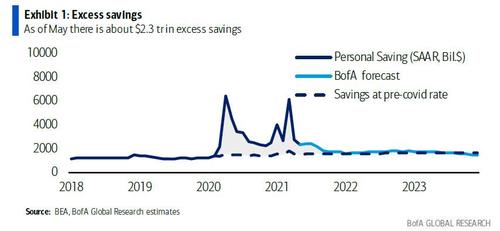
Thus a second approach is to compare actual savings each month relative to the normal 8% or so rate before the crisis (chart below).
By this metric, as of May there is about $2.3 trillion in excess savings. What is striking about this chart is that not only have there been surges in saving with the introduction of new stimulus packages, but savings have remained unusually high between packages. For example, in May- even services opening up and with the March stimulus fading – the saving rate was 12.4%. Clearly spending will likely need to increase further just to stop the excess saving (which in turn is a result of the continuing generous government handouts).
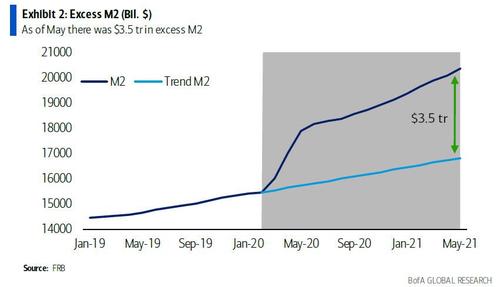
However, here BofA notes that it favors a third measure: the excess funds piling up in bank accounts. This metric compares actual M2 (checking, savings, money market funds etc.) to the historical trend in M2.
As shown in the chart above, as of May there was $3.5 trillion in excess M2 with the vast majority held by households. Why focus on this gauge? Because BofA thinks it shows how households are viewing the accumulated savings. They are simply leaving the money in the bank rather than redeploy the funds into a more illiquid form of savings. Or, as BofA economists put it, they are “saving for a sunny day,” keeping money handy to spend as the economy reopens.
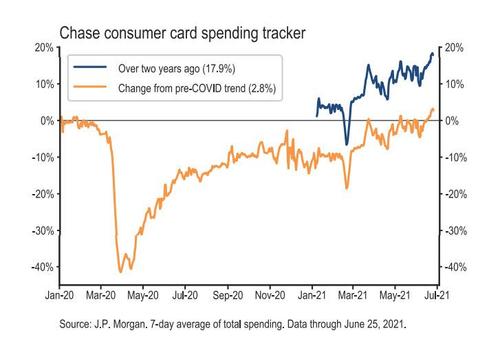
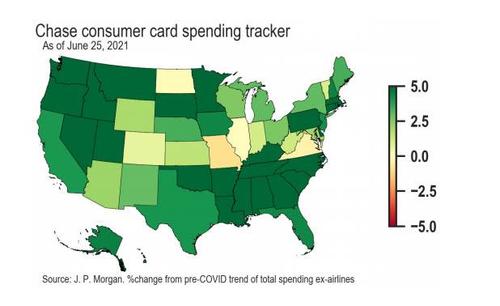
But what is most remarkable is that even as Americans are saving trillions, they are also spending like drunken sailors, and as the latest JPMorgan consumer credit and debit car spending data shows, spending is now up solidly compared not only up compared to the pre-covid trend, but is up almost 20% higher compared to the spending from two years ago (to avoid the post-covid base effect).
Curiously, the bulk of the excess spending comes from southern and North West states – maybe it’s for AC units?
What to make of this burst in spending?
Well, economists tend to pigeonhole consumer spending into two categories. First, “income” flows tend to trigger spending rates ranging from 100% for income-constrained households to say 70% for middle and upper income families as a group. Second, “wealth” is spent very slowly: the old rule of thumb was 4 cents on the dollar per year.
In Bank of America’s view, however, today’s excess liquid saving should be viewed differently: not as income or wealth, but as an ongoing source of funding to make up for lost time. It is impossible to make up the forgone restaurants, travel, recreation and so on quickly. However, what people can do is use this ready cash to first help restore normal spending and then fund an extended period of above-normal spending on discretionary consumption.
This is one of several areas where BofA also disagrees with the consensus – as the bank which predicted roaring inflation for the next 2 to 4 year elaborates, the reopening of the economy and the fiscal stimulus of the past year are not a “sugar high” that goes away quickly, but rather they will trigger a long period of high spending, and hence high inflation. Thus the Bloomberg consensus pegs consumption growth of 8.0%, 4.1% and 2.3% for 2021, 2022 and 2023 respectively. By contrast, Michelle Meyer and team see consumption growth of 8.8%, 5.1% and 2.8% over that period.
Even then the surge in excess saving is only partly reversed, which means that we may see 4% or 5% inflation well into 2024, which begs the question: how will the Fed’s credibility recover from such a catastrophic outcome when the central bank has once again staged its entire reputation on a “transitory” (read 1 year or less) period of inflation. We’ll find out in one year when the prices of all inflation-hedging financial assets are orders of magnitude higher…
Tyler Durden
Tue, 06/29/2021 – 15:17
via ZeroHedge News https://ift.tt/3dtR56F Tyler Durden
