The Fed Risks “Imploding The Highly Levered Global Financial System”
Submitted by QTR’s Fringe Finance
Friend of Fringe Finance Lawrence Lepard released his most recent investor letter a few days ago with his updated take the Fed, crypto, gold and macro.
Larry has joined me for several interviews over the last year and I believe him to truly be one of the muted voices that the investing community would be better off for considering. He’s the type of voice that gets little coverage in the mainstream media, which, in my opinion, makes him someone worth listening to twice as closely.
Larry was kind enough to allow me to share his most recent thoughts. Part 1 is below and Part 2 – which covers crypto, bitcoin and macro – can be read here.
Quarterly Overview
In the second quarter of 2022, the Fund declined considerably. Ironically, our small allocation to Bitcoin was only a minor drag on performance. While Gold bullion held up well, nearly the entire Gold/Silver mining sector was hit hard in the wake of the broad market sell-off. Many junior miners were down 50% in the quarter, and it felt like many investors were throwing in the towel.
The chart below shows the huge disconnect between Gold bullion and the gold miners. Notice that from 2000-2011, the miners outperformed gold; however, since the 2012 bear market, there has been a major gap between the two. Our belief is this has made the miners a deep value equity play.
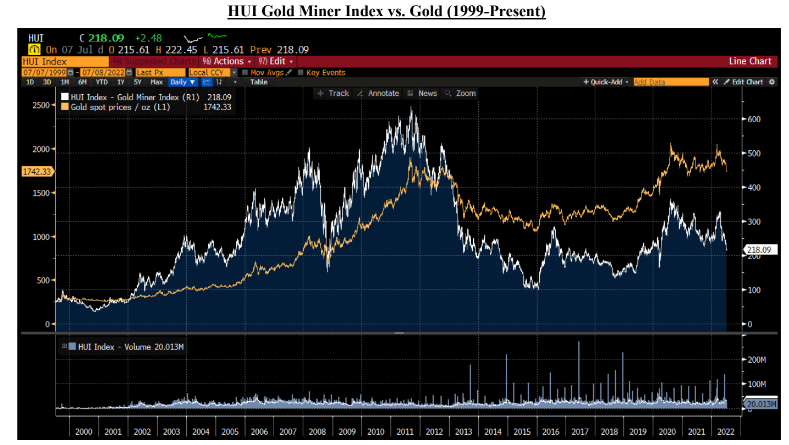
As Fred Hickey recently pointed out in his July newsletter:
“These massive gaps in performance make no sense unless one understands there are two completely different sets of buyers for these assets. The biggest buyers of gold (Chinese, Indians other Asians and Middle-Easterners) as well as central banks around the world buy gold, but not gold miners. North Americans account for a relatively tiny amount of the physical gold purchases, but they are the primary buyers of mining stocks.
Though it may not feel like it during this difficult quarter for gold mining stockholders, gold is in a bull market and has been since 2016 when it bottomed around $1,050. While gold has been strong since, the miners have lagged, likely still weighed down by memories of poor management decisions (overspending, overexpansion, and overpaying for acquisitions) toward the tail end of the prior gold bull market, which led to a collapse in the miners’ stock prices. Most of the management teams that made those bad decisions were replaced with a chastened group determined not to repeat those mistakes and whose focus is decidedly on shareholder returns. As a group, these management teams have remained disciplined for several years, but the market (north American buyers) has yet to recognize this.” –Fred Hickey, July 2022
We would add on to Fred’s comments: the draw down in gold stocks from 2011 to 2015 was brutal and fears of that linger in many gold stock investor’s minds. We call this “battered gold stock bull syndrome”. It too shall pass, and miners will react robustly to the upside when gold bullion price begins to sniff out the challenges faced by governments and central banks globally. Indeed, as MSA Research pointed out in this chart looking at Gold since 1980, and, in particular, the 2008 crisis’ impact on gold:

In Q2, the Fed raised the Federal Funds (FF) Rate by 50bps in May and 75bps in June and implied they will continue on this path until inflation subsides. The Fed’s music stopped and investors scrambled for seats as markets begin to price in a coming recession. Save for oil and some other commodities, there were no places to hide as can be seen by this chart showing % returns year to date.
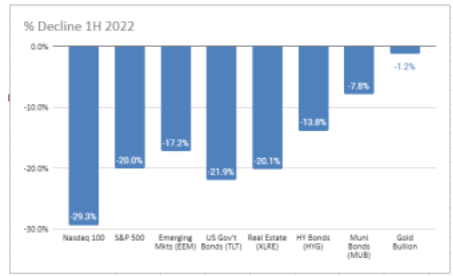
Down only 1.2% during the first half of the year, gold crushed the alternatives. We believe this is a foreshadowing of what is to come.
The DXY (US$) rose nearly 7% in Q2 as many companies sell assets/buy dollars to ensure a liquidity runway to pay their US$ denominated debts in a recession. In the US, inflation was persistent during the first half of 2022, and 10 Year Treasury yields increased from 2.33% to begin Q2 to a June high of 3.47%. 30 Year Mortgage rates nearly doubled from 3% to nearly 6%, and high yield credit spreads widened 200bps during this period.
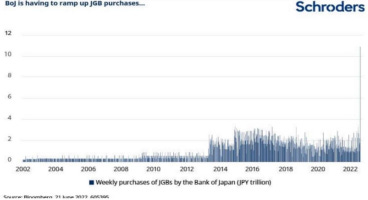
The real fireworks could be seen across the globe. Japan, which is conducting yield curve control (YCC), saw a large sell-off in its Government Bonds (JGBs) and the Bank of Japan (BoJ) was forced to print massive amounts of Yen to support the 0.25% interest rate peg on its 10 year JGB. This has caused the Yen to lose 24% of its value in dollar terms in the first half of this year. As the chart below shows, BoJ bond purchases in June spiked to unprecedented levels. Imagine every country with a chart like this if there is a global abandonment of government treasuries! Japan is practicing YCC. We believe it will be widely required everywhere before this is over.
Additionally, emerging markets are beginning to show signs of strain (see Argentina’s Credit Default Swap (CDS) chart on left below) and in Europe, Credit Suisse’s CDS has widened to near the 2008 levels (below right). To us these are early warning signals of the stress being created by the Fed’s new policy.
QTR’s Fringe Finance is a reader-supported publication. To receive new posts and support my work, consider becoming a free or paid subscriber: Subscribe now
Inflation
Throughout 2021, the Fed told us that the inflation we were experiencing was transitory and would subside as the COVID related supply issues were resolved. Many of us said this was not true and that inflation would be larger and more persistent than the Fed was projecting. This was not a tough call given the 41% increase in the money supply in the prior two-year time frame. The Fed now admits that they blew the call (again). Here are the monthly US CPI figures (% y-o-y):

So, how did we get here? The Fed opened the monetary floodgates in March of 2020. Through quantitative easing (QE), they grew their balance sheet from $4.2T to $8.9T in the space of 2 years. Initially there was little impact on reported inflation, and throughout 2020 the highest monthly inflation print was a 1.4% year over year rate. But this all began to change in 2021 as shown in the schedule above. Inflation began the year at 1.4% and exited the year at 7.0%. 2022 would prove worse.
Throughout 2021, the Fed held the Fed Funds (FF) rate at 0-25 basis points. Recognizing that the QE which began in March 2020 was probably part of the problem, they announced a reduction in the rate of QE in December 2021 and then an additional reduction in January 2022 with a complete stop of QE in March 2022. The past year will forever be known as the year when inflation became unhinged – to levels not seen in over 40 years. This represents a huge burden on the average American family.
The political impact of broad-based inflation and $5+ gas prices (nearly 100% above pre COVID levels) has all politicians and most citizens very angry and concerned. The Fed has been increasingly pressured to respond more aggressively to the inflation problem. In the second quarter of 2022, they did.
Hawkish Fed
Fed Chair Powell began warning of tighter financial conditions in late 2021 and early 2022. In their March meeting, the Fed enacted their first small rate increase taking the FF rate range to 0.25%-0.50%, up from 0-0.25%. They also signaled for additional rate increases and that the Fed intended to begin reducing its holdings of Treasury and Agency securities at a future meeting (quantitative tightening – QT). This was the first FF rate increase since December 2018 (over 3 years ago). It meant that stock and bond investors were now officially “fighting the Fed”, something that historically has been a mistake.
In their May 4th statement, the Fed again cited the causes of inflation as the war in the Ukraine, COVID supply issues and a tight labor market (no mention of QE or money printing) and they recommitted to getting inflation down to the target rate of 2%. They also took another step and raised the target Fed Funds rate to 0.75-1.00%, a jump of 50 basis points. Their announced QT plan is to reduce the balance sheet by $47.5B per month, but after three months this figure would become $95B per month. Theoretically, if they held to their reduction plan for a year, their balance sheet would shrink by $1.14T or 13% annually.
Recall that in 2017-2018, the last time the Fed tried to taper its balance sheet it was reducing it by $30B per month and they did not get far because the stock market plunged in Q4 2018 and the Overnight Repo Market blew out soon thereafter. These market reactions to tighter monetary conditions created the first Powell Pivot when they stopped tightening and ultimately resumed QE.
This QT program was set to begin on June 1, 2022. In theory, the Fed balance sheet should have shrunk by $47.5B in June; however, in actuality, its balance sheet only shrank by $1.5B in June 2022. It is possible that there are some accounting lags, but it is curious that they missed their first month target.
When the May 2022 CPI numbers came out hotter than expected at 8.6% year over year, there was a notable uptick in Fed anti-inflation hawkish rhetoric. In the June meeting, they aggressively went for a 75 basis point FF increase when earlier signals had only indicated 50 points. Now the FF rate is set at 1.50-1.75% and they said that they anticipated that ongoing increases in the target rate will be appropriate – including some hints that the July 27th Fed meeting could include a 100bps rate increase in light of the 9.1% June CPI print.
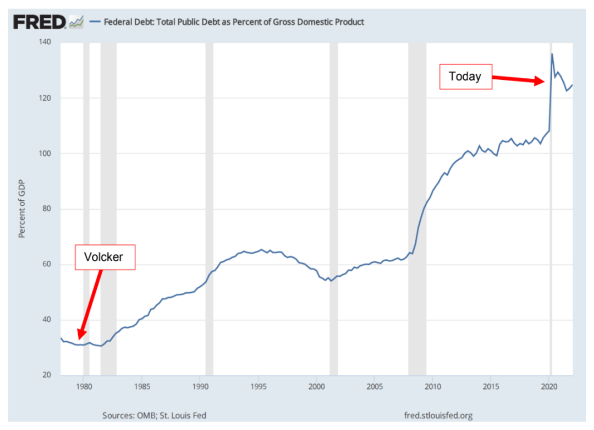
After 40 years of a cheap money/debt induced party, it is as though someone came in and turned on the lights and said: “go home”. The last time a Fed Chairman was this aggressive in his rhetoric and actions was Paul Volcker back in the late 1970’s and 1980 when he took the Fed Funds rate to over 20% to break the back of inflation. They have promised to “do whatever it takes” to prevent inflation expectations from becoming unanchored.
Yet the challenge for Powell is that conditions today are substantially different. As the chart below shows, Federal Debt to GDP is much higher today at 125% vs. only 30% in 1980. If the Fed is not careful, they could implode what is a highly levered global financial system.
“Powell’s belief that he still has a choice of being Volcker, instead of Arthur Burns, is the Fed Chair version of me thinking I can be LeBron James.”
– Luke Gromen, July 2022
The Everything Bubble Has Clearly Burst
When the history of this bubble is written, it will be noted that the Dow, the S&P and the Nasdaq all topped in the first week of January 2022. During the first quarter, all three indices declined modestly (Dow down 4.1%, S&P down 4.6%, NASDAQ down 8.9%). Some argued that this was just a correction in the bull market. Whether the bubble had burst was debatable.
Now at June 30, with the Dow down 14.4%, the S&P down 20.0% and the NASDAQ down 29.2% the picture is much clearer. When we add in the double digit decline in the bond markets, the blow up in the crypto space, softness in housing, it is clear to us that the 40-year debt fueled everything bubble has found its pin. The party is over. We are not going to return to the conditions which existed ex ante.
December of 2015 (7 years) creating enormous distortions in the pricing of capital assets. Free money distorts everything.
As we chronicled in prior reports, this bubble was extreme and surpassed the size and scope of both the Dotcom bubble of 2000 and the Housing bubble of 2008. The charts which follow show the magnitude:
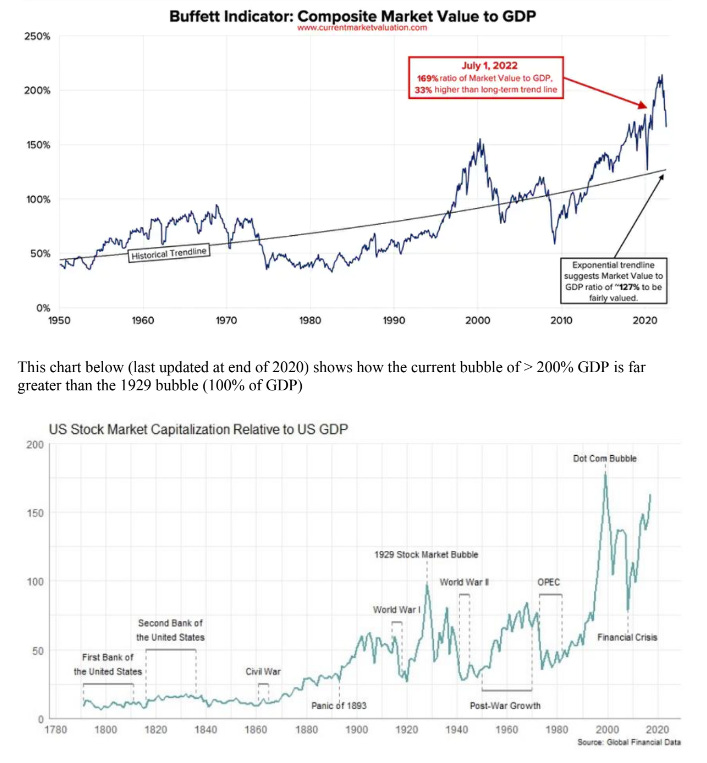
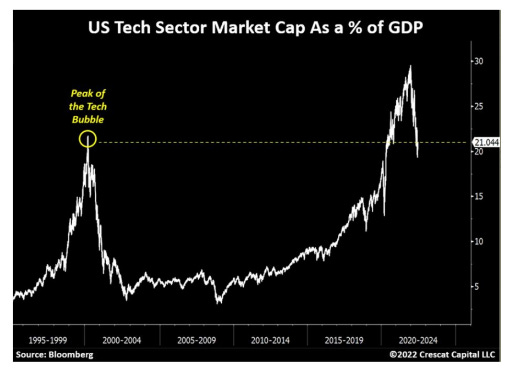
History shows that when bubbles burst, they do not just correct 20% and then stop. They tend to overshoot. In the Dotcom bubble of 2000 and the Housing bubble of 2008, the S&P 500 in each case lost over 50% of its value from top to bottom. This bubble exceeds the magnitude and breadth of those bubbles and we expect 50% downside to be a minimum target. In many ways, this bubble more closely resembles the stock bubble of 1929 in which case the DJIA lost almost 90% of its value.
The world is conditioned to expect low-cost money and a “Fed put” underneath the stock and bond markets. The Fed’s change in direction has come as a huge shock to many investors. In fact, many are still in denial about how hostile monetary conditions have become. Furthermore, we believe we are only in the early innings of this financial asset bear market and we expect much larger losses to come in any asset that appreciated based upon cheap money.
Note that Bloomberg and Jeffries believe that globally almost $35T of wealth has been destroyed in bonds and stocks, some 1.6x the US annual GDP of $21.5T. This occurred in the space of six months. At the beginning of the year in January most markets were at all time highs This is extremely deflationary and will result in a negative wealth effect.
Warren Buffet famously said that “when the tide goes out you find out who was swimming naked”. It certainly appears that the monetary tide is going out and now we are going to see who has a bathing suit. As the schedule below shows, traditional 60/40 stock/bond allocations have not worked as they were supposed to.
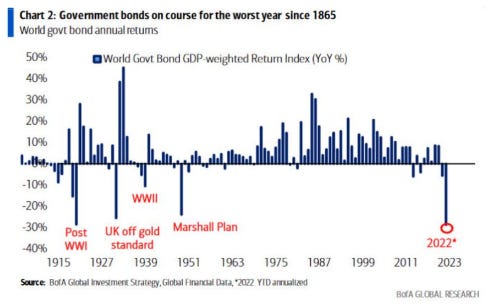
The theory is that when stocks are down bonds rally as a safe haven. With inflation at 40- year highs, and facing negative real yields, bonds have not been able to compensate for stock weakness.
About Larry Lepard
Larry manages the EMA GARP Fund, a Boston based investment management firm. Their strategy is focused on providing “Monetary Debasement Insurance”. He has 38 years experience and an MBA from Harvard Business School. On Twitter he is @LawrenceLepard Managing Partner and, via email, he is llepard@ema2.com
Disclaimer: QTR is long various gold and silver miners and have both long and short exposure to the market through equities and derivatives. I have no position in Larry’s funds. Larry is a subscriber to Fringe Finance and has been on my podcast. The excerpts from Larry’s letter, above, shall not be construed as an offer to sell, or the solicitation of an offer to sell, any securities or services. Any such offering may only be made at the time a qualified investor receives from EMA formal materials describing an offering plus related subscription documentation. There is no guarantee the Fund’s investment strategy will be successful. Investing involves risk, and an investment in the Fund could lose money. The strategy is also subject to the following risks: Currency Risk, Non-US Investment Risks, Issuer Specific Risk.
QTR’s Fringe Finance is a reader-supported publication. To receive new posts and support my work, consider becoming a free or paid subscriber: Subscribe now
Tyler Durden
Sat, 07/23/2022 – 13:30
via ZeroHedge News https://ift.tt/gsY8Uhf Tyler Durden