Markets In A World Of Pain As Most-Shorteds Squeeze Higher While TSY Curves Invert To Grotesque Levels
It was a wasted day in the market, one where stocks ground higher overnight and hit session highs just after the open, before a concerted wave of VWAP selling pushed stocks back to flat for the day…

… with tech shares hit the hardest as buybacks appeared to be oddly missing today…
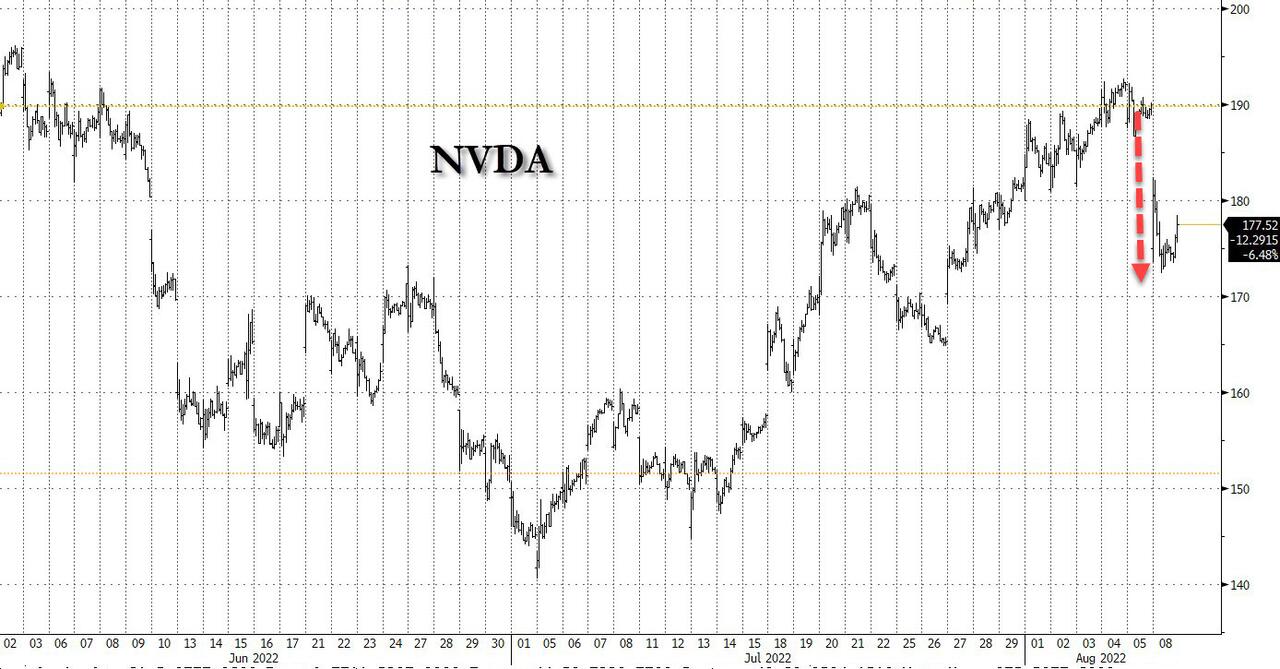
… while Nvidia’s unexpected earnings preannouncement and guidance cut which sent the stock 6.30% lower, its biggest one day drop since early June did not help…
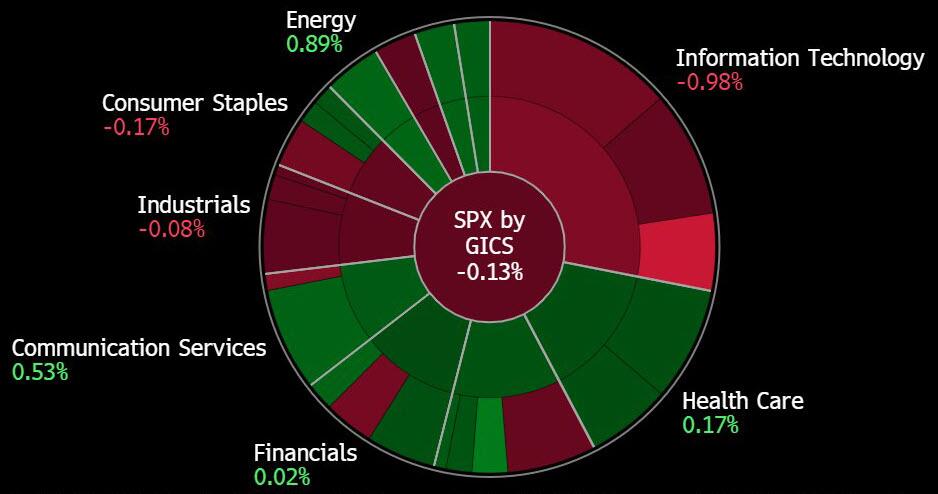
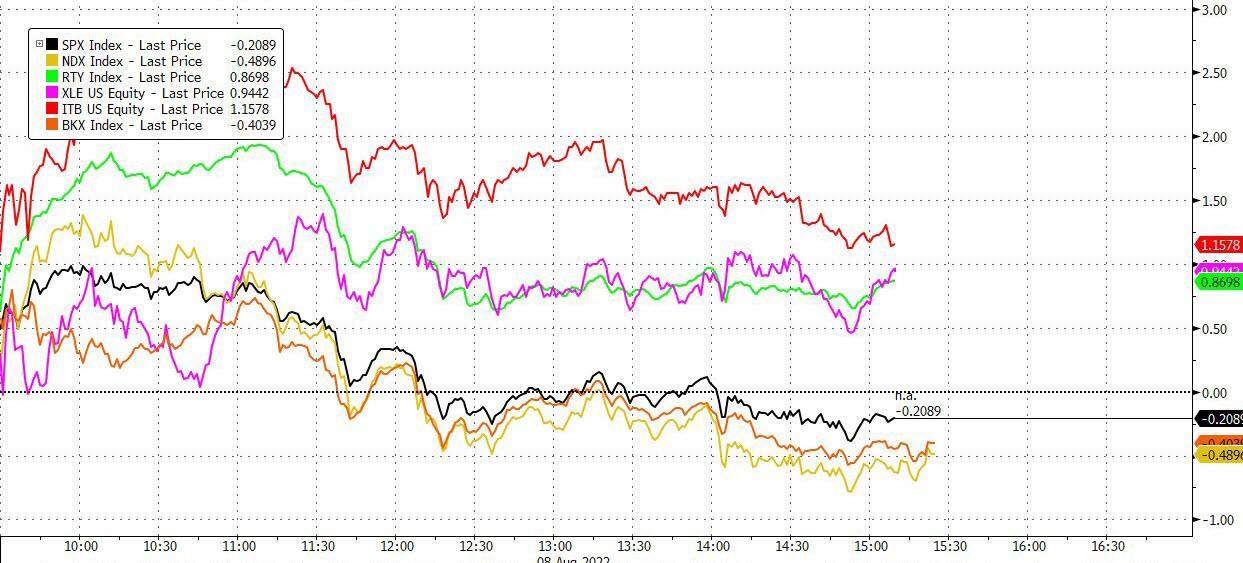
… as staples, industrial and banks also dropped while energy, homebuilders and small caps traded solidly in the green…
With another red hot (but far cooler than in recent months) CPI looming, bonds were anything but jittery as yields slumped all day led by the back end…
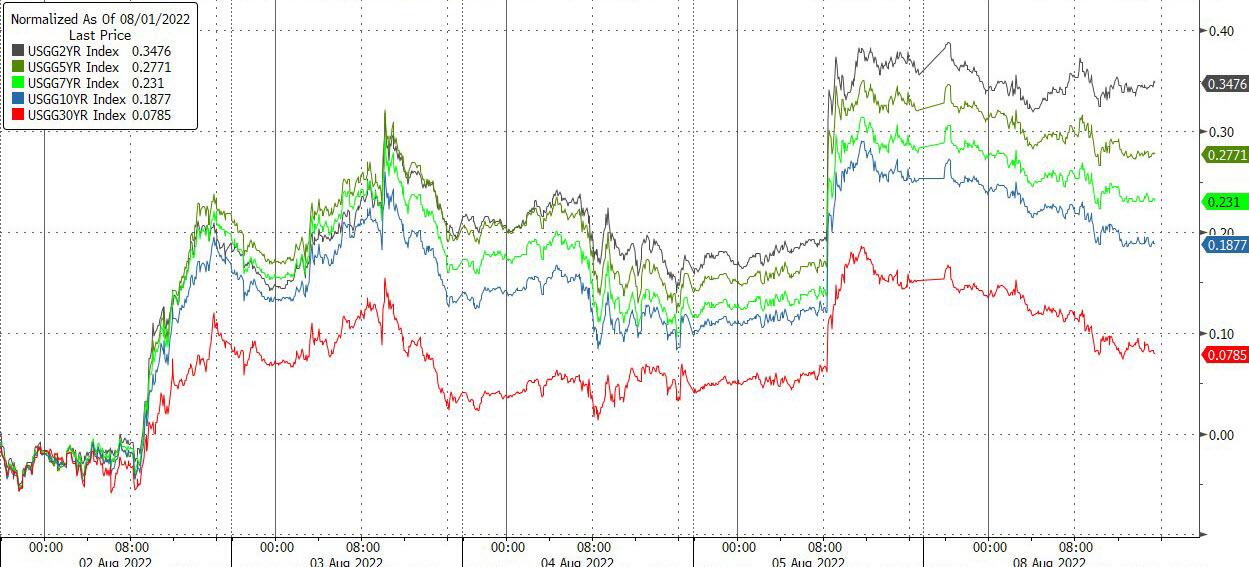
… and with the 2Y roughly unchanged, the 2s10s curve inverted to a mindblowing, grotesque 46bps, the biggest inversion since the year 2000, and set to blow that out of the water in the next few days as longer yields continue to sink:
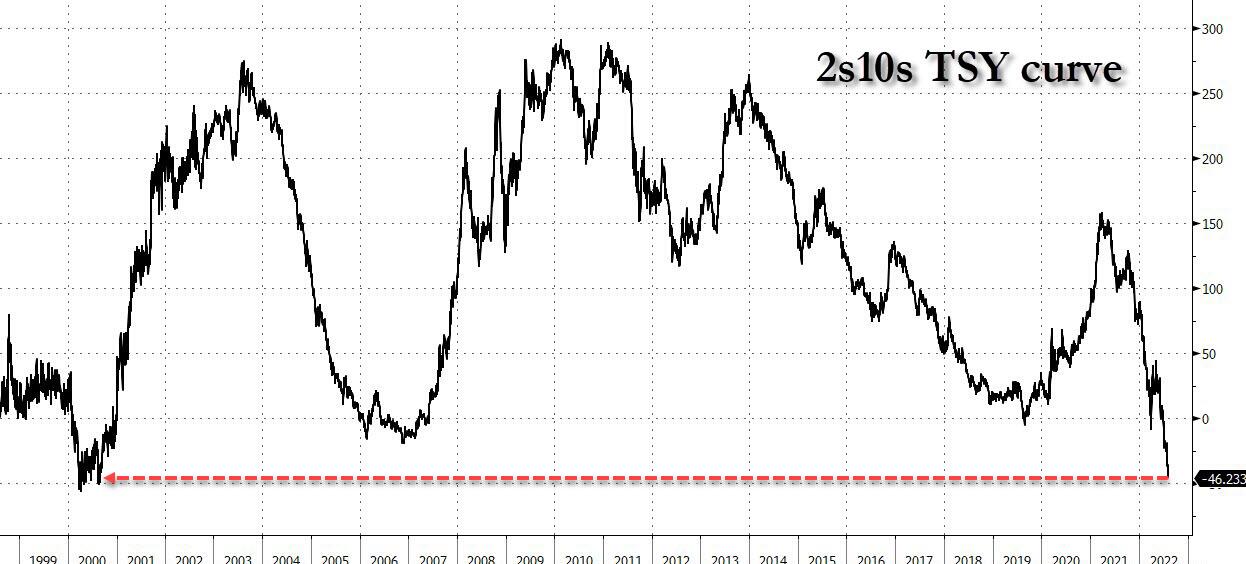
No wonder hedge funds managers remain extremely bearish – the bond market is screaming not just recession but maybe even depression.
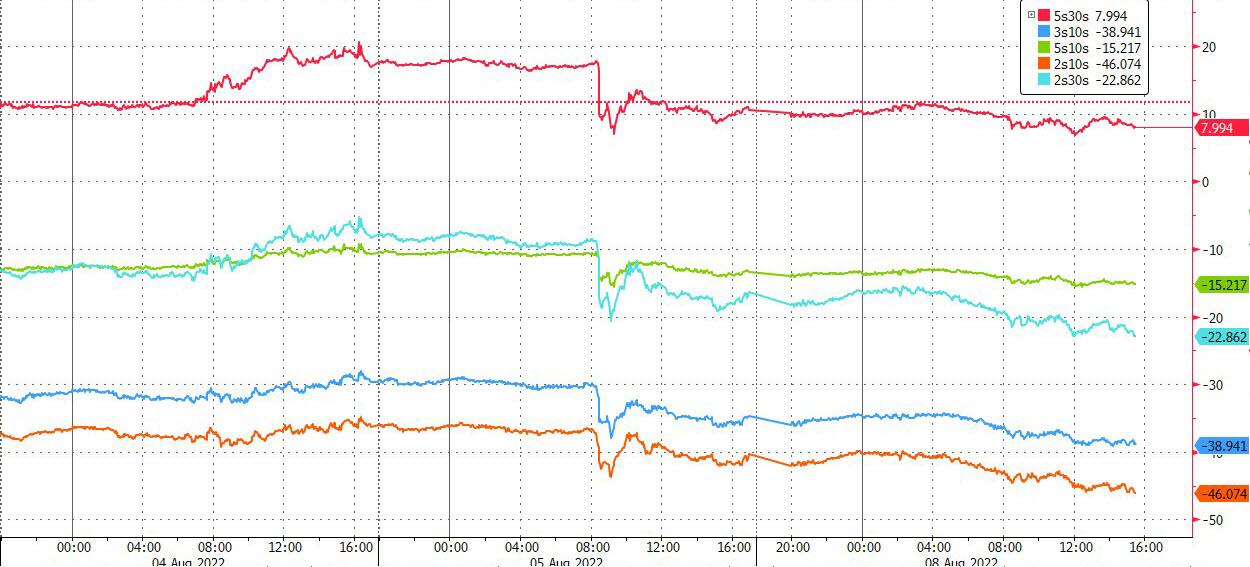
According to Bloomberg, unable to find traction in stocks, hedge funds have shifted to bonds and are engaged in various bets on more flattening in futures, namely 10-year versus ultra bonds and 2-year contracts against ultra 10-years, while mortgage portfolios managed by mutual funds have done it with 2s and 10s in cash Treasuries. Real money too has engaged in assorted bets the inversion will grow. Flatteners got the green light once again Friday after a huge beat on the July non-farm payroll report. The spread between 2s10s set lows of -44 bps Friday. That level has been surpassed today with an inversion to ~-45 bps. The next level to target is -50 bps, which is the size of the inversion last set in August 2000 based on a weekly chart.
The paradox of course, is that even as hedge funds turn increasingly more bearish in bond land, their stock shorts are getting blown out of the water on the back of the previously discussed buyback/CTA/retail bid, which today resulted in the 9th consecutive rise in Goldman’s most shorted tech name basket (BBG ticker SCBMSIT), matching the longest such stretch on record.
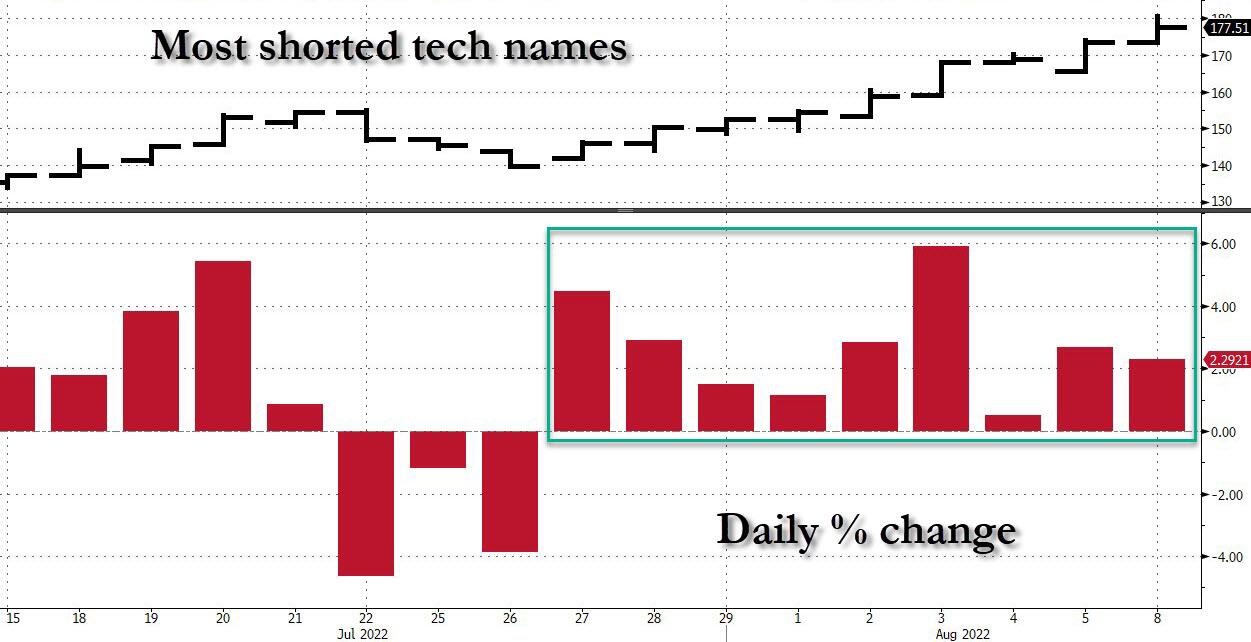
The market-wide short squeezes also meant that retail investors have woken from their hibernation slumber and are once again raging and sparking short squeezes, such as those seen today in BBBY, AMC and Gamestop, all of which are sharply higher on the back of powerful squeeze-driven rallies.

What is odd is that the squeeze-driven meltup comes at a time when the market is resetting its expectations of near-term rate cuts by the Fed (we doubt this will last long, especially after a miss in the next CPI report and a long-overdue collapse in the August payrolls) with STIR traders now pricing in just 5bps of rate cuts in Q1 2023 down sharply from a full rate cut as recently as two weeks ago…
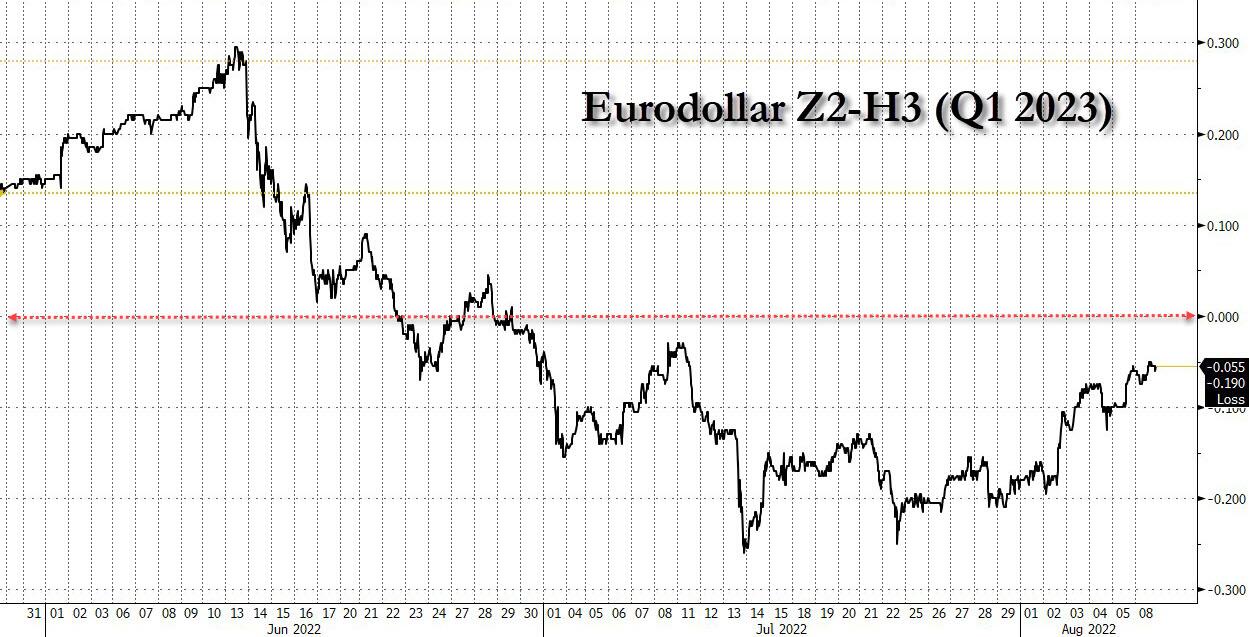
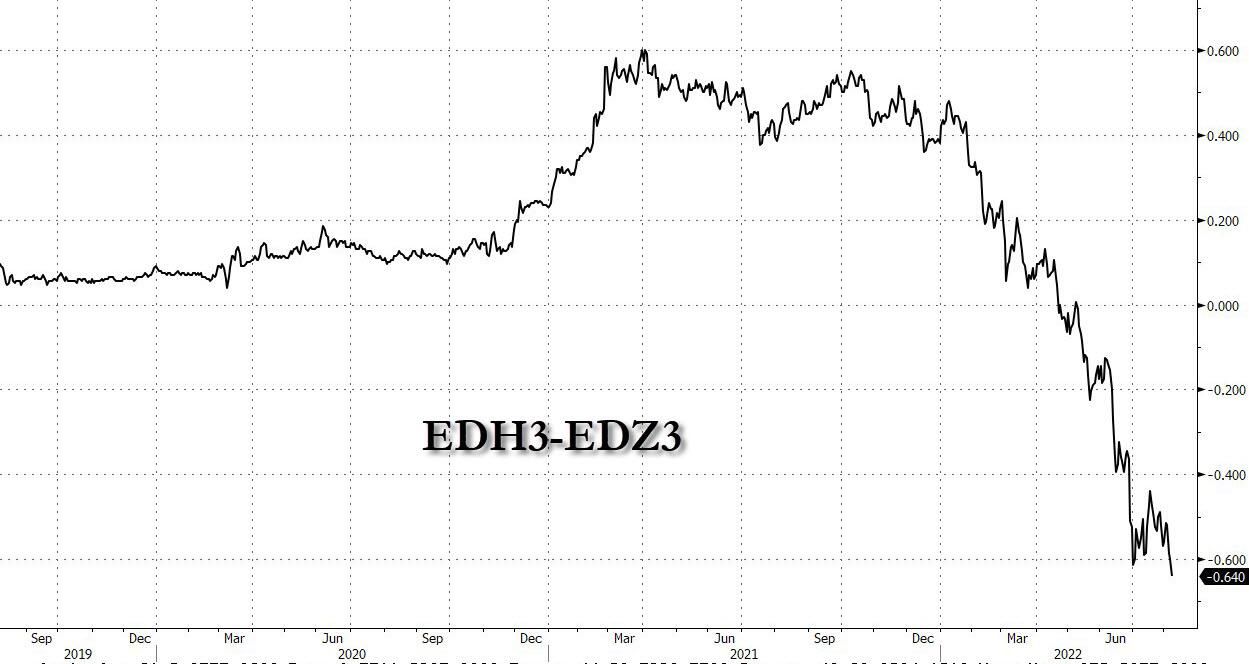
… however, far from winning the hawkish argument, the Fed’s day of capitulation is merely being extended, and as Charlie McElligott writes today, “the nuanced dynamic which remains clear is this: the market continues to believe that the longer the FOMC stays on this course to a higher terminal rate and runs “restrictive for longer,” that it will later then lead to higher odds of a harder slowdown thereafter” which is why the next important calendar phase, or EDH3-EDZ3 i.e., Mar23-Dec23, actually sits at its most inverted level yet, implying ~64bps of Fed cuts thereafter—aka “more hiking / more restrictive now, bigger cutting / easing later!
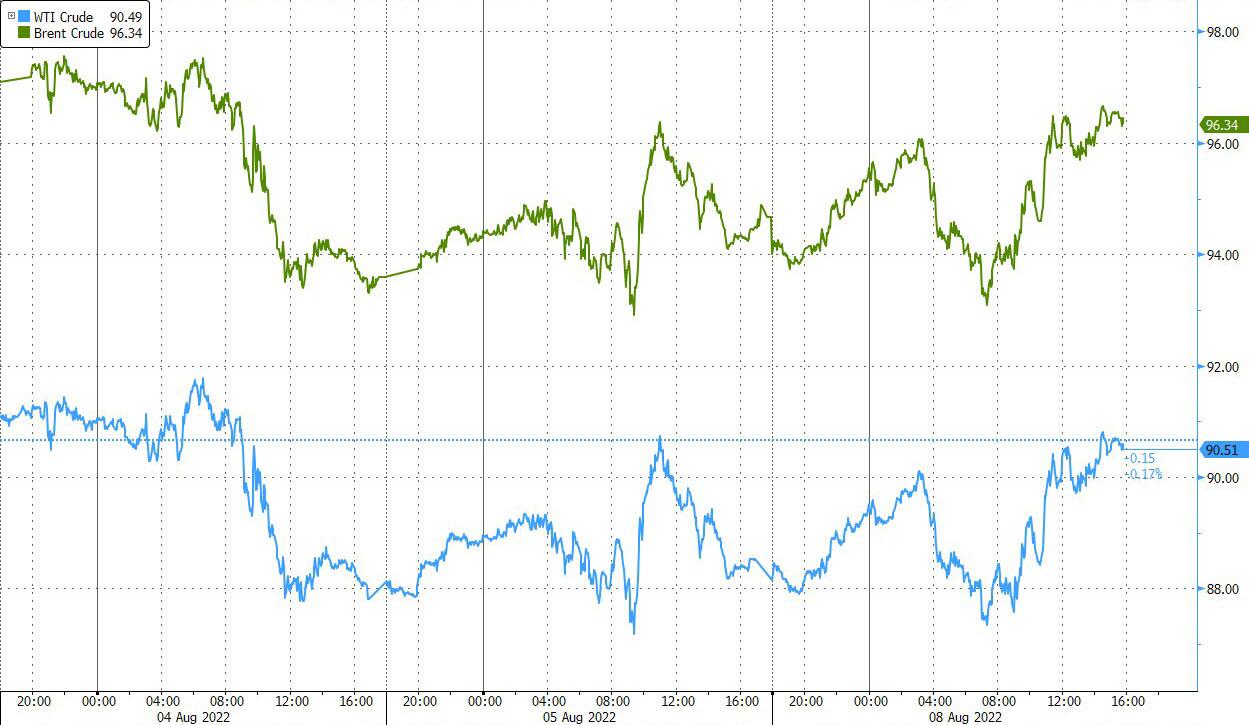
These growing odds that the Fed will have to pivot eventually are likely behind today’s rally in oil prices…
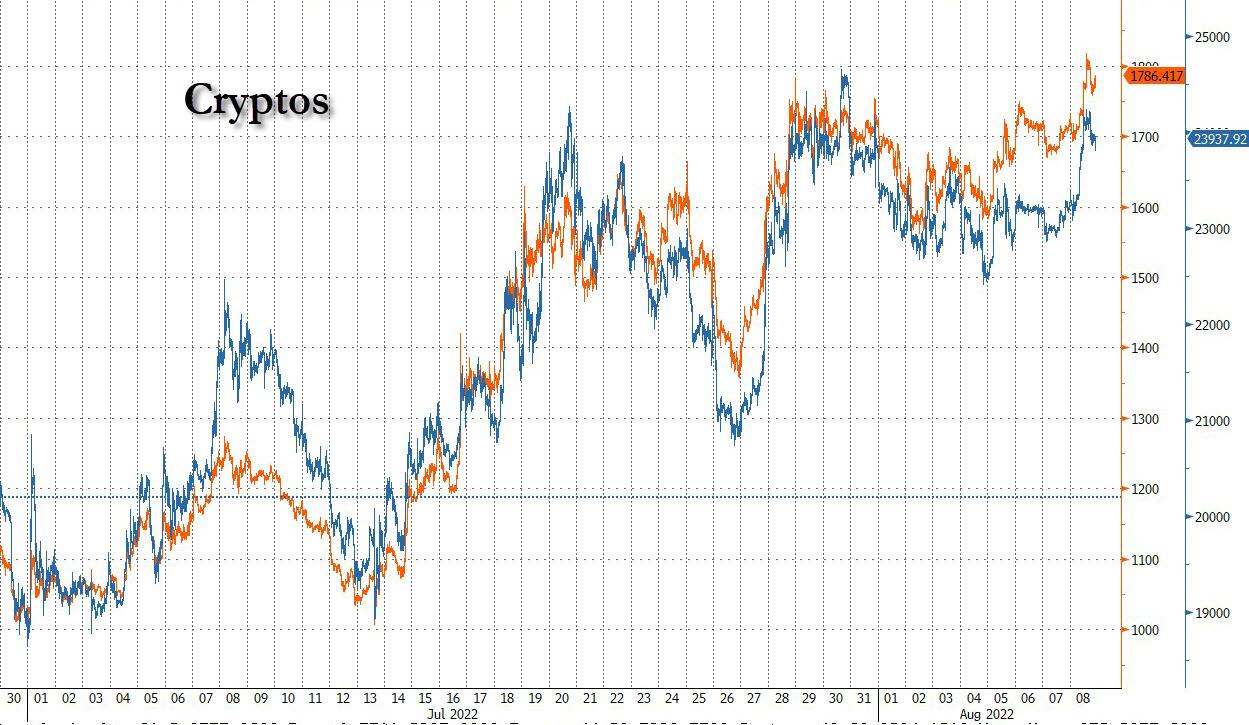
… as well as the jump in cryptos to multi-week highs (much more coming with the ETH merge looming).
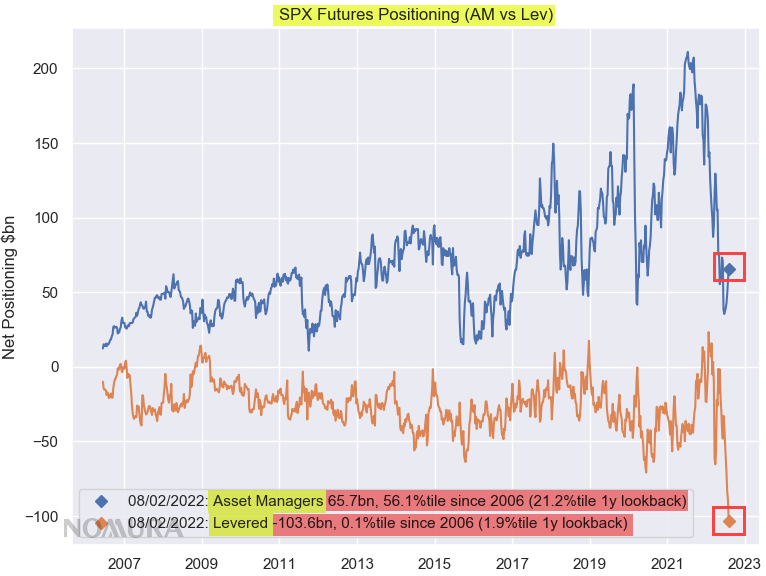
Meanwhile positioning – as we have covered all weekend long – continues to trade extremely, extremely short as hedge funds hope and pray that the inevitable flush that will trigger the Fed’s rate cuts comes before the relentless meltup forces them to cover their shorts!
As Nomura notes, the bearish masses were so grossly underpositioned for a rally after anticipating an earnings wipeout and “cleanse lower” which did not materialize, perversely thanks to the magnitude of just how low those “negative revisions” expectations were—and accordingly, the pain-trade has been “higher”
So with this idea that 1) prices are beginning to contract, that 2) inflation expectations are softening thereafter, and that 3) current labor strength and 4) consumer balance sheet allows for 5) “more rope” to digest this forward state of accumulated / lagged “tightening into restriction”, Nomura’s McElligott says that it all then puts us much close to the actual slowdown and “dovish Fed pivot” that will then merit the aforementioned “even larger easing” thereafter.
And as all this happens, the relentless buying from systematics keeps lifting the overall tide: similar to Goldman, Nomura estimates that CTA Trend have bought +$60.1B of Global Equities futures in aggregate over the past 1m period on almost entirely “short covering” flows, and now showing an aggregate “Net Long” across the 13 Global equity futures futs positions since the peak of the last large “bear market rally” into start of June—including nascent “+19% Long” signals across all 3 US Equities positions

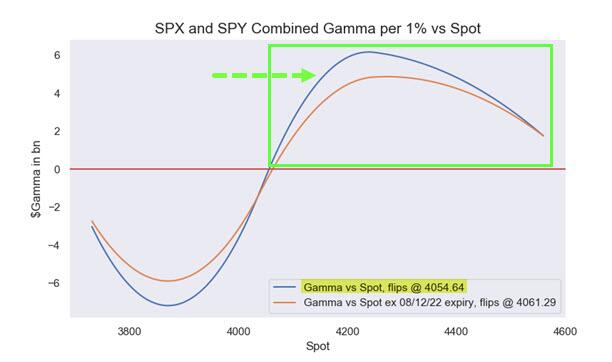
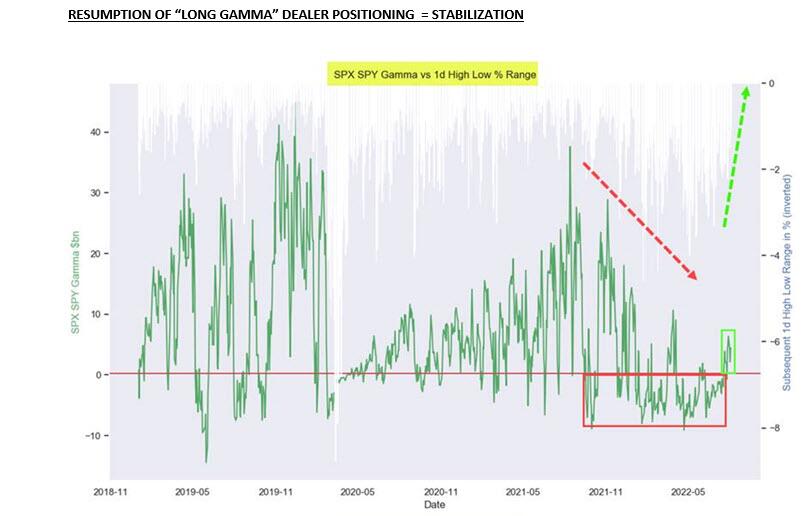
Finally, adding to the bears’ pain, “Positive Delta” flows are also ripping stocks higher and further leaning into implied Volatility, which has added a ton of Gamma to Dealers who had been “Short,” but are now instead in “Long Gamma vs Spot” territory for all 3 US Equities indices, further insulating the market’s range from large price swings (“Long Gamma” = sell highs, buy lows = MM’s and Dealers as liquidity “MAKERS,” not TAKERS)
Tyler Durden
Mon, 08/08/2022 – 16:08
via ZeroHedge News https://ift.tt/pZ6MvXT Tyler Durden