“Yes, The Market Is Categorically Unfun And Ugly” – What JPMorgan’s Traders Think Happens Next
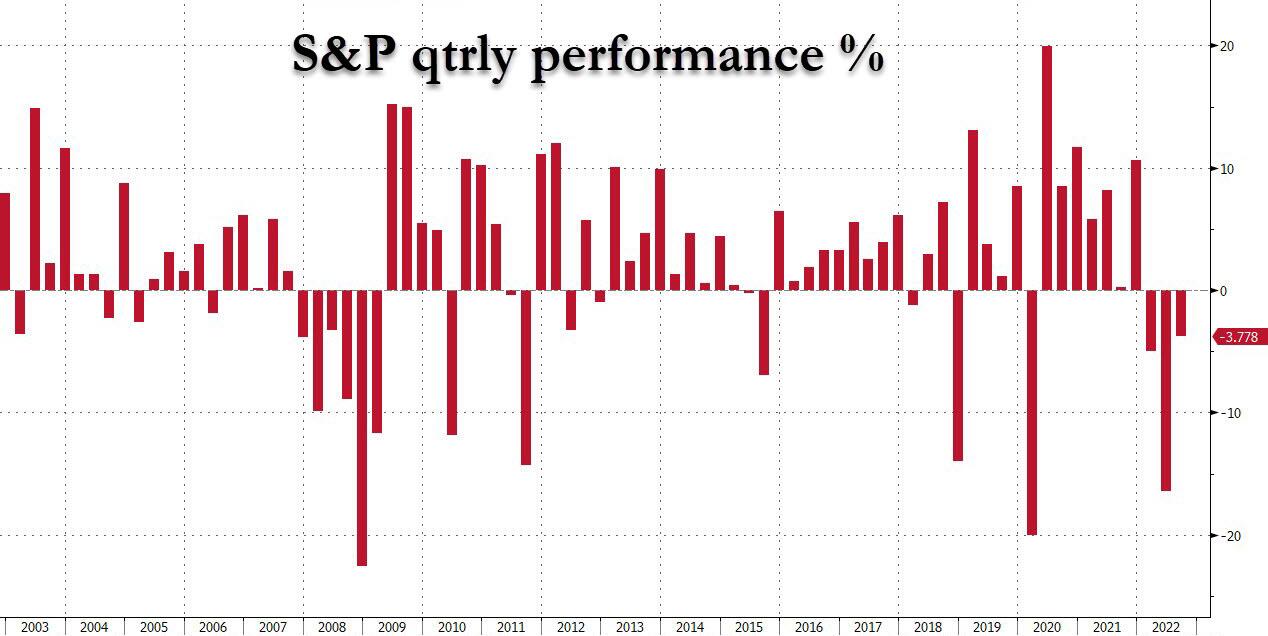
Today is the last day of Q3 2022, and so far this quarter, the S&P is down 25% from its all time highs, and down 15% from its peak of the summer rally, it is also set for a -3.8% quarterly loss – the third negative quarter in a row – the longest such stretch since 2008.
“So where we go from here?” That’s the question JPMorgan market intelligence trader Andrew Tyler asks this morning, and to answer it he quotes from a handful of JPM strategists and traders. We start with the JPM trading desk:
Ronald Alder (TMT)
Yes, the market is categorically unfun and ugly. Equities remain at the mercy of eco data and the bond market. Economic data remains solid (PCE, Jobs, etc.) albeit backwards looking and, in concert with the fed commentary, won’t allow for the market to be constructive just yet (even as high frequency data points to lower inflation). Yesterday’s Long-Only buyers in TMT (primarily the megacaps) are notably absent or more passive, while see more defensive buying in Telco, etc. AAPL breaking is making things a bit precarious for everyone and everything. The desk is 1.3:1 better for sale now with volumes down in the HSD% range. It’s early, but conversations continue to skew bearish with the challenge to find the bullish narrative. I still think the risk-reward is fairly balanced here at 3600-3700.
- The tape remains very choppy and macro driven. ETF volumes are currently in the high-30%s (and were >40% this am). Liquidity in S&P futures is ok while Treasuries (and from what I hear in the bond market) remains abysmal. The strength in the MOVE Index and the sustained VIX Index levels have led to risk management challenges (which typically leads to de-risking) and broad frustration. It’s hard to fight the Fed commentary (and CBs more broadly) + hot global macro data. It remains The Fed Funds ceiling – which was a tailwind for the past two days – has crept back up today to ~4.53%.
- We have been consolidating for a little while this am 3620-3650. Our supply is drying up a bit (we are now 1.2:1 better to buy on the desk) and there’s a lot of hope (again, per [@Jack Johnston] perhaps not the best strategy – but sometimes you must work with what you have) that we could rally post the European close
Brian Heavey (Consumer)
NKE: Overall the print is mixed; the top-line is very strong (NA nearly doubled our estimate at 10% FXN vs. St. 4.5%, EMEA in-line and sequential improvement in China). EPS beat JPM and missed Street by a penny (.93 vs. St. .94 and JPMe .87). Higher tax rate hurt EPS by 5 cents – so revenues and operational EPS beat vs Street. The GM was down ~220bps which offset the revenue beat and is tied to the inventory clearing actions NKE has been undertaking (recall Boss has been previewing this has seasonal inventory has being cleared). We will guide on the call which will be the main driver of the stock (as well as information on inventory clearance).
- The desk was very active yesterday w/ primarily LO demand in discretionary and supply in Staples (i.e. much more “risk on” in nature). Client activity is down substantially today as the daily volatility remains paralyzing.
- I think the magnitude of the KMX miss shows just how much downside remains in SPX earnings estimates. Yes, I think expectations were low, but KMX embodies all of the issues facing the market right now: Weakening consumer demand, higher SG&A (primarily Labor), and difficulty in forecasting given a rapidly changing macro environment. This follows an EPS cut from VFC yesterday, and while a lot of VFC’s issues are company and brand specific, it was another data point that the $230 EPS estimate for the SPX that even the bulls are clinging to is probably too high.
- It’s not all bad today… we are finally seeing the DXY stop making new highs. I think if we can move the USD into a downtrend it will provide some relief to EPS estimates (especially in the more FX sensitive staples names). Today’s move lower is immaterial in the context of the last few weeks rip, but something to watch going forward
Stuart Humphrey (TMT)
MU | Bad Q, worse guide. Q4 revs in at $6.64B vs STe at $6.73B and JPMe at $6.56B (we lowered estimates into the print) with Q1 guide well below as revs for Q1 to be $4.25B at midpt vs STe of $5.71B came in well below expectations – GMs down below 30%, likely cutting utilization. Double ordering and supply chains are easing. Stock might be down more prob if not for positioning and the 50% capex cut vs last year.
Then we move on to the JPM strategists and economists:
Nikolaos Panigirtzoglou (strategist)
Nikolaos reminds us that cash allocation for non-bank investors has risen sharply this year due to simultaneous decline in both equities and bonds, and “a backdrop of high cash allocation may provide backstop for both equities and bonds likely limiting any further downside from here.” JPM still feels like a bear rally would be difficult to launch without a better CPI print to boost the market sentiment. As we are closer to Q3 earnings, a better-than-expected earnings and companies outlooks may also trigger a rally, but the margin shrinking and FX risks are still the biggest unknowns. More bullets from his note below:
Following this year’s unprecedented rise in bond yields, we find that non-bank investors globally have erased 14 years of previous bond overweights and lowered their allocation to bonds to only 17% currently, even below the pre-Lehman crisis average of 18%.
We see two main implications from this low bond allocation. First, going forward a sustained bull market in equities could require a bull market in bonds. Second, the pressure on multi asset investors to sell equities to offset the mechanical increase in their equity allocations stemming from bond price declines has diminished.
Outside any interplay between equity and bond allocations, a backdrop of high cash allocations provides in our opinion a backstop to both equities and bonds, likely limiting any further downside from here.
BoE calms concerns over collateral calls for now.
Revenue has declined for ethereum block makers post merge, yet the staking yield has increased
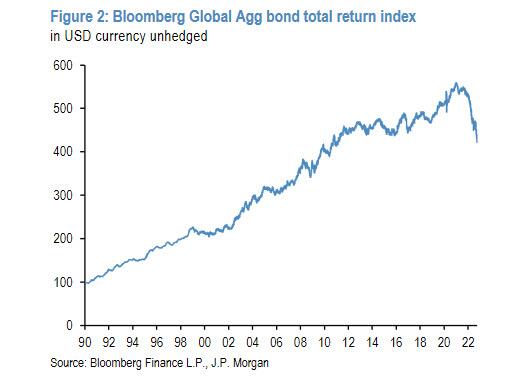
This year’s rise in bond yields is of historic proportions. The 250bp YTD rise in the Global Agg bond index yield that took place in a period of nine months, represents the steepest and largest rise in the history of the index, exceeding the bond yield rise of 1994. What is even more unprecedented is the decline in the return of the Global Agg bond index on a currency unhedged basis. Effectively more than a decade of previous returns has been unwound in a period of only nine months.
Similar to previous large bond selloffs, this year’s bond selloff has been taking place against a backdrop of very low liquidity. This is shown in Figure 3, which shows that, for most of this year, the market depth for USTs has been even lower than that seen in March 2020 at the peak of the pandemic crisis.
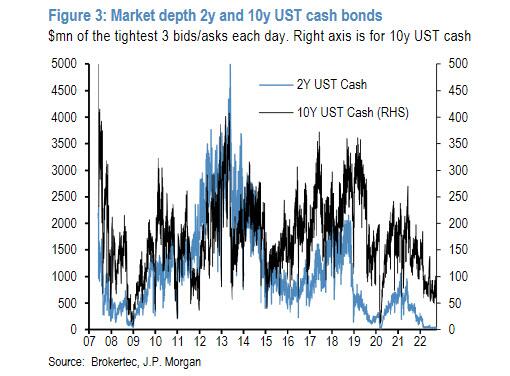
In other words, at the current juncture of very low market depth and elevated rate volatility one is feeding the other in an intense way: as rate volatility rises bond market makers step back from their market making role and raise bid offer spreads inducing low market depth and lower liquidity, which in turns creates even more rate volatility.
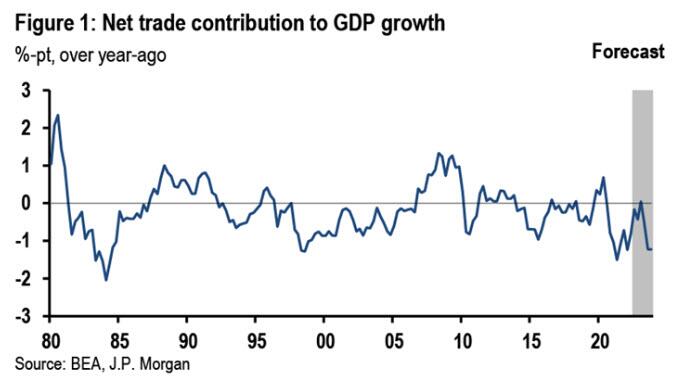
Michael Feroli (economist, discussing net trade)
So far the factory sector has held up well in the face of a surging dollar. But that’s unlikely to last, as lagged exchange rate effects and a European recession hit exporters. We expect net trade will subtract a little more than 1%-pt from GDP growth in ‘23.
Fans of Kung Fu movies will be familiar with the delayed touch of death: a lethal blow whose effects are only realized after the passage of time. The closest equivalent among the various monetary transmission channels has to be the exchange rate channel. Whereas some financial conditions (e.g., mortgage rates) manifest themselves in the economy in a matter of months, historically it can take several quarters for the effect of moves in the exchange rate to play out in export and import growth.
In this note we discuss what these lags—combined with the recent strength of the dollar— imply for the outlook for trade and manufacturing next year. Layered on top of the dollar appreciation is a looming recession in the Eurozone, one of the US’s largest trading partners. We also discuss why the lags from the dollar to trade may be even longer than usual now, and that when the dollar effects do hit they may hit with even more force than usual. All in, we think trade could subtract more than a percentage point from GDP growth next year, with more drag to come in ’24.
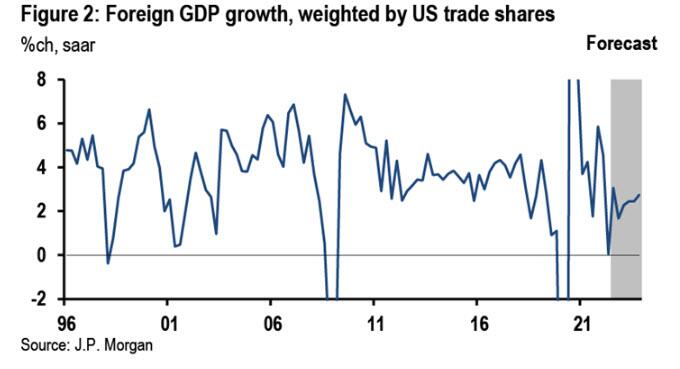
Trade models are pretty simple, as far as economic models go. Demand for exports is determined by foreign income (GDP) and by the relative price of domestically-produced goods, i.e., the real exchange rate. Demand for imports is similarly a function of domestic income and the real exchange rate. Looking at the first of these, foreign income, Europe – both the Eurozone and other Europe—accounts for about a quarter of exports and appears to be heading into recession.
More generally, the J.P. Morgan forecast for our trading partners next year looks for one of the slowest growth years outside of global recessions (Figure 2).
The other main driver of US trade performance is the real, trade-weighted dollar. The real exchange weight is the nominal exchange weight adjusted for the price level differential between countries. Since various price indices can be used, there are various real exchange rates. The J.P. Morgan real dollar indices are up between 13% and 18% since the beginning of the year. Taking the average, and using our estimated trade elasticities, over time this should reduce the level of GDP—through both lower exports and more domestic demand shifted to imports—by over 1.5%-pts.
Tyler Durden
Fri, 09/30/2022 – 12:40
via ZeroHedge News https://ift.tt/c0jtO6v Tyler Durden