Signs of a Top

The primary drivers of asset prices are the economy and corporate earnings. With that in mind, consider that both are rolling over today.


Indeed, when we take the big picture, we find that corporate profits, as a percentage of GDP are also at all-time highs. Never before in history have corporations made so much money relative to the US economy. This trend is not likely to continue.


Finally, take a look at the massive divergence between nominal GDP and the S&P 500. Economic growth drives earnings, which in turn drive stocks. And as you can see, economic growth has been drifting sharply lower.


Source: the King Report


Detailing precisely when stocks will plunge is very difficult. All we can say with great certainty is that stocks are rallying ever higher on weakening economic fundamentals. This is precisely what happened in the build up to the 2008 Crash.


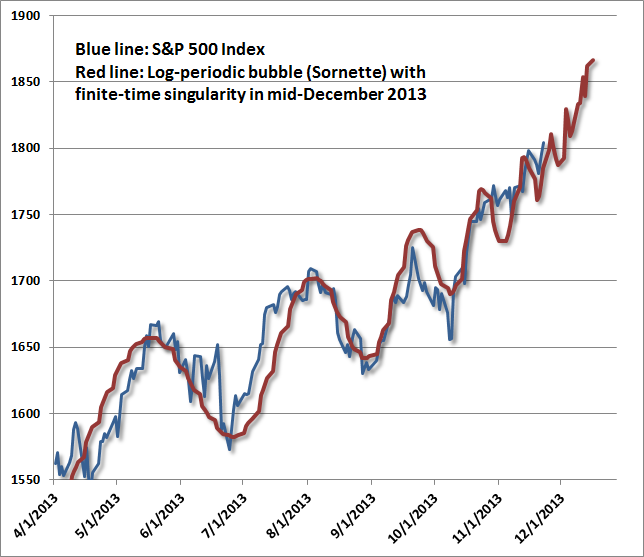
Indeed, if is now clear stocks are definitively in a bubble. Based simply on CAPE (cyclical adjusted price to earnings) the market is significantly overvalued with a reading of nearly 24 (anything over 15 is overvalued).


Indeed, we’ve only been at this level of valuation during major stock tops (1929, 1966, 2000, and 2007)


Thus we find that:


1)   The US economy is in recession again

2)   Corporate profits are at record highs and set to fall

3)   Stocks are extremely overvalued


All of these add up to a real problem for long-term stock investors today. The classic method of valuing stocks, the P/E ratio is comprised of market cap relative to earnings.


If earnings are at record highs today and stocks are already overvalued, how high will P/Es be when earnings begin to contract with stocks at these levels?


My point with all of this is that based on valuations and economic conditions, now is not the time to be loading up on stocks. There will be plenty of opportunities such as NVDA and NDRO which we’ve already invested in, but overall, I would not be heavily buying stocks at these levels especially relative to earnings.


Speaking of earnings, let us now move to #2 on the list of items I listed at the opening of this issue: the recent collapse in revenues and earnings at economically sensitive firms.


We’ve seen a recent spate of terrible results from corporate America.


In the few quarters we’ve seen disappointing earnings at:


1)   Caterpillar (global machinery)

2)   Microsoft (software)

3)   Google (search engine ad revenue)

4)   Chevron and Exxon Mobil (oil)

5)   Discovery (credit cards)

6)   Amazon (online retail)

7)   Charles Schwab (brokers)

8)   Wynn Resorts (casino)


There are dozens and I literally mean dozens of ways to craft earnings to be better than reality. You can writedown assets, alter depreciation methods, manipulate bad debt expenses in accounts receivables, game the closure of deals, take one time charges, utilize derivatives and mark to model valuation of assets, etc.


Indeed, a study performed by Duke University found that roughly 20% of publicly traded firms manipulate their earnings to make them appear better than they really are. The folks who were surveyed for this study about this practice were the actual CFOs at the firms themselves.


In this sense, it is safe to assume that recent earnings, as poor, are they are, have been “massaged” to look better than reality.


Indeed, we get confirmation of this from revenues misses. As I mentioned a moment ago, earnings can manipulated any number of ways, but revenues cannot; either money came in or not.


With that in mind, we’ve in the last few quarters we’ve seen revenues misses at:


1)   Merck (big pharma)

2)   Molson Coors (alcohol)

3)   Clorox (cleaning materials)

4)   US Steel (steel)

5)   McDonald’s (fast food)

6)   3M (conglomerate)

7)   GE (conglomerate)


This brings me back to an earlier point, that profits and earnings are likely peaking. All of these point to a top forming.


Be prepared.


For a FREE Special Report on how to beat the market both during bull market and bear market runs, visit us at:

http://phoenixcapitalmarketing.com/special-reports.html


Best Regards


Phoenix Capital Research


via Zero Hedge http://feedproxy.google.com/~r/zerohedge/feed/~3/RJlrbAj2q4M/story01.htm Phoenix Capital Research

Marc Faber: "We Are In A Gigantic Speculative Bubble"

We have to be careful of these kind of exponentially rising markets,” chides Marc Faber, adding that he “sees no value in stocks.” Fearful of shorting, however, because “the bubble in all asset prices” can keep going due to the printing of money by world central banks, Faber explains to a blind Steve Liesman the difference between over-valuation and bubbles (as we noted here), warning that “future return expectations from stocks are now very low.”


Nope no bubble here…

Along with this pattern…


which has emerged with striking fidelity since 2010, we observe a variety of other features typically associated with dangerous extremes:

  • unusually rich valuations on a wide variety of metrics that actually have a reliable correlation with subsequent market returns; margin debt at the highest level in history and representing 2.2% of GDP (eclipsed only briefly at the 2000 and 2007 market extremes);
  • a blistering pace of initial public offerings – back to volumes last seen at the 2000 peak – featuring “shooters” that double on the first day of issue;
  • confidence in the narrative that “this time is different” (in this case, the presumption of a fail-safe speculative backstop or “put option” from the Federal Reserve); lopsided bullish sentiment as the number of bearish advisors has plunged to just 15% and bulls rush to one side of the boat;
  • record issuance of covenant-lite debt in the leveraged loan market (which is now spreading to Europe);
  • and a well-defined syndrome of “overvalued, overbought, overbullish, rising-yield” conditions that has appeared exclusively at speculative market peaks – including (exhaustively) 1929, 1972, 1987, 2000, 2007, 2011 (before a market loss of nearly 20% that was truncated by investor faith in a new round of monetary easing), and at three points in 2013: February, May, and today (see A Textbook Pre-Crash Bubble).

Many of us in the financial world know these to be classic features of speculative peaks, but there is career risk in responding to them, so even those who view the situation with revulsion can’t seem to tear themselves away.

While I have no belief that markets follow any mathematical trajectory, the log-periodic pattern is interesting because it coincides with a kind of “signature” of increasing speculative urgency, seen in other market bubbles across history. The chart above spans the period from 2010 to the present. What’s equally unsettling is that this speculative behavior is beginning to appear “fractal” – that is, self-similar at diminishing time-scales. The chart below spans from April 2013 to the present. On this shorter time-scale, Sornette’s “finite time singularity” pulls a bit closer – to December 2013 rather than January 2014, but the fidelity to this pattern is almost creepy. The point of this exercise is emphatically not to lay out an explicit time path for prices, but rather to demonstrate the pattern of increasingly urgent speculation – the willingness to aggressively buy every dip in prices – that the Federal Reserve has provoked.


via Zero Hedge http://feedproxy.google.com/~r/zerohedge/feed/~3/OSP_hGzqYsU/story01.htm Tyler Durden

Marc Faber: “We Are In A Gigantic Speculative Bubble”

We have to be careful of these kind of exponentially rising markets,” chides Marc Faber, adding that he “sees no value in stocks.” Fearful of shorting, however, because “the bubble in all asset prices” can keep going due to the printing of money by world central banks, Faber explains to a blind Steve Liesman the difference between over-valuation and bubbles (as we noted here), warning that “future return expectations from stocks are now very low.”


Nope no bubble here…

Along with this pattern…


which has emerged with striking fidelity since 2010, we observe a variety of other features typically associated with dangerous extremes:

  • unusually rich valuations on a wide variety of metrics that actually have a reliable correlation with subsequent market returns; margin debt at the highest level in history and representing 2.2% of GDP (eclipsed only briefly at the 2000 and 2007 market extremes);
  • a blistering pace of initial public offerings – back to volumes last seen at the 2000 peak – featuring “shooters” that double on the first day of issue;
  • confidence in the narrative that “this time is different” (in this case, the presumption of a fail-safe speculative backstop or “put option” from the Federal Reserve); lopsided bullish sentiment as the number of bearish advisors has plunged to just 15% and bulls rush to one side of the boat;
  • record issuance of covenant-lite debt in the leveraged loan market (which is now spreading to Europe);
  • and a well-defined syndrome of “overvalued, overbought, overbullish, rising-yield” conditions that has appeared exclusively at speculative market peaks – including (exhaustively) 1929, 1972, 1987, 2000, 2007, 2011 (before a market loss of nearly 20% that was truncated by investor faith in a new round of monetary easing), and at three points in 2013: February, May, and today (see A Textbook Pre-Crash Bubble).

Many of us in the financial world know these to be classic features of speculative peaks, but there is career risk in responding to them, so even those who view the situation with revulsion can’t seem to tear themselves away.

While I have no belief that markets follow any mathematical trajectory, the log-periodic pattern is interesting because it coincides with a kind of “signature” of increasing speculative urgency, seen in other market bubbles across history. The chart above spans the period from 2010 to the present. What’s equally unsettling is that this speculative behavior is beginning to appear “fractal” – that is, self-similar at diminishing time-scales. The chart below spans from April 2013 to the present. On this shorter time-scale, Sornette’s “finite time singularity” pulls a bit closer – to December 2013 rather than January 2014, but the fidelity to this pattern is almost creepy. The point of this exercise is emphatically not to lay out an explicit time path for prices, but rather to demonstrate the pattern of increasingly urgent speculation – the willingness to aggressively buy every dip in prices – that the Federal Reserve has provoked.


via Zero Hedge http://feedproxy.google.com/~r/zerohedge/feed/~3/OSP_hGzqYsU/story01.htm Tyler Durden

Guest Post: Inflation, Shortages, And Social Democracy In Venezuela

Submitted by Matt McCaffrey via the Ludwig von Mises Institute,

The economic turmoil in Venezuela has received increasing international media attention over the past few months. In September, the toilet paper shortage (which followed food shortages and electricity blackouts) resulted in the “temporary occupation” of the Paper Manufacturing Company, as armed troops were sent to ensure the “fair distribution” of available stocks. Similar action occurred a few days ago against electronics stores: President Nicolás Maduro accused electronics vendors of price-gouging, and jailed them with the warning that “this is just the start of what I’m going to do to protect the Venezuelan people.”

Earlier this month, in another attempt to ensure “happiness for all people,” Maduro began to hand out Christmas bonuses, in preparation for the coming elections in December. But political campaigning is not the only reason for the government’s open-handedness. The annual inflation rate in Venezuela has been rapidly rising in recent months, and has now reached a staggering 54 percent (not accounting for possible under-estimations). Although not yet officially in hyperinflation, monetary expansion is pushing Venezuela toward the brink.

In such an environment, paychecks need to be distributed quickly, before prices have time to rise; hence, early bonuses. This kind of policy is nothing new in economic history: Venezuela’s hyperinflationary episode is unfolding in much the same way Germany’s did nearly a century ago.

Consequently, Venezuela’s economic policy is proving to be another example of Ludwig von Mises’s argument that economic intervention, if left unchecked, leads to complete socialism. The ever-expanding price controls testify to the fact that governments always search for new scapegoats in the market instead of admitting the failure of their own policies, and that it is always easier to increase government control than reduce it.

Maduro clearly knows the ropes when it comes to anti-market propaganda; like his predecessor, Hugo Chávez, he has placed blame for soaring prices on speculators and the “parasitic bourgeoisie.” But no witch-hunt for “price-gougers” will stop the eventual collapse of the economy that will result from further monetary expansion combined with crippling price controls. Inevitably, as Mises argued, “once public opinion is convinced that the increase in the quantity of money will continue and never come to an end, and that consequently the prices of all commodities and services will not cease to rise, everybody becomes eager to buy as much as possible and to restrict his cash holding to a minimum.”

As we speak, Venezuelan shoppers are queuing outside seized stores trying to spend their rapidly depreciating currency, and the economy is marching steadily toward a dénouement when bolivars (Venezuela’s currency) will be useful for little more than kindling.

Venezuela has in fact been fueling the fire of economic disaster for quite some time. The socialist programs of Chávez’s administration squandered the country’s scarce capital in wasteful production. As chronic shortages set in, the government turned to price, capital, and foreign exchange controls to keep the economy afloat, each of which led to further chaos. Currently, Maduro’s administration is planning to extend the controls to all commodity prices, in yet another doomed effort to fix the country’s dire economic problems, but new controls will only make things worse. The only way to truly prevent soaring prices is to stop the printing press and give the reins of the economy over to the market by eliminating price controls. The nationalization of private businesses and establishment of total price controls will not cover up disastrous monetary policies, but only prolong and aggravate their effects. They merely add to ever-higher price increases and ever-lower supply of consumer goods and more capital consumption, further eroding the country’s economic foundation.

Venezuela’s dire straits might seem far removed from the problems faced by other nations, and it is easy to believe that hyperinflation is impossible “here.” Yet as Mises warned, the seeds of disaster are sown from the beginning of government intervention in the market, although “the first stage of the inflationary process may last for many years.” But the final stages of economic collapse occur far more quickly: as Peruvian-Spanish writer and political commentator Alvaro Vargas Llosa points out, “going from 60 percent [inflation] to 1,000 percent is a lot easier than going from 3 percent to 40 or 50 percent.” As disturbing as the thought is, the difference between the U.S. and other Western economies and Venezuela is merely one of degree, not of kind.

After all, Chávez carried out his Bolivarian Missions through a program of nationalization, subsidies, and affordable healthcare. This is a familiar refrain in Western economies.

Venezuela’s problems are more easily visible and have escalated more quickly because its capital stock has been largely depleted by an unbridled 15-year commitment to socialist economic policies. Other states such as the US still rely on large capital stocks accumulated in years of freer markets. Therefore, Western economies may not see their toilet paper disappear from supermarket shelves, yet, but rising prices and numerous bankruptcies indicate that the tendency is the same. This cements once again Mises’s idea that no country will find a stable “middle-of-the-road” economic policy. All movements lead toward one extreme: markets or socialism. Mixed economies are just pit-stops in between. The games all central banks play with the purchasing power of money may be more subtle, but they are ultimately just as harmful as conspicuous socialism.

Some have argued that the crisis in Venezuela will most likely “undercut Chavismo’s viability” as a political program. Yet the critical issue is not a political one, but the economic fact that Venezuela is frantically squandering its resources, consuming its capital, and impoverishing its people. If Maduro’s policies persist, and if after the seemingly inevitable collapse the legacy of chavistas loses its viability — “vaccinating” Venezuelans against a return to such destructive regimes — it will be the only good thing to come out of these tragic events.

Although the odds are against it, let us hope other countries learn something from this episode before they too approach the brink of economic disaster.


via Zero Hedge http://feedproxy.google.com/~r/zerohedge/feed/~3/YJ82IDnd0n8/story01.htm Tyler Durden

Wal-Mart Responds To Striking Workers And Assorted Hangers On

From a Press Release issued by America’s (and the world’s) largest employer (except the US government of course) in response to sporadic strikes by its workers:

 “This has been the most successful Black Friday in Walmart’s history, with customers receiving bigger and better savings and an overall safer shopping experience. We’re proud of the hard work our associates have put into making this a great Black Friday for our customers, and we’re pleased we can provide them with holiday pay equal to an additional day’s work, as well as a 25 percent discount on an entire basket of goods for their extraordinary efforts.

“Black Friday is a big stage, and we’re one of the biggest players in the retail industry. We’re not surprised that those trying to change our industry are using this platform to get their message out, and we respect their right to be heard. We expect some demonstrations at our stores today, although far fewer than what our critics are claiming and with hardly any actual Walmart associates participating.

“For our part, we want to be absolutely clear about our jobs, the pay and benefits we offer our associates, and the role retail jobs play in the U.S. economy. Walmart provides wages on the higher end of the retail average with full-time and part-time associates making, on average, close to $12.00 an hour. The majority of our workforce is full-time, and our average full-time hourly pay is $12.81 an hour. We are also proud of the benefits we offer our associates, including affordable health care, performance-based bonuses, education benefits, and access to a 401K.

“Of course, we have entry-level jobs and we always will. The real issue isn’t where you start. It’s where you can go once you’ve started. Retail is one of the few industries that has jobs at all levels and ongoing advancement opportunities. Walmart promotes on average more than 430 associates a day. By year’s end, we will have promoted 160,000 associates, including 25,000 this holiday season alone. It’s businesses like Walmart that can create opportunities for career growth and greater economic security for families.”


via Zero Hedge http://feedproxy.google.com/~r/zerohedge/feed/~3/vA1raKTrGkw/story01.htm Tyler Durden

With A GAAP PE Of 19x, "Growth Is All That Matters Now"

In a market in which “one-time, recurring adjustments” such as JPM’s quarterly (and quite recurring) multi-billion addbacks consistently mean the difference between meeting and beating expectations for corporations, one long-forgotten aspect of earnings is what net income would be on a plain-vanilla, GAAP basis: the kind which actually looks at the true bottom line excluding accounting gimmicks, pro forma fabulations and recurring non-recurring adjustments. As the chart below shows, GAAP EPS in the just completed third quarter declined from a record high $26.13 in Q2 to $23.85.

The good news: while GAAP earnings declined on a sequential basis, they increased by 9% compared to last year. However, what is quite visible in the quarterly EPS chart below is the increasingly declining power of Fed intervention to keep earnings rising: the surge impact of QE1 faded in 3 quarters, QE2 rolled over in March 2012, and QE3 didn’t really generate a big boost in earnings until the arrival of Japan’s QE in Q2 of 2013, although even that now appears to be rolling over.

GAAP EPS on a quarterly basis:

Same as above shown on a trailing 12 month basis:

So just how is the rolling over – on a normalized, actual basis – market supposed to be cheap? Simple: margins that are expected to literally go parabolic in the coming years. How? It is unclear because with most companies having already “temped out” and converted what full-time workers they have to part-time, and fixed costs only expected to rise once the must delayed inflation eventually does make a return appearance, the only place for margins is down. In any case, here is the expectation:

Which leaves just one possibility: even more multiple expansion. There is one problem: multiple growth has already been thoroughly abused as a source of stock market “growth”, and accounts for over 80% of the market upside in the past two years, and is responsible for 75% of the S&P increase in 2013. Excluding the 2009 “outlier” event, this is the greatest contribution to the S&P from multiple expansion in 15 years.

Putting this all together, what does the true earnings picture of companies tell us about the market? Simple: it is overvalued relative to historical averages on every single basis, and not just the much discussed recently 10 year average used in the Shiller PE which has the market now at a 25x multiple.

Or in table format:

In short: the trailing EPS of 18x GAAP and 16.3x Non-GAAP is higher than the comparable GAAP and non-GAAP multiple for the long term, 1910-2013 average (15.8x and 14.5x), and while in line with the GAAP average for the 1960-2013 period, it is overvalued relative to the 15.9x non-GAAP average. However, if one excludes the 1997-2000 tech bubble, the historical average multiples drop even more to 17.7 and 15.2.

The one loophole: the high inflation years (1974-1984), when PE multiples were below 10x for both GAAP and non-GAAP. Then again, as the market has priced in the high inflation courtesy of the Fed’s exploding balance sheet, which however has yet to manifest itself in the economy and soaring input costs. So assuming a trendline EPS of ~$100 and applying a “high inflation” multiple of 10x to it, leads to the same conclusion recently observed by Jeremy Grantham’s GMO: the market is about 75% overvalued.

Deutsche Bank’s David Bianco had a succinct summary of the above quandary:

Growth is all that matters now


We find ourselves in a very cheery early holiday mood. 1800 certainly deserves celebration. Whether 2013 ends with the S&P +/- 50 points from here matters little. This year will be remembered for strong gains, investors putting the crisis behind and restoring the normal S&P PE. This is a welcome sign of better confidence and equity wealth helps, but before we get too merry we turn to the simple truth that now good growth better come. An accommodative Fed, buybacks, inflows, not expensive PE (despite Shiller’s PE) will all assist the market in 2014, but healthy EPS growth is now a must…. We think S&P EPS growth must be 7-9% next year to meet today’s price implied expectations.

Unfortunately for growth to materialize, there has to be investment in the future, capex spending, revenue upside and ultimately EPS growth. However, as we predicted nearly 2 years ago and as proven correct subsequently, in the new normal, CapEx is the last thing on any corporation’s mind. Proof: the latest core capital spending report:

So good luck with that 7-9% EPS growth, especially if Barack Obama is indeed hell-bent on converting banks into utilities courtesy of billions in quarterly “non-recurring” litigation charges.

In conclusion we should note that all of the above is moot – as long as the only driver of stock prices is the Fed’s surging balance sheet, which for now shows no indication of slowing down, any comparative analysis of the New Normal to prior historical periods is completely meaningless.


via Zero Hedge http://feedproxy.google.com/~r/zerohedge/feed/~3/qv4XJuzDhFs/story01.htm Tyler Durden

With A GAAP PE Of 19x, “Growth Is All That Matters Now”

In a market in which “one-time, recurring adjustments” such as JPM’s quarterly (and quite recurring) multi-billion addbacks consistently mean the difference between meeting and beating expectations for corporations, one long-forgotten aspect of earnings is what net income would be on a plain-vanilla, GAAP basis: the kind which actually looks at the true bottom line excluding accounting gimmicks, pro forma fabulations and recurring non-recurring adjustments. As the chart below shows, GAAP EPS in the just completed third quarter declined from a record high $26.13 in Q2 to $23.85.

The good news: while GAAP earnings declined on a sequential basis, they increased by 9% compared to last year. However, what is quite visible in the quarterly EPS chart below is the increasingly declining power of Fed intervention to keep earnings rising: the surge impact of QE1 faded in 3 quarters, QE2 rolled over in March 2012, and QE3 didn’t really generate a big boost in earnings until the arrival of Japan’s QE in Q2 of 2013, although even that now appears to be rolling over.

GAAP EPS on a quarterly basis:

Same as above shown on a trailing 12 month basis:

So just how is the rolling over – on a normalized, actual basis – market supposed to be cheap? Simple: margins that are expected to literally go parabolic in the coming years. How? It is unclear because with most companies having already “temped out” and converted what full-time workers they have to part-time, and fixed costs only expected to rise once the must delayed inflation eventually does make a return appearance, the only place for margins is down. In any case, here is the expectation:

Which leaves just one possibility: even more multiple expansion. There is one problem: multiple growth has already been thoroughly abused as a source of stock market “growth”, and accounts for over 80% of the market upside in the past two years, and is responsible for 75% of the S&P increase in 2013. Excluding the 2009 “outlier” event, this is the greatest contribution to the S&P from multiple expansion in 15 years.

Putting this all together, what does the true earnings picture of companies tell us about the market? Simple: it is overvalued relative to historical averages on every single basis, and not just the much discussed recently 10 year average used in the Shiller PE which has the market now at a 25x multiple.

Or in table format:

In short: the trailing EPS of 18x GAAP and 16.3x Non-GAAP is higher than the comparable GAAP and non-GAAP multiple for the long term, 1910-2013 average (15.8x and 14.5x), and while in line with the GAAP average for the 1960-2013 period, it is overvalued relative to the 15.9x non-GAAP average. However, if one excludes the 1997-2000 tech bubble, the historical average multiples drop even more to 17.7 and 15.2.

The one loophole: the high inflation years (1974-1984), when PE multiples were below 10x for both GAAP and non-GAAP. Then again, as the market has priced in the high inflation courtesy of the Fed’s exploding balance sheet, which however has yet to manifest itself in the economy and soaring input costs. So assuming a trendline EPS of ~$100 and applying a “high inflation” multiple of 10x to it, leads to the same conclusion recently observed by Jeremy Grantham’s GMO: the market is about 75% overvalued.

Deutsche Bank’s David Bianco had a succinct summary of the above quandary:

Growth is all that matters now


We find ourselves in a very cheery early holiday mood. 1800 certainly deserves celebration. Whether 2013 ends with the S&P +/- 50 points from here matters little. This year will be remembered for strong gains, investors putting the crisis behind and restoring the normal S&P PE. This is a welcome sign of better confidence and equity wealth helps, but before we get too merry we turn to the simple truth that now good growth better come. An accommodative Fed, buybacks, inflows, not expensive PE (despite Shiller’s PE) will all assist the market in 2014, but healthy EPS growth is now a must…. We think S&P EPS growth must be 7-9% next year to meet today’s price implied expectations.

Unfortunately for growth to materialize, there has to be investment in the future, capex spending, revenue upside and ultimately EPS growth. However, as we predicted nearly 2 years ago and as proven correct subsequently, in the new normal, CapEx is the last thing on any corporation’s mind. Proof: the latest core capital spending report:

So good luck with that 7-9% EPS growth, especially if Barack Obama is indeed hell-bent on converting banks into utilities courtesy of billions in quarterly “non-recurring” litigation charges.

In conclusion we should note that all of the above is moot – as long as the only driver of stock prices is the Fed’s surging balance sheet, which for now shows no indication of slowing down, any comparative analysis of the New Normal to prior historical periods is completely meaningless.


via Zero Hedge http://feedproxy.google.com/~r/zerohedge/feed/~3/qv4XJuzDhFs/story01.htm Tyler Durden

Late-Day Dump Not Enough To Spoil S&P 500's Best Run Since Jan 2004; Up 8 Weeks-In-A-Row

Despite a significant tumble into the close ($3.25bn notional sold in last 4 seconds of S&P futures); for the first time since January 2004, the S&P 500 has risen for eight straight weeks. Trannies are still leading off the debt-ceiling-debacle lows up 13.3% but this week saw the NASDAQ accelerating to 11.3% gains off those lows. Despite being pounded by GBP buyers, the USD (rescued by JPY weakness) ended the week unchanged and Treasury yields are +/-2bps on the week (30Y -1.5bps, 5Y +2bps). Despite some early week weakness, today saw commodities rising (with WTI crude jumping higher – modestly narrowing the 8-month wides in the Brent-WTI spread at $17.60). Gold and silver recovered to gains on the week keeping pace with the S&P and Dow. VIX (once again) entirely disengaged from stocks' exuberance and so did credit markets.


Ugly end to the week…


and month-end volume was huge in S&P futures…


8 green weeks in a row for the S&P…


NASDAQ is catching up to Trannies off the lows…


Commodites rose on the day with gold and silver closing the week up around 1%…and WTI recovering some early losses…


But the Brent-WTI spread has pushed to 8-month highs, but the  last 2 days saw WTI outperforming to modestly close the gap…


Credit markets didnt buy it…


And nor is VIX for now (as it seems while selling is frowned upon – hedging is not)…


Charts: Bloomberg


via Zero Hedge http://feedproxy.google.com/~r/zerohedge/feed/~3/Tr78XJpPbwE/story01.htm Tyler Durden

Late-Day Dump Not Enough To Spoil S&P 500’s Best Run Since Jan 2004; Up 8 Weeks-In-A-Row

Despite a significant tumble into the close ($3.25bn notional sold in last 4 seconds of S&P futures); for the first time since January 2004, the S&P 500 has risen for eight straight weeks. Trannies are still leading off the debt-ceiling-debacle lows up 13.3% but this week saw the NASDAQ accelerating to 11.3% gains off those lows. Despite being pounded by GBP buyers, the USD (rescued by JPY weakness) ended the week unchanged and Treasury yields are +/-2bps on the week (30Y -1.5bps, 5Y +2bps). Despite some early week weakness, today saw commodities rising (with WTI crude jumping higher – modestly narrowing the 8-month wides in the Brent-WTI spread at $17.60). Gold and silver recovered to gains on the week keeping pace with the S&P and Dow. VIX (once again) entirely disengaged from stocks' exuberance and so did credit markets.


Ugly end to the week…


and month-end volume was huge in S&P futures…


8 green weeks in a row for the S&P…


NASDAQ is catching up to Trannies off the lows…


Commodites rose on the day with gold and silver closing the week up around 1%…and WTI recovering some early losses…


But the Brent-WTI spread has pushed to 8-month highs, but the  last 2 days saw WTI outperforming to modestly close the gap…


Credit markets didnt buy it…


And nor is VIX for now (as it seems while selling is frowned upon – hedging is not)…


Charts: Bloomberg


via Zero Hedge http://feedproxy.google.com/~r/zerohedge/feed/~3/Tr78XJpPbwE/story01.htm Tyler Durden