Goldman Reveals Its First Two "Top Trades" Of 2014: Says To Buy S&P With 2250 Target, Short AUD

The only thing that prevents us from going all in short the S&P following the revelation that Goldman’s first revealed top trade of 2014 is to go long the S&P Dec 2014 futures with a target of 2250 and a close below 1855, is that the reco is not from Tom Stolper but his colleague Noah Weisberger whose muppet wipe out record is not quite as prominent. Still, for Goldman clients to buy S&P futs, Goldman has to sell it to them, and as always – do what Goldman does, not what it says.

Recommended Top Trades for 2014

Longer-term structural views are expressed in our Top Trade recommendations. These are typically managed with a wide stop, and assessed on the basis of whether the fundamentals continue to support the medium-term investment theme.

1) Open long SP 500 Dec 14 Future and (funded out of) short AUD/USD Dec 14 Future, opened at 1986.8 on 25 Nov 2013, with a target of 2250 and a stop on a close below 1855, currently at 1986.8.

More from Goldman’s Weisberger:

1. Top Trade Recommendation #1: Long S&P short AUD for a target of +c13% and a stop loss of –c6.5%

On Friday the US equity market closed on fresh highs, with the S&P 500 climbing to 1804, amidst moderating longer dated US yields. Oil prices moderated a bit, and EM currencies continued to weaken. The Yen continued to weaken too, with last week’s move below 100 still intact. And the USD strengthened against most major crosses. In early action, Asian markets were dominated by further gains in the Nikkei and $/JPY.

Last week, we released our new 2014 economic and market forecasts and list of 2014 Top Ten market themes (see Global Viewpoint 13/05, Nov 20, 2013). And beginning with today’s Global Market Daily, we will be revealing our initial Top Trade Recommendations for 2014, one trade a day for the next several days (interrupted by the US Thanksgiving holiday), much as we did last year. The purpose of the Top Trade Recommendation list is, as always, to connect specific and actionable trade ideas to the set of key market themes that are likely to play out over the course of the year and that we expect to form the backbone of our strategic approach to markets for the year to come. While our initial list will be comprehensive, and connect back to the economic and market forces as we see them currently, we are likely to add to the list of Top Trade Recommendations (along with our usual slate of tactical trade recommendations) as the year progresses, as our views evolve, and as market risks and opportunities shift.

The first Top Trade Recommendation for 2014 is to be long the S&P 500 accompanied by a short AUD position (vs. the USD), for an upside target of +c13% from current levels, and a stop loss of –c6.5%. This reflects what is perhaps the largest overarching theme of our market outlook – a belief that DM equities are well placed as long as US yields do not rise too quickly. The specific implementation of this trade recommendation that we will track is a long position in Dec 2014 S&P 500 futures (BBERG ticker SPZ4, currently at 1774.4), and a corresponding short position in Dec 2014 AUDUSD futures (BBERG ticker ADZ4, currently at 89.31). Given our forecasts for both assets, with an S&P year-end target of 1900, and a year-end AUD target vs. the USD of 0.85, we see scope for both “legs” of the trade to generate potential returns. Combining these assets, S&P Dec futures in AUD terms (also using the Dec 14 future) is currently at 1986.8, with an initial target of 2250, which is about in line with the expected moves in each asset separately, and a stop on a close below 1855.

2. Long the S&P 500: “Earn the DM risk premium…”

This combination trade recommendation captures several elements of our Top Ten market views, as enumerated in the Global Viewpoint: (1) Showtime for the US/DM recovery, (2) forward guidance in an above trend world, (3) earn the DM equity risk premium, hedge the risk and (9) commodity downside risks grow.
Core to both our economic and market views for next year, is that a US growth acceleration will materialize, with real GDP growth expected to reach 3.5% mid-year, and remain there for the duration of 2014. Our 2014 US economic growth views remain meaningfully above consensus, and given the stop-start nature of the recovery so far, the US equity market – despite a strong 2014 – likely still needs convincing that growth, and not merely risk preference, is a viable driver from here.

At the same time, we think the main case for US equities is that the gap between real bond yields and earnings yields remains unusually high, in an environment where recovery should continue to convince investors that the economic backdrop no longer justifies this. The earnings yield on the SPX is around 6.5% even as the real 10-year bond yield is firmly below 1% and – on current forward prices – expected to stay low for at least another two years. Even if growth moves above trend, as we envisage in our forecasts, we do not expected the Fed to hike rates for two more years. And even if they taper their asset purchases (as we expect to occur in early 2014), this will likely be coupled with a heavy dose of guidance, to convince the market that it is committed to easy policy.

Both better US growth views, a favorable policy backdrop, and still attractive risk premia support long exposure to S&P 500, which is also in line with our US strategy team’s end-2014 target of 1900, predicated on stable multiples and expanding earnings. If bond yields do not rise much in the face of better growth, we think the risks are to an earlier and faster climb in equities. We are forecasting higher returns in other DM equity markets – and these may be viable alternatives – but the US story is still the most reliably linked to the part of our economic outlook where we have the most confidence.

3. Offset by a short AUD position: “…Hedge the risk “

As we have stated, the key risk to our upbeat equity market views for 2014 is that, along the way to above trend real US GDP growth, rates respond more dramatically than our baseline path envisages and so the spread of earning yield to bond yield closes from the “other” side. The risk we worry about most is that a gradual rise in ten-year yields to 3.25% by year’s end could be supplanted by a bout(s) of more wrenching moves lower in rates. As we have argued in the past, US assets, and US equities in particular, ought to be able to ultimately weather such a storm, given that the proximate driver of any rate pressures will most likely be better US growth outcomes. Like the “taper tantrum” of 2013, US equities may struggle for a time but in our estimation, EM markets – particularly FX — are most at risk from a sharp US rates sell off.

The ideal hedge against this risk would be a position that: a) is correlated with US/DM equities, b) that we expect to pay off even in our central case, and c) that is likely to perform better under scenarios in which US yields rise more rapidly. While there are several potential implementations for this “earn the risk premia, hedge the risk” notion, a short AUD position generally meets these criteria well. First, AUD is a cyclical currency, and tends to be moderately positively correlated with the S&P 500 and about matches its volatility. Over the last year or so, the AUD has also become increasingly negatively correlated with US rates (more so than other candidate currencies), which is exactly the characteristic that we seek.

In addition, we think the AUD is facing its own headwinds, and from a pure currency perspective, relative to most other G10 currencies and major EMs, it is a currency where we still expect reasonable declines. Despite its typical cyclical characteristics, the AUD is facing structural headwinds from domestic dynamics, hence limiting its upside even in a better growth world, with policy
makers there open a bit to further currency depreciation to help boost prospects at home and we expect another rate cut from the RBA, even as others consider a (slow) shift to monetary tightening.. Second, it is also largely a commodity currency and more levered to China-driven, commodity-driven growth impulses. And central to our economic and market thinking for the year, is that the global growth impulse will be US driven, focused on improving consumer and capex spending, with EM and China stability a function of external DM strength, rather than self-made, with most commodity prices expected to moderate over the course of the year. These factors underscore our FX forecast for AUD at 0.85 by year end.

4. Putting it all together

The long S&P 500/short AUD Top Trade Recommendation captures several key themes in our 2014 outlook, and highlights a broader “philosophy” of how we tend to think about integrating macroeconomic views and market implementations, though we are open to a number of variants on this theme. This “pair” trade gives us access to the upside equity implications of our outlook, while hedging out a key risk to our broader views – a sharp rates sell off – with an asset that we think will also be facing fundamental downward pressures of its own. The volatility of the pair is similar to the volatility of the two individual legs given the positive correlation between AUD and SPX.

We do see several potential stumbling blocks to the first of our 2014 Top Trade Recommendations. First, should growth views disappoint meaningfully, we do not think the AUD leg would provide sufficient protection and equity risk could widen out again, though we do think long equity positions could still do well in a moderate (and below our expectations) growth backdrop. If the market worried about the US growth picture, while relaxing more about the outlook in China (or Australia itself) that would be particularly risky for the pair, though we think that combination is unlikely. In addition, any shift in global preferences for reserve diversification could undermine expected AUD weakness. Lastly, both of these assets have had significant moves already. The S&P 500 has had a stellar 2013, hitting fresh highs only last week, and the AUD has come under pressure in the last few days. So it may be that a somewhat better entry point appears in the near term. Our goal with the Top Trades is to lay out big picture themes that we think have significant return potential, more than to finesse the timing. And we think these moves could well extend, and have set stops and targets accordingly.


via Zero Hedge http://feedproxy.google.com/~r/zerohedge/feed/~3/LSw-PakFuk4/story01.htm Tyler Durden

Goldman Reveals Its First Two “Top Trades” Of 2014: Says To Buy S&P With 2250 Target, Short AUD

The only thing that prevents us from going all in short the S&P following the revelation that Goldman’s first revealed top trade of 2014 is to go long the S&P Dec 2014 futures with a target of 2250 and a close below 1855, is that the reco is not from Tom Stolper but his colleague Noah Weisberger whose muppet wipe out record is not quite as prominent. Still, for Goldman clients to buy S&P futs, Goldman has to sell it to them, and as always – do what Goldman does, not what it says.

Recommended Top Trades for 2014

Longer-term structural views are expressed in our Top Trade recommendations. These are typically managed with a wide stop, and assessed on the basis of whether the fundamentals continue to support the medium-term investment theme.

1) Open long SP 500 Dec 14 Future and (funded out of) short AUD/USD Dec 14 Future, opened at 1986.8 on 25 Nov 2013, with a target of 2250 and a stop on a close below 1855, currently at 1986.8.

More from Goldman’s Weisberger:

1. Top Trade Recommendation #1: Long S&P short AUD for a target of +c13% and a stop loss of –c6.5%

On Friday the US equity market closed on fresh highs, with the S&P 500 climbing to 1804, amidst moderating longer dated US yields. Oil prices moderated a bit, and EM currencies continued to weaken. The Yen continued to weaken too, with last week’s move below 100 still intact. And the USD strengthened against most major crosses. In early action, Asian markets were dominated by further gains in the Nikkei and $/JPY.

Last week, we released our new 2014 economic and market forecasts and list of 2014 Top Ten market themes (see Global Viewpoint 13/05, Nov 20, 2013). And beginning with today’s Global Market Daily, we will be revealing our initial Top Trade Recommendations for 2014, one trade a day for the next several days (interrupted by the US Thanksgiving holiday), much as we did last year. The purpose of the Top Trade Recommendation list is, as always, to connect specific and actionable trade ideas to the set of key market themes that are likely to play out over the course of the year and that we expect to form the backbone of our strategic approach to markets for the year to come. While our initial list will be comprehensive, and connect back to the economic and market forces as we see them currently, we are likely to add to the list of Top Trade Recommendations (along with our usual slate of tactical trade recommendations) as the year progresses, as our views evolve, and as market risks and opportunities shift.

The first Top Trade Recommendation for 2014 is to be long the S&P 500 accompanied by a short AUD position (vs. the USD), for an upside target of +c13% from current levels, and a stop loss of –c6.5%. This reflects what is perhaps the largest overarching theme of our market outlook – a belief that DM equities are well placed as long as US yields do not rise too quickly. The specific implementation of this trade recommendation that we will track is a long position in Dec 2014 S&P 500 futures (BBERG ticker SPZ4, currently at 1774.4), and a corresponding short position in Dec 2014 AUDUSD futures (BBERG ticker ADZ4, currently at 89.31). Given our forecasts for both assets, with an S&P year-end target of 1900, and a year-end AUD target vs. the USD of 0.85, we see scope for both “legs” of the trade to generate potential returns. Combining these assets, S&P Dec futures in AUD terms (also using the Dec 14 future) is currently at 1986.8, with an initial target of 2250, which is about in line with the expected moves in each asset separately, and a stop on a close below 1855.

2. Long the S&P 500: “Earn the DM risk premium…”

This combination trade recommendation captures several elements of our Top Ten market views, as enumerated in the Global Viewpoint: (1) Showtime for the US/DM recovery, (2) forward guidance in an above trend world, (3) earn the DM equity risk premium, hedge the risk and (9) commodity downside risks grow.
Core to both our economic and market views for next year, is that a US growth acceleration will materialize, with real GDP growth expected to reach 3.5% mid-year, and remain there for the duration of 2014. Our 2014 US economic growth views remain meaningfully above consensus, and given the stop-start nature of the recovery so far, the US equity market – despite a strong 2014 – likely still needs convincing that growth, and not merely risk preference, is a viable driver from here.

At the same time, we think the main case for US equities is that the gap between real bond yields and earnings yields remains unusually high, in an environment where recovery should continue to convince investors that the economic backdrop no longer justifies this. The earnings yield on the SPX is around 6.5% even as the real 10-year bond yield is firmly below 1% and – on current forward prices – expected to stay low for at least another two years. Even if growth moves above trend, as we envisage in our forecasts, we do not expected the Fed to hike rates for two more years. And even if they taper their asset purchases (as we expect to occur in early 2014), this will likely be coupled with a heavy dose of guidance, to convince the market that it is committed to easy policy.

Both better US growth views, a favorable policy backdrop, and still attractive risk premia support long exposure to S&P 500, which is also in line with our US strategy team’s end-2014 target of 1900, predicated on stable multiples and expanding earnings. If bond yields do not rise much in the face of better growth, we think the risks are to an earlier and faster climb in equities. We are forecasting higher returns in other DM equity markets – and these may be viable alternatives – but the US story is still the most reliably linked to the part of our economic outlook where we have the most confidence.

3. Offset by a short AUD position: “…Hedge the risk “

As we have stated, the key risk to our upbeat equity market views for 2014 is that, along the way to above trend real US GDP growth, rates respond more dramatically than our baseline path envisages and so the spread of earning yield to bond yield closes from the “other” side. The risk we worry about most is that a gradual rise in ten-year yields to 3.25% by year’s end could be supplanted by a bout(s) of more wrenching moves lower in rates. As we have argued in the past, US assets, and US equities in particular, ought to be able to ultimately weather such a storm, given that the proximate driver of any rate pressures will most likely be better US growth outcomes. Like the “taper tantrum” of 2013, US equities may struggle for a time but in our estimation, EM markets – particularly FX — are most at risk from a sharp US rates sell off.

The ideal hedge against this risk would be a position that: a) is correlated with US/DM equities, b) that we expect to pay off even in our central case, and c) that is likely to perform better under scenarios in which US yields rise more rapidly. While there are several potential implementations for this “earn the risk premia, hedge the risk” notion, a short AUD position generally meets these criteria well. First, AUD is a cyclical currency, and tends to be moderately positively correlated with the S&P 500 and about matches its volatility. Over the last year or so, the AUD has also become increasingly negatively correlated with US rates (more so than other candidate currencies), which is exactly the characteristic that we seek.

In addition, we think the AUD is facing its own headwinds, and from a pure currency perspective, relative to most other G10 currencies and major EMs, it is a currency where we still expect reasonable declines. Despite its typical cyclical characteristics, the AUD is facing structural headwinds from domestic dynamics, hence limiting its upside even in a better growth world, with policy makers there open a bit to further currency depreciation to help boost prospects at home and we expect another rate cut from the RBA, even as others consider a (slow) shift to monetary tightening.. Second, it is also largely a commodity currency and more levered to China-driven, commodity-driven growth impulses. And central to our economic and market thinking for the year, is that the global growth impulse will be US driven, focused on improving consumer and capex spending, with EM and China stability a function of external DM strength, rather than self-made, with most commodity prices expected to moderate over the course of the year. These factors underscore our FX forecast for AUD at 0.85 by year end.

4. Putting it all together

The long S&P 500/short AUD Top Trade Recommendation captures several key themes in our 2014 outlook, and highlights a broader “philosophy” of how we tend to think about integrating macroeconomic views and market implementations, though we are open to a number of variants on this theme. This “pair” trade gives us access to the upside equity implications of our outlook, while hedging out a key risk to our broader views – a sharp rates sell off – with an asset that we think will also be facing fundamental downward pressures of its own. The volatility of the pair is similar to the volatility of the two individual legs given the positive correlation between AUD and SPX.

We do see several potential stumbling blocks to the first of our 2014 Top Trade Recommendations. First, should growth views disappoint meaningfully, we do not think the AUD leg would provide sufficient protection and equity risk could widen out again, though we do think long equity positions could still do well in a moderate (and below our expectations) growth backdrop. If the market worried about the US growth picture, while relaxing more about the outlook in China (or Australia itself) that would be particularly risky for the pair, though we think that combination is unlikely. In addition, any shift in global preferences for reserve diversification could undermine expected AUD weakness. Lastly, both of these assets have had significant moves already. The S&P 500 has had a stellar 2013, hitting fresh highs only last week, and the AUD has come under pressure in the last few days. So it may be that a somewhat better entry point appears in the near term. Our goal with the Top Trades is to lay out big picture themes that we think have significant return potential, more than to finesse the timing. And we think these moves could well extend, and have set stops and targets accordingly.


via Zero Hedge http://feedproxy.google.com/~r/zerohedge/feed/~3/LSw-PakFuk4/story01.htm Tyler Durden

Stock Futures Rise To New Record Highs On Carry-Currency Driven Ramp

Another day, another carry currency-driven futures melt-up to daily record highs (the all important EURJPY soared overnight on the return of the now standard overnight Japanese jawboning of the JPY which sent the EURJPY just shy of a new 4 year high of 138 overnight), and another attempt by the ECB to have its record high market cake, and eat a lower Euro too (recall DB’s said the “pain threshold” for the EUR/USD exchange rate – the level at which further appreciation impairs competitiveness and economic recovery – is $1.79 for Germany, $1.24 for France, and $1.17 for Italy) this time with ECB’s Hansson repeating the generic talking point that the ECB is technically ready for negative deposit rates. However, with the halflife on such “threats” now measured in the minutes, and soon seconds, the European central bank will have to come up with something more original and creative soon, especially since the EURJPY can’t really rise much more without really crushing European trade further.

On today’s US event docket we will see US pending home sales, the Dallas Fed, with the Treasury also conducting the first of 3 bond auctions this week starting with a $32 billion 2yr note sale later. Most importantly, there will be a $2.75-$3.50 billion POMO to kick off the holiday week and assure a new all time stock high.

Market Re-Cap from RanSquawk:

Stocks traded broadly higher in Europe this morning, supported by unwind in the so-called war-premium, as well as comments by ECB’s Hansson who said that the ECB is ready to cut interest rates further. Despite the apparent risk on sentiment, Bunds also benefited from the comments by an Estonian central  banker, who also stated that the ECB is technically ready for negative deposit rate, which resulted in the Euribor curve paring some of the bear steepening observed earlier in the session. The move higher in Europe was led by airlines and travel & tourism related stocks as market participants reacted to reports that Iran has agreed to limit its nuclear programme in exchange for an easing of sanctions which in turn depressed WTI and Brent Crude prices. Also, European auto makers have been among the biggest beneficiaries, with Peugeot up around 4%. At the same time, Italian banks under performed, weighed on by reports that Monte Paschi’s biggest shareholder favours finding buyers for its stake before bank taps investors for EUR 3bln, while analysts at SocGen stated that Italian banks need calculated a EUR 44bln extra-provision needed to normalise bad loans inventory level. Going forward, market participants will get to digest the release of the latest US Pending Home Sales reports and also the US Treasury will sell USD 32bln in 2y notes.

Key events on US data docket:

  • US: Pending home sales, cons 2.0% (10:00)
  • US: Dallas Fed mfg. activity, cons n/a (10:30)
  • US: sells $32bn 2y notes (13:00)

Overnight news bulletin from Bloomberg and RanSquawk:

  • Iran has agreed to limit its nuclear programme in exchange for an easing of tough international sanctions, in a historic deal that follows a decade of on-off negotiations aimed at preventing Tehran from acquiring atomic weapons.
  • ECB’s Hansson says ECB is technically ready for negative deposit rate, ready to cut interest rates further and ECB will discuss publishing minutes soon.
  • Across the European session, equities are mainly seen higher following solution to talks in Geneva, the consequent dip in oil prices has lead the likes of Lufthansa and IAG to trade with gains this morning.
  • Treasury 2/10 and 5/10 curves holding near steepest levels since mid-2011 before holiday- shortened week’s auctions begin with $32b 2Y notes.
  • Notes to be sold today yield 0.300% in WI trading; drew 0.323% in Oct., 0.43% in June
  • European Central Bank Governing Council member Ardo Hansson said the ECB stands ready to cut borrowing costs further and is technically prepared to make its deposit rate negative
  • Obama offered reassurances to Israeli leaders and some Democratic lawmakers critical of the nuclear deal as he sought to tamp down maneuvers in Congress that risk undercutting the accord
  • Deal comes as Obama’s standing has been damaged by the troubled Obamacare rollout; any political boost for Obama may still be limited because the accord is temporary and Iran isn’t trusted by the American public
  • China traded barbs with the U.S. and Japan over its newly announced air defense zone in the East China Sea as escalating tensions between Asia’s largest economies risked damaging a resurgence in trade
  • Sovereign yields mostly lower, EU peripheral spreads widen. Asian stocks mixed, with Nikkei 1.5%, China indexes lower. European stocks, U.S. equity-index futures gain. WTI crude, copper and gold lower


Asian Headlines

JPY curve bear-steepened overnight, driven by the weakness in the long-end of the curve ahead of tomorrow’s 40y JGB auction, as well as the better bid USD/JPY. JPY weakness was prompted by comments by BoJ’s governor Kuroda who said that the implication of negative interest rates on the economy and financial markets was unclear and that negative short-term interest rates could be possible. In other Japan specific commentary, analysts at S&P said that Japan’s tax hike and stimulus is positive but that problems remain.

The reform package recently sanctioned by the Communist Party of China will stimulate the economy and help the country sustain annual growth of around 8%, according to China Center for International Economic Exchanges deputy director Zheng Xinli.

EU & UK Headlines

ECB’s Hansson says ECB is technically ready for negative deposit rate, ready to cut interest rates further and ECB will discuss publishing minutes soon.
– ECB’s Asmussen (neutral, executive board) said a negative deposit rate is a theoretical and possible instrument.
– ECB’s Coeure (soft dove, executive board) said ECB are to discuss publishing account of monthly meeting, and interest rates to remain at current or lower levels for extended period of time.

Germany’s SPD and CDU parties will each hold 6 ministerial posts in new government, while the CSU party will have three according to sources.

UK BBA Loans for House Purchase (Oct) M/M 42808 vs Exp. 45000 (Prev. 42990) – Gross Mortgage Lending at GBP 9.9bln, highest since December 2009.
Barclays month-end extensions: Euro Aggr (+0.04y)
Barclays month-end extensions: Sterling Aggr (+0.06y)

US Headlines

US lawmakers are readying budget fallback options Amid taxes Impasse. This follows US budget negotiators only having less than three weeks until their deadline and are yet to break an impasse over revenue, prompting lawmakers to draft plans for USD 19 billion in defense cuts set to start in January.

Leading US banks have warned that they could start charging companies and consumers for deposits if the US Federal Reserve cuts the interest it pays on bank reserves.

Barclays month-end extensions: Treasuries (+0.10y) – Of note, although the avg. is around 0.06y, larger than avg. increase had been expected given the 3y, 10y and 30y refunding auctions last week.

Equities

Across the European session, equities were seen higher following the apparent solution to the Iranian talks in Geneva, the consequent dip in oil prices has lead the likes of Lufthansa and IAG to trade with gains this morning. However, Italian banks have been leading the FTSE MIB lower amid reports that Monte Paschi’s biggest shareholder favours finding buyers for its stake before bank taps investors for EUR 3bln, while analysts at SocGen stated that Italian banks need calculated a EUR 44bln extra-provision needed to normalise bad loans inventory level.

< strong>FX

Despite higher USD/JPY spot rate this morning, 1mth 25D RR is 0.25 JPY puts vs 0.4 early last week, with analysts at IFR pointing out that RKO (reverse knock-out) barriers tied to money vanillas were tripped on spot ascent to leave market shorter downside. More vanilla barrier levels seen at 102.00 level. Comments by ECB’s Hansson which prompted broad based EUR weakness saw the pair move below the key 21DMA line. However losses were capped by EUR/JPY cross, which remained supported by broad based JPY weakness. Of note, EUR/JPY tested touted 138.00 barrier overnight, with more at 139.00 and size 140.00.

According to BofAML USD/JPY may have further upside potential with broad trends continuing to support USD/JPY.

Commodities

Heading into the North American Open, WTI Crude and Brent futures trade in negative territory following reports over the weekend that Iran agreed with the P5+1 to curb some of its nuclear activities in return for about USD 7bln in sanctions relief.

Goldman Sachs says they see a limited impact on oil supply from Iran agreement with ‘the volume of Iranian crude oil available to the international market will largely remain unchanged over at least the next six months’.

Iran has agreed to limit its nuclear programme in exchange for an easing of tough international sanctions, in a historic deal that follows a decade of on-off negotiations aimed at preventing Tehran from acquiring atomic weapons. (FT-More) Iran agreed to curtail its nuclear activities and in return won as easing of certain sanctions on oil, auto parts, gold and precious metals. There were also comments from US President Obama that the accord followed intensive diplomacy and cuts off Iran’s most likely path to a bomb. Obama also reaffirmed US commitment to Israel and told Israel PM Netanyahu that the US will consult Israel on the Iran deal.

Sinopec have said that operations at its Qindgao production complex will be disrupted following Friday’s blast which killed at least 55 people.

DB’s Jim Reid recaps the remainder of overnight data

Following four days of discussions in Geneva, Iran struck a deal in the early hours of Sunday morning to curb its nuclear activities in exchange for about US$7bn in sanctions relief on oil, auto parts, gold and precious metals. According to the statement released by the White House, Iran has agreed to, amongst other things, halting uranium enrichment above 5%, “neutralising” its stockpile of near-20% uranium, and stopping progress on its enrichment capacity by for instance not installing additional centrifuges of any types. Iran has also committed to further transparency and monitoring of its nuclear programme. According to the FT, the Iranian currency Rial rallied against the USD within hours of the deal after having depreciated by about 50% over the last two years.

The sanction relief on oil raises the prospects of supply and is clearly adding negative pressure on crude prices this morning. Brent crude is down 2.2% from Friday’s close to US$108.6/bbl, and looking set for its biggest decline in three weeks.

Away from the oil market, Asian equities are faring pretty well across the board overnight. Our equity screens this morning are mostly in the green with gains paced by the Nikkei (+1.1%) and Nifty (+1.3%). As it was a relatively quiet weekend as far as news is concerned (outside of the Iran story), the market could be just following the positive US lead from Friday as the S&P 500 (+0.5%) closed above the 1800 mark for the first time. In reality, a sustained downward shift in crude prices could also be also a welcome boost for Asia generally given its status as a net energy importer. Credit markets continue to grind tighter with the benchmark IG indices in Australia and Asia both about 3bp tighter as we type. On balance, the market technical for cash credit is also becoming more favourable as the supply pipeline tapers off into the holiday season. Gold prices are softer this morning while the JPY continues to weaken to its lowest level since May this year.

Looking ahead at the week ahead, data watchers will be kept fairly occupied before Thanksgiving. Starting with today, we will see US pending home sales with the Treasury also conducting the first of 3 bond auctions this week starting with a $32 billion 2yr note sale later. We will get more housing data tomorrow with the release of housing starts, home prices as well as US consumer confidence. Durable goods, Chicago PMI, initial jobless claims and the final UofM Consumer Sentiment print for November are Wednesday’s highlights although we will also get the UK GDP report for Q3. US Equity and fixed income markets are closed on Thursday but US aside we will get the BoE financial stability report, German inflation, Spanish GDP and Chinese industrial profit stats. Expect market activity to remain subdued into Friday as it will be a half-day for US stocks and bond markets. As ever Black Friday sales will be carefully monitored for consumer spending trends. So a reasonably busy, holiday-shortened week for markets ahead of what will be another crucial payrolls number the following week.


via Zero Hedge http://feedproxy.google.com/~r/zerohedge/feed/~3/C2eZQLmA1jc/story01.htm Tyler Durden

Thai Capital Plagued By the Biggest Anti-Government Protests in Years

More than 100,000 protesters congregated at Democracy Monument in Bangkok yesterday to protest Thai PM Yingluck Shiniwatra’s consideration of an amnesty bill to pardon her banned brother Thaksin Shiniwatra, the former Thai PM ousted from the country in a 2006 coup.


Thai anti-government protests, Democracy Monument


Thai anti-government protests at Democracy Monument


Thai anti-government, anti-corruption protests at Democracy Monument, Sunday, 24 November 2013


Thai anti-government, anti-corruption protests at Democracy Monument, Sunday, 24 November 2013


Simply explained, the proposed amnesty bill by the current Thai PM is similar in nature to US Presidential pardons, often administered by outgoing US Presidents to pardon their criminal friends.


For example, here are just a few of the 150 criminals US President Bill Clinton pardoned during his administration:


Amy Ralston Pofahl (drug money laundering, distribution and manufacturing ecstasy)

Norman Lyle Prouse (Former Captain for Northwest Airlines, imprisoned for flying while intoxicated)

Richard Wilson Riley Jr. (Cocaine and marijuana charges, father was Clinton’s Education Secretary)

Dan Rostenkowski (former Democratic Congressman convicted in the Congressional Post Office scandal)

Edward Downe, Jr. (wire fraud, false income tax returns and securities fraud)

Roger Clinton, Jr. (cocaine charges, half-brother of President Bill Clinton)

Mansour Azizkhani (1984 false statements in bank loan applications)

Nicholas M. Altiere (1983 importation of cocaine)

Bernice Ruth Altschul (1992 money laundering conspiracy)

Marc Rich (tax evasion and illegally making oil deals with Iran during the Iran hostage crisis)


Here are just a few of the 189 criminals George W. Bush pardoned during his administration:


Bruce Louis Bartos (Transportation of a machine gun in foreign commerce)

Michael Robert Moelter (Conducting an illegal gambling business)

Samuel Wattie Guerry (Food Stamp fraud)

Meredith Elizabeth Casares (Embezzlement of US Postal Service Funds)

Joseph William Warner (Arson)

Rusty Lawrence Elliot (Making counterfeit Federal Reserve notes)

Rufus Edward Harris (Conspiracy to deliver 10 or more grams of LSD)

Larry Paul Lenius (Conspiracy to distribute cocaine)

Donald Lee Pendergrass (Armed bank robbery)

Karen Marie Edmonson (Distribution of methamphetamines)

Glanus Terrell Osborne (Possession of a stolen motor vehicle)

Samuel Lewis Whisel (Aiding and abetting the transportation of stolen goods)

Richard James Putney, Jr. (Aiding and abetting the escape of a prisoner)


And here are just a few of the 39 criminals Barack Obama has thus far pardoned during his administration (most US Presidential pardons are granted just prior to the end of the sitting President’s term. Thus most of Obama’s pardons will be granted in the future):


Edwin Hardy Futch, Jr. (Theft from an interstate shipment)

Jon Christopher Kozeliski (Conspiracy to traffic counterfeit goods)

Michael John Petri (Conspiracy to possess with intent to distribute and distribution of cocaine)

Lynn Marie Stanek (Unlawful use of a communication facility to distribute cocaine)

Dennis George Bulin (Conspiracy to possess with intent to distribute in excess of 1,000 pounds of marijuana)

Thomas Paul Ledford (Conducting and directing an illegal gambling business)

Timothy James Gallagher (Cocaine possession and conspiracy to distribute)

Bobby Gerald Wilson (Aiding and abetting the possession and sale of illegal American alligator hides)


From the above, it is blatantly obvious that US Presidents regularly abuse the sanctity of their office to pardon a wide range of offenses committed by their friends, including arson, larceny, drug trafficking, armed robbery, fraud, counterfeit, possession and trafficking of stolen goods and participation in illegal gambling enterprises. If you wonder why banks like Wachovia, HSBC, Citigroup, JP Morgan et al regularly get away with knowingly laundering money for violent drug cartels without a single banker ending up in jail for this criminal behavior, the actions of current and former POTUS clearly illustrates that the War on Drugs is a false war with a real ulterior motive of producing profits for those parties, including bankers and politicians, most heavily involved in it. As I couldn’t find a case of human trafficking pardoned among the several hundred pardons granted by Presidents Clinton, Bush and Obama, perhaps this is the one crime so heinous that even US Presidents are unwilling to pardon it.


In light of the above, it is no wonder that Thai citizens are fed up with government corruption that plagues all governments worldwide, and have taken to the streets to protest a proposed amnesty bill that would not only provide amnesty for a list of former PM Thaksin’s “political offenses stretching back to the 2006 coup” according to the Bangkok Post, but would also return Thaksin’s considerable 46 billion baht (USD $1.4 billion) of frozen assets gained through corruption, perhaps with interest. The Bangkok Post also noted that “all government officials, from former prime minister Abhisit Vejjajiva to military commanders, held accountable by the red shirts for the deaths of 92 people in the May 19 crackdown in 2010 will also be absolved of all wrongdoing” as part of the proposed amnesty bill. Furthermore, in a huge conflict of interest, 600 million baht would be returned to the current Prime Minister, Thaksin’s sister, Yingluck Shinawatra. According to Bloomberg, “the amnesty bill angered Thaksin’s opponents, who said it could whitewash crimes he allegedly committed in power, while some of his own supporters criticized the law for protecting opposition leaders who allowed the army to use live ammunition to disperse protesters in 2010 when their Democrat party held power.”


In response to this protest, thus far, more than USD $2.1 billion in capital has been withdrawn from the Thai bond and equities market just this month through the 22nd of November, and the Thai baht has now fallen to 31.94 to the USD, its weakest showing since 13 September of this year. As the Bank of Thailand refused to engage in the currency war to the bottom at a time when all major Central Banks were engaging in this war, could further Thai baht devaluation be on the horizon, especially in light of the political instability in Thailand now? Most certainly.


Related posts: “The Biggest Disaster in SE Asia Waiting to Happen: Thailand’s Massive Real Estate Bubble”. Follow us on Twitter, subscribe to our YouTube channel, and sign up for our free newsletter here.


via Zero Hedge http://feedproxy.google.com/~r/zerohedge/feed/~3/1L8FlKkrfog/story01.htm smartknowledgeu

#AskJPM Fiasco Provides Blueprint to Rein in Criminal Banking Behavior

The #AskJPM debacle that JP Morgan cancelled earlier this month due to embarrassment and humiliation regarding the mountain of questions they received in regard to their criminal actions provided a gift to all of us. American Indian tribes did not have jails due to the impracticality of having permanent prisons when their way of life called for a nomadic lifestyle. However, this, by no means, implied that everyone in their tribes acted as angels and committed no wrongdoing. It did however mean that they found another extremely effective solution in dealing with criminal, misanthropic behavior without the threat of imprisonment. For all intents and purposes, Western bankers, having bought out all judges and regulatory and judicial bodies today with their unlimited wallets, have no jails for them today as well, although this clearly is not the case in the East, where a Vietnamese banker faces execution for fraud.


However, in looking towards how American Indians handled the problem of criminal behavior within their society effectively without the use of prisons, and given the outcome of the #AskJPM twitter session, I believe that we now have a blueprint to rein in the sociopathic behavior of unrepentant bankers.  I explain further in the video below.


via Zero Hedge http://feedproxy.google.com/~r/zerohedge/feed/~3/FK9whfnYf9M/story01.htm smartknowledgeu

Why The Fed Can't See A Bubble In Equity Valuations

In 'An Open Letter To The FOMC' John Hussman lays out in detail the true state of the world that asset-gatherers and Fed members alike seem blinded to. The intent of his letter is not to criticize, but hopefully to increase the mindfulness of the FOMC as to historical evidence, the strength of various financial and economic relationships, and the potentially grave consequences of further extreme and experimental monetary policy. Crucially, as we have heard numerous times in the last few weeks, the Fed sees no bubble, and so, a courtesy to both the investing public and the gamblers at the Fed, Hussman explains the reason that the Fed does not see an “obvious” stock market bubble (to use a word regularly used by Governor Bullard, as if to imply that misvaluations cannot exist unless they smack their observers with a two-by-four).


Excerpted from John Hussman's "Open Letter To The FOMC",


The reason that the Fed does not see an “obvious” stock market bubble (to use a word regularly used by Governor Bullard, as if to imply that misvaluations cannot exist unless they smack their observers with a two-by-four) is because while price/earnings multiples appear only moderately elevated, those multiples themselves reflect earnings that embed record profit margins that stand about 70% above their historical norms.

We can demonstrate in a century of evidence that a) profit margins are mean-reverting and inversely related to subsequent earnings growth, b) margin fluctuations are largely driven by cyclical variations in the combined savings of households and government, and importantly, c) valuation measures that normalize or otherwise dampen cyclical variation in profit margins are dramatically better correlated with actual subsequent outcomes in the equity markets.


[ZH: READ THAT AGAIN!!]


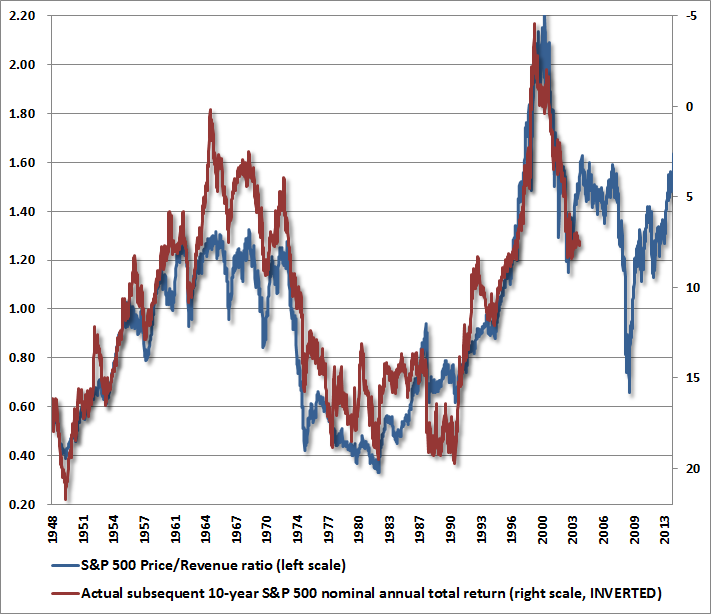
A few additional charts will drive this point home. The chart below shows the S&P 500 price/revenue ratio (left scale) versus the actual subsequent 10-year nominal total return of the S&P 500 over the following decade (right scale, inverted). Market valuations on this measure are well above any point prior to the late-1990’s market bubble. Indeed, if one examines the stocks in the S&P 500 individually, the median price/revenue multiple is actually higher today than it was in 2000 (smaller stocks were more reasonably valued in 2000, compared with the present). This is a dangerous situation. In this context, the dismissive view of FOMC officials regarding equity overvaluation appears misplaced, and seems likely to be followed by disruptive financial adjustments.


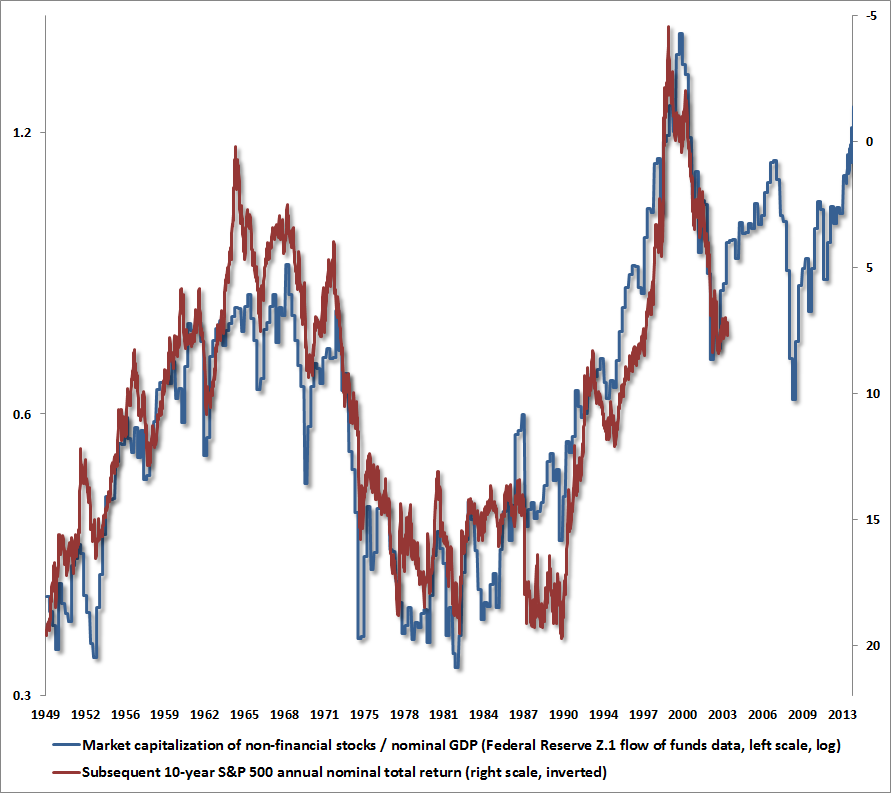
One obtains a similar view, with equal historical reliability, from the ratio of nonfinancial equity capitalization to nominal GDP, using Federal Reserve Z.1 Flow of Funds data. On this measure, equities are already beyond their 2007 peak valuations, and are approaching the 2000 extreme. The associated 10-year expected nominal total return for the S&P 500 is negative.


The unfortunate situation is that while the required financial adjustment may or may not be as brutal for investors as in 2007-2009, or 2000-2002, or 1972-1974, when the stock market lost half of its value from similar or lesser extremes, the consequences of extremely rich valuation cannot be undone by wise monetary policy. The Fed has done enough, and perhaps dangerously more than enough. The prospect of dismal investment returns in equities is an outcome that is largely baked-in-the-cake. The only question is how much worse the outcomes will be as a result of Fed policy that has few economic mechanisms other than to encourage speculative behavior.

And of course this speculative behavior ends with only one feature – bubble risk…

A discussion of bubble risk would be incomplete without defining the term itself. From an economist’s point of view, a bubble is defined in terms of differential equations and a violation of “transversality.” In simpler language, a bubble is a speculative advance where prices rise on the expectation of future advances and become largely detached from properly discounted fundamentals. Put another way, a bubble reflects a widening gap between the increasingly extrapolative expectations of market participants and the prospective returns that can be estimated through present-value relationships linking prices and likely cash flows.


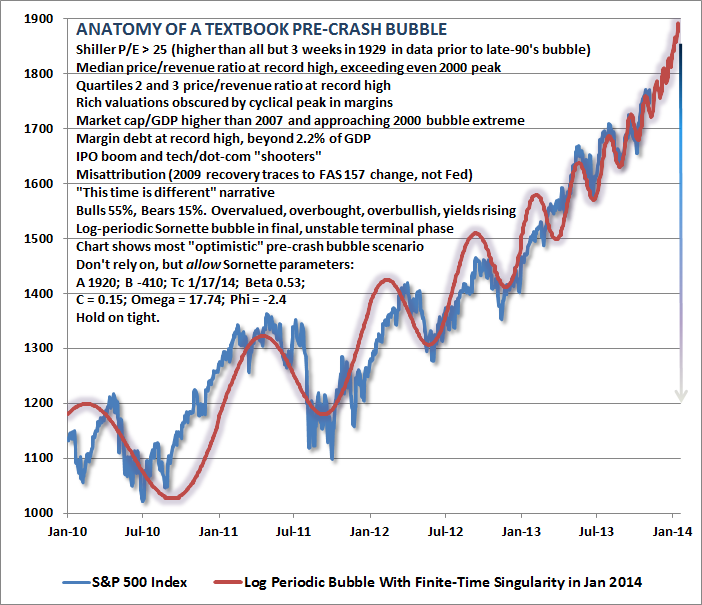
As economist Didier Sornette observed in Why Markets Crash, numerous bubbles in securities and other asset markets can be shown to follow a “log periodic” pattern where the general advance becomes increasingly steep, while corrections become both increasingly frequent and gradually shallower. I’ve described this dynamic in terms of investor behavior that reflects increasingly immediate impulses to buy the dip.


Along with this pattern, which has emerged with striking fidelity since 2010, we observe a variety of other features typically associated with dangerous extremes:

  • unusually rich valuations on a wide variety of metrics that actually have a reliable correlation with subsequent market returns; margin debt at the highest level in history and representing 2.2% of GDP (eclipsed only briefly at the 2000 and 2007 market extremes);
  • a blistering pace of initial public offerings – back to volumes last seen at the 2000 peak – featuring “shooters” that double on the first day of issue;
  • confidence in the narrative that “this time is different” (in this case, the presumption of a fail-safe speculative backstop or “put option” from the Federal Reserve); lopsided bullish sentiment as the number of bearish advisors has plunged to just 15% and bulls rush to one side of the boat;
  • record issuance of covenant-lite debt in the leveraged loan market (which is now spreading to Europe);
  • and a well-defined syndrome of “overvalued, overbought, overbullish, rising-yield” conditions that has appeared exclusively at speculative market peaks – including (exhaustively) 1929, 1972, 1987, 2000, 2007, 2011 (before a market loss of nearly 20% that was truncated by investor faith in a new round of monetary easing), and at three points in
    2013: February, May, and today (see A Textbook Pre-Crash Bubble).

Many of us in the financial world know these to be classic features of speculative peaks, but there is career risk in responding to them, so even those who view the situation with revulsion can't seem to tear themselves away.


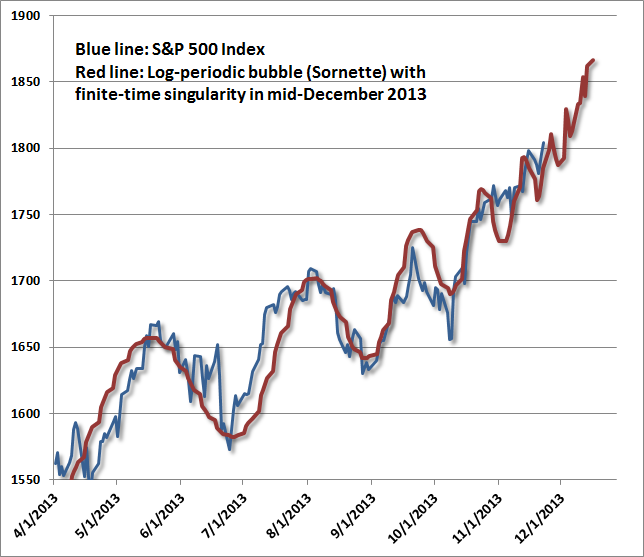
While I have no belief that markets follow any mathematical trajectory, the log-periodic pattern is interesting because it coincides with a kind of “signature” of increasing speculative urgency, seen in other market bubbles across history. The chart above spans the period from 2010 to the present. What’s equally unsettling is that this speculative behavior is beginning to appear “fractal” – that is, self-similar at diminishing time-scales. The chart below spans from April 2013 to the present. On this shorter time-scale, Sornette’s “finite time singularity” pulls a bit closer – to December 2013 rather than January 2014, but the fidelity to this pattern is almost creepy. The point of this exercise is emphatically not to lay out an explicit time path for prices, but rather to demonstrate the pattern of increasingly urgent speculation – the willingness to aggressively buy every dip in prices – that the Federal Reserve has provoked.


via Zero Hedge http://feedproxy.google.com/~r/zerohedge/feed/~3/lrIbnXsG6tE/story01.htm Tyler Durden

Why The Fed Can’t See A Bubble In Equity Valuations

In 'An Open Letter To The FOMC' John Hussman lays out in detail the true state of the world that asset-gatherers and Fed members alike seem blinded to. The intent of his letter is not to criticize, but hopefully to increase the mindfulness of the FOMC as to historical evidence, the strength of various financial and economic relationships, and the potentially grave consequences of further extreme and experimental monetary policy. Crucially, as we have heard numerous times in the last few weeks, the Fed sees no bubble, and so, a courtesy to both the investing public and the gamblers at the Fed, Hussman explains the reason that the Fed does not see an “obvious” stock market bubble (to use a word regularly used by Governor Bullard, as if to imply that misvaluations cannot exist unless they smack their observers with a two-by-four).


Excerpted from John Hussman's "Open Letter To The FOMC",


The reason that the Fed does not see an “obvious” stock market bubble (to use a word regularly used by Governor Bullard, as if to imply that misvaluations cannot exist unless they smack their observers with a two-by-four) is because while price/earnings multiples appear only moderately elevated, those multiples themselves reflect earnings that embed record profit margins that stand about 70% above their historical norms.

We can demonstrate in a century of evidence that a) profit margins are mean-reverting and inversely related to subsequent earnings growth, b) margin fluctuations are largely driven by cyclical variations in the combined savings of households and government, and importantly, c) valuation measures that normalize or otherwise dampen cyclical variation in profit margins are dramatically better correlated with actual subsequent outcomes in the equity markets.


[ZH: READ THAT AGAIN!!]


A few additional charts will drive this point home. The chart below shows the S&P 500 price/revenue ratio (left scale) versus the actual subsequent 10-year nominal total return of the S&P 500 over the following decade (right scale, inverted). Market valuations on this measure are well above any point prior to the late-1990’s market bubble. Indeed, if one examines the stocks in the S&P 500 individually, the median price/revenue multiple is actually higher today than it was in 2000 (smaller stocks were more reasonably valued in 2000, compared with the present). This is a dangerous situation. In this context, the dismissive view of FOMC officials regarding equity overvaluation appears misplaced, and seems likely to be followed by disruptive financial adjustments.


One obtains a similar view, with equal historical reliability, from the ratio of nonfinancial equity capitalization to nominal GDP, using Federal Reserve Z.1 Flow of Funds data. On this measure, equities are already beyond their 2007 peak valuations, and are approaching the 2000 extreme. The associated 10-year expected nominal total return for the S&P 500 is negative.


The unfortunate situation is that while the required financial adjustment may or may not be as brutal for investors as in 2007-2009, or 2000-2002, or 1972-1974, when the stock market lost half of its value from similar or lesser extremes, the consequences of extremely rich valuation cannot be undone by wise monetary policy. The Fed has done enough, and perhaps dangerously more than enough. The prospect of dismal investment returns in equities is an outcome that is largely baked-in-the-cake. The only question is how much worse the outcomes will be as a result of Fed policy that has few economic mechanisms other than to encourage speculative behavior.

And of course this speculative behavior ends with only one feature – bubble risk…

A discussion of bubble risk would be incomplete without defining the term itself. From an economist’s point of view, a bubble is defined in terms of differential equations and a violation of “transversality.” In simpler language, a bubble is a speculative advance where prices rise on the expectation of future advances and become largely detached from properly discounted fundamentals. Put another way, a bubble reflects a widening gap between the increasingly extrapolative expectations of market participants and the prospective returns that can be estimated through present-value relationships linking prices and likely cash flows.


As economist Didier Sornette observed in Why Markets Crash, numerous bubbles in securities and other asset markets can be shown to follow a “log periodic” pattern where the general advance becomes increasingly steep, while corrections become both increasingly frequent and gradually shallower. I’ve described this dynamic in terms of investor behavior that reflects increasingly immediate impulses to buy the dip.


Along with this pattern, which has emerged with striking fidelity since 2010, we observe a variety of other features typically associated with dangerous extremes:

  • unusually rich valuations on a wide variety of metrics that actually have a reliable correlation with subsequent market returns; margin debt at the highest level in history and representing 2.2% of GDP (eclipsed only briefly at the 2000 and 2007 market extremes);
  • a blistering pace of initial public offerings – back to volumes last seen at the 2000 peak – featuring “shooters” that double on the first day of issue;
  • confidence in the narrative that “this time is different” (in this case, the presumption of a fail-safe speculative backstop or “put option” from the Federal Reserve); lopsided bullish sentiment as the number of bearish advisors has plunged to just 15% and bulls rush to one side of the boat;
  • record issuance of covenant-lite debt in the leveraged loan market (which is now spreading to Europe);
  • and a well-defined syndrome of “overvalued, overbought, overbullish, rising-yield” conditions that has appeared exclusively at speculative market peaks – including (exhaustively) 1929, 1972, 1987, 2000, 2007, 2011 (before a market loss of nearly 20% that was truncated by investor faith in a new round of monetary easing), and at three points in 2013: February, May, and today (see A Textbook Pre-Crash Bubble).

Many of us in the financial world know these to be classic features of speculative peaks, but there is career risk in responding to them, so even those who view the situation with revulsion can't seem to tear themselves away.


While I have no belief that markets follow any mathematical trajectory, the log-periodic pattern is interesting because it coincides with a kind of “signature” of increasing speculative urgency, seen in other market bubbles across history. The chart above spans the period from 2010 to the present. What’s equally unsettling is that this speculative behavior is beginning to appear “fractal” – that is, self-similar at diminishing time-scales. The chart below spans from April 2013 to the present. On this shorter time-scale, Sornette’s “finite time singularity” pulls a bit closer – to December 2013 rather than January 2014, but the fidelity to this pattern is almost creepy. The point of this exercise is emphatically not to lay out an explicit time path for prices, but rather to demonstrate the pattern of increasingly urgent speculation – the willingness to aggressively buy every dip in prices – that the Federal Reserve has provoked.


via Zero Hedge http://feedproxy.google.com/~r/zerohedge/feed/~3/lrIbnXsG6tE/story01.htm Tyler Durden

The 10 Corporations That Control Almost Everything You Buy

We know the ten “people” that run the world, that 25 cities represent over half the world’s GDP, and that the world’s billionaires control a stunning $33 trillion in net worth… but who controls what the average joe-sixpack on Main Street buys? As PolicyMic notes, these ten mega corporations control the output of almost everything we buy – from household products to pet food and from jeans to jello. The so-called “Illusion of Choice,” that these corporations (and their nepotistic inter-relationships) create is remarkable…

(click image for gigantic legible version)

(Note: The chart shows a mix of networks. Parent companies may own, own shares of, or may simply partner with their branch networks. For example, Coca-Cola does not own Monster, but distributes the energy drink. Another note: We are not sure how up-to-date the chart is. For example, it has not been updated to reflect P&G’s sale of Pringles to Kellogg’s in February.)


Via PolicyMic,

Here are just a few examples: Yum Brands owns KFC and Taco Bell. The company was a spin-off of Pepsi. All Yum Brands restaurants sell only Pepsi products because of a special partnership with the soda-maker.


$84 billion-company Proctor & Gamble — the largest advertiser in the U.S. — is paired with a number of diverse brands that produce everything from medicine to toothpaste to high-end fashion. All tallied, P&G reportedly serves a whopping 4.8 billion people around the world through this network.


$200 billion-corporation Nestle — famous for chocolate, but which is the biggest food company in the world — owns nearly 8,000 different brands worldwide, and takes stake in or is partnered with a swath of others. Included in this network is shampoo company L’Oreal, baby food giant Gerber, clothing brand Diesel, and pet food makers Purina and Friskies.


Unilever, of soap fame, reportedly serves 2 billion people around the world, controlling a network that produces everything from Q-tips to Skippy peanut butter.


via Zero Hedge http://feedproxy.google.com/~r/zerohedge/feed/~3/slbk6-ZzctQ/story01.htm Tyler Durden

A Look Inside The "New Normal" McMansion

And they’re back:

  • 2,277 sq.ft. – Median new-home size in 2007
  • 2,306 sq. ft. – Median new-home size in 2012

Just as that crowning achievement of the last housing bubble, the McMansions, have once again returned with the second and final return of the Fed-blown housing bubble, the Bluths picked a perfect time to also come bac on the scene.

But back to the triumphal return of McMansions.

Readers will recall that one of the prevailing themes in the early post-depression years, was a return to thrift – in spending and in housing size – and after the median home size hit a record high of 2,277 square feet in 2007, it declined progressively in the following two years according to Census Bureau figures (we can only assume these were not manipulated unlike the jobs numbers). As David Rosenberg at the time, and as the NYT pointed out a day ago, “It seemed that after more than a decade of swelling domiciles, the McMansion era was over. But that conclusion may have been premature.”

Because as data from 2010 and onward shows, now only is American fascination with size, in this case of one’s home, back but it has never been more acute:

In 2010, homes starting growing again. By last year, the size of the median new single-family home hit a record high of 2,306 square feet, surpassing the peak of 2007. And new homes have been getting more expensive, too. The median price reached $279,300 in April this year, or about 6 percent higher than the pre-recession peak of $262,600, set in March 2007. The numbers are not adjusted for inflation.

However, since we have already covered the return of the housing (and all other) bubbles previously, we will not comment on how the Fed is once again doing everything in its power to bring about the biggest credit and housing bubble crash in history. The NYT has done a rather good and concise job of that:

 Yet the economy remains weak. How can Americans keep buying bigger and more expensive homes? It turns out, of course, that not everyone can.


“It’s all about access to credit,” said Rose Quint, an economist at the National Association of Home Builders. “People who are less affluent and have less robust employment histories have been shut out of the new home market. As a result, the characteristics of new homes are being skewed to people who can obtain credit and put down large down payments, typically wealthier buyers.”


It’s another sign that in today’s economy, prosperity is not universally shared.

Much more can be added here, although at the end of the day all signs point, as usual, to the Fed and its “reflate everything” panacea.

So instead of analyzing the prevailing Keynesian lunacy in which one needs asset bubbles to fix the aftermath of prior asset bubbles, we will simply constrain ourselves to discussing… interior decoration.

The infographic below from BusinessWeek shows how times, and tastes, how to decorate one’s McMansion have changed in the past few years.


via Zero Hedge http://feedproxy.google.com/~r/zerohedge/feed/~3/7dC0YYCusGI/story01.htm Tyler Durden

A Look Inside The “New Normal” McMansion

And they’re back:

  • 2,277 sq.ft. – Median new-home size in 2007
  • 2,306 sq. ft. – Median new-home size in 2012

Just as that crowning achievement of the last housing bubble, the McMansions, have once again returned with the second and final return of the Fed-blown housing bubble, the Bluths picked a perfect time to also come bac on the scene.

But back to the triumphal return of McMansions.

Readers will recall that one of the prevailing themes in the early post-depression years, was a return to thrift – in spending and in housing size – and after the median home size hit a record high of 2,277 square feet in 2007, it declined progressively in the following two years according to Census Bureau figures (we can only assume these were not manipulated unlike the jobs numbers). As David Rosenberg at the time, and as the NYT pointed out a day ago, “It seemed that after more than a decade of swelling domiciles, the McMansion era was over. But that conclusion may have been premature.”

Because as data from 2010 and onward shows, now only is American fascination with size, in this case of one’s home, back but it has never been more acute:

In 2010, homes starting growing again. By last year, the size of the median new single-family home hit a record high of 2,306 square feet, surpassing the peak of 2007. And new homes have been getting more expensive, too. The median price reached $279,300 in April this year, or about 6 percent higher than the pre-recession peak of $262,600, set in March 2007. The numbers are not adjusted for inflation.

However, since we have already covered the return of the housing (and all other) bubbles previously, we will not comment on how the Fed is once again doing everything in its power to bring about the biggest credit and housing bubble crash in history. The NYT has done a rather good and concise job of that:

 Yet the economy remains weak. How can Americans keep buying bigger and more expensive homes? It turns out, of course, that not everyone can.


“It’s all about access to credit,” said Rose Quint, an economist at the National Association of Home Builders. “People who are less affluent and have less robust employment histories have been shut out of the new home market. As a result, the characteristics of new homes are being skewed to people who can obtain credit and put down large down payments, typically wealthier buyers.”


It’s another sign that in today’s economy, prosperity is not universally shared.

Much more can be added here, although at the end of the day all signs point, as usual, to the Fed and its “reflate everything” panacea.

So instead of analyzing the prevailing Keynesian lunacy in which one needs asset bubbles to fix the aftermath of prior asset bubbles, we will simply constrain ourselves to discussing… interior decoration.

The infographic below from BusinessWeek shows how times, and tastes, how to decorate one’s McMansion have changed in the past few years.


via Zero Hedge http://feedproxy.google.com/~r/zerohedge/feed/~3/7dC0YYCusGI/story01.htm Tyler Durden