The Battle Royale: Stocks Versus Bonds (Which Is Right?)

The Battle Royale: Stocks Versus Bonds (Which Is Right?)

Authored by Michael Lebowitz via RealInvestmentAdvice.com,

The S&P 500 is at valuations higher than those in 1929 and rival those of 1999. Despite a recession, the index is 25% above where it was trading before the pandemic. The equity stampede is undoubtedly bullish about corporate earnings prospects and, by default, economic growth.  

As the stock bulls party, bond investors are glum about future economic prospects. Bond yields are below where they were before the pandemic started. Current yields warn of paltry economic growth and little inflation in the future.

Who has it right? (My colleague Lance Roberts touched on this issue in this past weekend’s newsletter.)

Flipping Valuations

Traditional equity valuation analysis frequently involves the comparison of a fundamental metric to share price. The result is often interpreted as quantifying the richness or cheapness of the numerator in the ratio. In the case of the more popular metrics like P/E or P/BV, that is price. 

By assuming the price is fair, we can reverse traditional logic and calculate what the market implies for the denominator.

For example, assume the P/E ratio on XYZ stock jumps to 20 after lingering around 10 for decades. With this knowledge, we can make one of two assumptions.

  • The price of XYZ is twice as high as it should be

  • XYZ’s earnings are going to grow at twice the historical rate in the future.

The first bullet point assumes XYZ’s price must decline to bring its valuation to fair value. The second bullet point assumes XYZ’s earnings must increase to get its valuation to fair value.

The Peak Concept

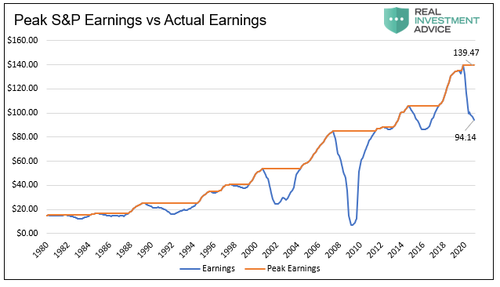
Before diving in, it’s important to note we use peak earnings and peak GDP throughout this analysis. Peak means we use the highest level of earnings or GDP at each point in time. This method helps eliminate anomalies and better focus on more durable trends. For example, the current peak earnings per share of the S&P 500 is $139.47/share, the highwater mark from 2019. The current level is $94.14. The peak P/E is only 26.50, as compared to the actual P/E of 39. 

The graph below compares peak S&P 500 earnings per share to actual earnings per share. As shown, peak earnings reduce volatility and better focus on the trend.

S&P Earnings Expectations

To calculate the implied growth rates of future earnings and economic activity, let’s look at the peak P/E of the S&P 500 and assume its price S&P 500 is fairly valued.

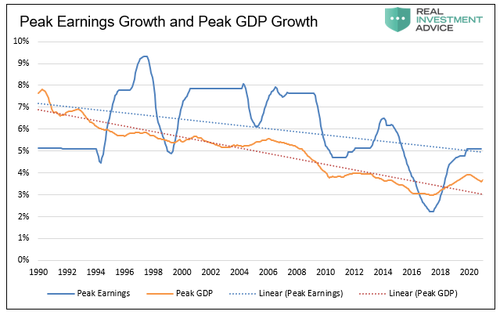
The following graph compares the secular peak earnings growth rate (blue) to the secular peak GDP growth rate. There are two important takeaways.

  • Earnings and GDP are well correlated

  • Both have been trending lower for the past 40 years

So, with an understanding of economic and earnings growth trends, we have context for comparison to market expectations.

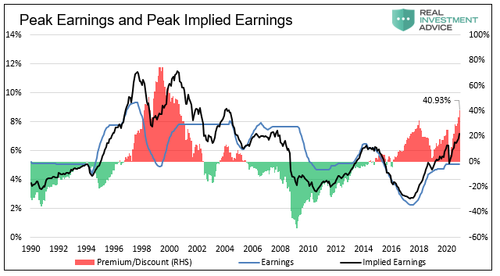
Based on the current peak P/E versus the 20-year average and assuming the price is fair, the market implies earnings growth for the next ten years of 7.17%. By looking at the graph above, we can see it is more than 2% above the trend.

The following graph compares implied earnings growth (black) to the trend earnings growth shown(blue). The current and historical difference is highlighted in red and green.

Stock investors are betting that earnings growth (blue) will accelerate markedly and reverse the multiple decade-long trends. Such implies that GDP growth rates will also turn up.

It is worth highlighting the cyclicality of earnings forecasting errors, as shown in red and green. Periods in which forecasts were higher than actual earnings are often followed by periods where the market underestimates earnings.

We remind you: “Periods in which equities are overpriced with high valuations are followed by periods with lower returns. Conversely, periods when stocks are cheap, are often followed by periods of strong returns.” From our article: Are You Playing Roulette With Your Retirment?

Bonds

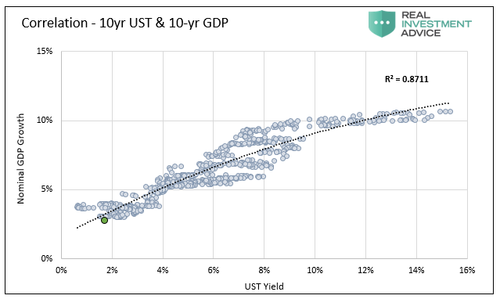
Bond yields, like corporate earnings, track nominal GDP exceptionally well. Assessing what bond yields tell us about implied future growth is straightforward as we directly compare yields to peak GDP growth rates. The graph below shows the significant statistical correlation between 10-year bond yields and 10-year nominal GDP growth.

As represented by the green dot, the current ten-year yield is 1.72%, and the ten-year nominal GDP growth rate is 3.71%.

The bond market currently implies sub 2% GDP growth, well below the current trend. Bond yields expect the decades-long trend lower in GDP growth to continue. By default, bond investors forecast earnings growth will continue to trend downward.

Place Your Bets – Bonds

Bond yields argue for longer-term economic trends continuing. Stock prices imply earnings and economic growth will accelerate meaningfully, reversing long-term trends.

Supporting the bond market’s view are the macroeconomic headwinds we frequently discuss. For economic growth rates to rise, we need to see productivity and or demographic trends reverse.

Barring a significant reversal of immigration policy, demographics will continue to contribute less to economic growth. In fact, the Census Bureau just announced the U.S. population grew at its slowest rate since the 1930s, and prior to that, the late 1700s. They attribute the decline to low rates of immigration and births.

Productivity growth depends on capital expenditures, education, employee training, and new technologies. There are few signs spending in these areas is occurring at any greater rate than it has in the past decade. Worse, COVID-related stimulus and related spending point to a surge in non-productive debt and consumption. The additional non-productive debt burden will further hamper productivity growth.

Unfortunately, the recent surge in the amount of debt is likely to do little for future growth. As Lance Roberts discussed, “Debt Doesn’t Create Growth.”

“More debt doesn’t lead to more robust economic growth rates or prosperity. Since 1980, the overall increase in debt has surged to levels that currently usurp the entirety of economic growth. With economic growth rates now at the lowest levels on record, the change in debt continues to divert more tax dollars away from productive investments into the service of debt and social welfare.”

Place Your Bets Stocks

While the equity bulls must contend with well-established trends, they do have a couple of cards up their sleeve. For starters, the nation runs a $4 trillion annual deficit which is significantly boosting economic activity. While more debt will impede longer-term growth, fiscal stimulus will flow through to corporate earnings for the time being. Further, it’s not unreasonable to think that massive deficits will continue well beyond the end of the pandemic.

Second, the Fed seems intent on generating inflation. If they do, earnings will be boosted artificially by inflation. However, valuations tend to shrink in inflationary periods, which may not be so bullish for stock prices.

Summary

Our bet is with the bond investors. Earnings will recover as spurts of temporary inflation and massive fiscal spending ripple through corporate income statements. However, the fiscal and monetary pandemic response only strengthens our resolve that economic growth rates will continue to trend lower.  

The only difference between the response to the 2008 financial crisis is the government and Fed did more of it this time. The economic growth rate following the financial crisis was weaker than the prior expansion. Given the same stimulus playbook is being used, albeit to a more considerable degree, we can only assume the results will be similar.

Tyler Durden
Wed, 04/28/2021 – 11:27

via ZeroHedge News https://ift.tt/32VJd8d Tyler Durden
Goldman Is Surprised At How “Narrow” Biden’s $1.8TN American Families Act Is: Full Reaction

Goldman Is Surprised At How “Narrow” Biden’s $1.8TN American Families Act Is: Full Reaction

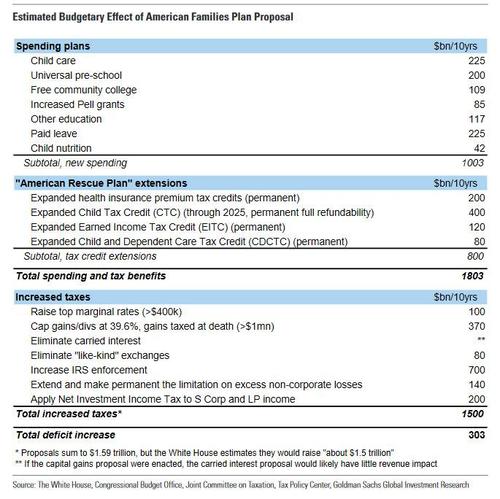
Earlier today, we previewed Joe Biden’s American Families Plan (AFP) which provides $1.8 trillion over ten years in new benefit spending and tax credits.

Commenting on the proposal, Goldman economist Alec Phillips writes that he was surprised by the focus of the released plan which is “somewhat narrower than we had initially expected several weeks ago, as it omits any housing or Medicare proposals and focuses solely on child care and nutrition,education, paid leave, and extending a number of the tax credits Congress enacted earlier this year.”

On the payment side, the White house proposes $1.5 trillion over ten years in additional taxes to cover most of the cost, with a capital gains tax hike contributing to this, but in today’s release the White House has provided few new details on the topic. The $303BN funding balance will come from an increase in the US budget deficit.

Biden will present the plan when he addresses a joint session of Congress at 9pm ET tonight.

Below we list the main points from the plan as summarized by Goldman:

1. The spending would be spread roughly evenly over the next ten years.

The White House release provides no details on the timing of spending, but judging by the types of spending President Biden proposes, it appears that the spending will be spread roughly evenly over the next ten years. An exception would be the expanded child tax credit that Congress recently enacted, which Biden proposes to extend only through 2025 (he proposes to make permanent a less expensive aspect of recent expansion). However, in essentially all other cases, the White House appears to propose to make these policies permanent. Some policies appear to phase in over several years (e.g., the paid leave proposal). The plan would increase federal spending (including tax credits) by around 0.75% of GDP in 2023-2024, and by a bit less in 2022, according to Goldman calculations.

2. The proposed savings from IRS enforcement are likely to look smaller once they reach Congress.

The White House estimates the proposal would produce $1.5 trillion in additional revenue, of which $700bn would come from closing the gap between what taxpayers owe and what they pay. The White House proposes to require banks to increase reporting of financial flows to the IRS, and to increase funding for IRS enforcement activities (media reports indicate this would raise $80bn over ten years, but the proposal does not include a figure). But according to Goldman, Congressional Democrats might have to look elsewhere to gain this much revenue. A reporting requirement is probably beyond what is allowed to be included in a reconciliation bill, and congressional budget scorekeepers seem unlikely to credit additional IRS funding with $700bn in new revenue. (Last year, CBO estimated a $40bn/10yr bump in funding would produce $100bn in additional revenue, for total savings of $60bn.)

3. The proposed capital gains tax hike also looks likely to face resistance.

President Biden proposes to tax capital gains and dividends at the top marginal rate (39.6%) and to tax gains greater than $1mn at death (under current law, the basis of an asset steps up at death to the transfer value, so the recipient has no taxable gain upon receiving it). The Tax Policy Center has estimated such a policy would raise around $370bn/10yrs. Even with exceptions for active businesses and even with a long payment schedule for any payments due—a recent congressional proposal would allow such taxes to be paid over 15 years — it seems likely that at least a few Democrats will raise concerns about the impact on family businesses and farms. In our view, a capital gains tax increase looks more likely to come in around 28% and to eliminate the step-up in basis at death but to stop short of actually taxing those gains upon death.

4. Health care is notably absent from the proposal.

The proposal includes an extension of the recently expansion of health insurance subsidies, but it omits the other Biden campaign proposals, like lowering the Medicare eligibility age to 60. The proposal also omits a substantial drug pricing reform proposal that the House passed last year and which might have cut Medicare drug spending by as much as $500bn over ten years. The omission is likely due to expected resistance from a few congressional Democrats whose support would have been necessary to pass the bill, and the fact that some of the proposal also omits the Medicare eligibility change. That said, there is still a chance that Congress will include more incremental savings measures in the upcoming legislation.

5. Congress will want to add and subtract.

At a minimum, we expect that congressional Democrats will want to add a reinstatement of the deduction for state and local taxes (SALT) that congressional Republicans capped in 2017. The policy would cost on the order of $80bn per year, or $400bn to reinstate it through 2025, after which it is already set to revert to the pre-2017 policy. Since most of the benefit would go to those with very high incomes, it looks unlikely that there will be sufficient support to fully reinstate it. Instead, we expect Congress to raise the cap to something like $50k,or reinstate it for taxpayers under a certain income threshold, which could be done at a fraction of the cost. Congressional Democrats might also have to choose among some of the new spending proposals, since Senate rules prohibit reconciliation bills from adding to the deficit after ten years. If the capital gains tax hike is scaled back or the IRS enforcement funding raises less revenue than the White House claims, some provisions will need to be made temporary or dropped from the bill.

6. The legislative strategy should be clearer in a few weeks.

Goldman outlined three potential scenarios for passing the White House proposal:

  1. pass one large reconciliation bill comprising the American Jobs Plan and the American Families Plan;
  2. pass two smaller reconciliation bills dealing with those separately, or
  3. pass bi-partisanbills dealing with traditional infrastructure and, separately, manufacturing and R&D incentives, with the remainder passing in a single reconciliation bill.

All 3 options appear to be under discussion. The congressional committees that handle infrastructure are assembling legislation they hope to pass under regular order (i.e., with bipartisan support), as are the committees dealing with manufacturing and R&D. They appear to be aiming for passage by late May or June.

7. The details will probably remain in flux until Q3.

Over the next several weeks, additional information on these proposals (particularly the scope of potential tax increases) is likely to come in three forms. First, informal comments in the media from centrist Democrats might clarify where the boundaries are on some issues. Second, at some point in May, the Biden Administration should submit a formal budget to Congress (so far the White House has sent only a partial proposal). This is also likely to include more technical detail on the proposed tax increases. Third, the committees with jurisdiction over some of the relevant issues—such as the tax-writing committees—are likely to begin to release details of their legislation that builds on the Biden proposal. However, the most important step in the process won’t come until July or September, which is when we expect the Senate to debate and pass the reconciliation bill. This process can be unpredictable, since congressional Republicans are apt to offer hundreds of amendments to the bill, some of which centrist Democrats might feel political pressure to support.

Tyler Durden
Wed, 04/28/2021 – 11:07

via ZeroHedge News https://ift.tt/2S2sP3u Tyler Durden
Worry About The Real Stuff…

Worry About The Real Stuff…

Authored by Bill Blain via MorningPorridge.com,

“A ship in harbour is safe, but that is not what ships are for..”

There are plenty of positive news stories emerging as the global economy reopens, but also an increasing number of real-world tangible threats emerging. The Pandemic has affected economies from top to bottom, and many issues won’t be resolved overnight. For markets the issues to consider aren’t just inflation or market bubbles, but how supply chain issues and instability could continue to impact sentiment.

The ongoing Covid horrors in India, and yet more negative politics noise is dominating the new screens, but the global economy is reopening fast. Ignore the doomsters and focus on the reality… the global economy is open, and that means a host of new supply chain, logistics and market pricing crises to worry about! Yay!

This morning there is plenty of positive news. South Korea’s economy posted brisk Q1 growth after a shocking 2020. The Germans have lifted their expectations for 2021 growth to 3.5% and 3.6% in 2022 on the back of recovery. (Wow, if even Europe is recovering, there must be hope.) The UK’s Confederation of Industry (CBI) is ultra-positive, reporting the sharpest upturn since 2018 in sales as the British economy reopens. There is equally positive news from around the planet.

Of course, there will always be problems – like the rumours of a planned right- wing coup in France (a number of retired generals apparently hankering for a repeat of the Algeria crisis). Or how about yet more allegations of Tory Sleaze…? Yawn! (If you voted for Boris on the basis of his integrity, then more fool you..) The Biden Tax hikes are getting all kinds of attention, and could impact market sentiment – although its largely a case of outraged Libertarians disbelieving the temerity of a President daring to propose they pay their fair-share.

But these political events are all intangibles. There is plenty of real stuff we should focus on in markets.

Housing

US Home Prices (aye, remember them….) surged 12% in February. That’s the biggest jump since 2006… which is one year before things went to hell in a handbasket on the back of a US housing bubble driven by over-easy money.. Hmmmm.. housing boom, easy money? What’s that ding-ding-ding sound in the back of my head?

There are some really interesting trends in the US homes data – like the hottest property areas are up in the Rocky Mountains. The median US home gained $36k over the last year.  Prices rose in all the 20 major US cities covered by the Case-Shiller indiex – Phoenix, San Diego and Seattle were top performers.

The gains in US homes – and here in the UK – is fuelled on the same old reasons – lack of supply, FOMO fears of missing out and being unable to get the ladder, and now on folks moving to find better places to live than dirty old cities if they can work from home The pandemic has allowed home buyers to build up savings, and the home market is an obvious place to put it – especially when interest rates are so low.

Bingo! That’s the danger: more money chasing a limited number of assets! Home prices are being fuelled on a relative interest rate effect. The gains from housing look much more attractive than savings, so folk are borrowing more (at ultra-low rates) to spend on housing. A boom is fuelling a boom. Home prices are suffering from similar distortions as we’ve seen drive financial asset prices (stocks and shares)!

Dare I suggest a bubble is forming in home prices? Someone is bound to tell me not to worry – house prices always rise…. Don’t they?

Global Shipping and Inventory

It’s not just semiconductor chips that are in short-supply. As the blockage in the Suez demonstrated, its shipping and the logistics involved to get goods to consumers that enables spending. Get it wrong, or de-stablise the process, and the whole global economy goes into shock. If the Chinese want to administer a coup-de-grace to the Western Economy, then hacking Amazon into shut-down would be a place to start.

Over the last few months we’ve seen container ship box rates balloon up to 4x higher – but speaking to a ship broker yesterday he believes rates will normalise. That may change on any geopolitical instability, but rates will largely depend on levels of global inventory.

There is genuine scarcity of chips, which is being addressed by new production. There is also scarcity of goods that were in high demand through the pandemic – for instance, exercise bike production cannibalised the production of normal bikes which remain in short supply. It will take time for furloughed and closed business to resume production – which will drive scarcity price hikes.

That scarcity affects everything from fridges to plane engines – which in turn will impact shipping. If the shippers aren’t getting paid for transporting fridges and toasters, they will seek ways to hike their prices for other goods, but shipping costs could normalise in the short-term because of shortages of goods in transit, rather than the global economy regaining equilibrium.

As inventories recover, we could see shipping prices stage a sharp rise again. A sudden spike in shipping, driven by recovery or through instability (like Taiwan) could well spook markets.

Iron and Steel  

China has been in the grip of a strong recovery since last year– earlier this week, steel futures set new record highs. Iron ore prices are also at new tops. Prices for steel products in China (and therefore elsewhere) are set to rise – fuelled partly on the back of expectations prices are set to rise, but also on fears the Chinese government’s plan to reduce steel production to look climate compliant will create shortages. In short, it’s a hot market for steel in China.

Now the rest of the world is playing catch up. Steel prices have tripled from the pandemic lows as manufacturing, home building, large construction projects and infrastructure, new retail and commercial building, and even shipbuilding are all reopening and demanding metal! I was reading about Swiss Steel Group – a speciality steel firm that’s seen Q1 sales increase 12%.

However, a number of critical bottlenecks are emerging– including access to shipping, getting mines reopened and sourcing new supplies when companies find their pre-covid suppliers have gone bust. Iron ore shipping prices spiked this month by over 25%, driven by China demand. Prices are close to the last peak in 2019. Everyone wants Capesize dry-bulk freighters to bring Brazilian and Australian coal to China!

A further bottleneck could emerge from the uncertainty around Liberty Steel – the aerospace industry has already warned the UK government that Airbus and Rolls Royce are vulnerable if there is any shortage in high strength steels. Trying to find alternative supplies in a market that’s in “take-off” would be very difficult – and any slowdown at Rolls Royce would have a massive multiplier effect on its supply chain.

One little know effect on steel prices is a lack of scrap metal. Scrapping old ships is a major source of high-quality scrap for new steel. India is a major source, but is closed due to new Covid strain hammering health services. There is also a shortage of oxygen as Indian supplies are all earmarked for hospitals – and as the news programmes reveal, a burgeoning black market in the gas. Bangladesh and Pakistan seem unaffected and are getting a much higher slice of the scrap market.

These are just three areas of the real economy worth watching; home prices, supply chains and raw materials. Will they create boom or bust, inflation or opportunity? Who knows? Keep an eye on the space.

Tyler Durden
Wed, 04/28/2021 – 10:46

via ZeroHedge News https://ift.tt/2QCtKr7 Tyler Durden

WTI Extends Gains, Above $64, As Gasoline Demand Hits Pre-Pandemic Levels

WTI Extends Gains, Above $64, As Gasoline Demand Hits Pre-Pandemic Levels

Oil prices are higher this morning, after dipping on API’s reported – and unexpected – crude build last night, as expectations strengthened for a revival in global consumption despite the resurgent pandemic in India and Brazil.

“The market expects a major revitalization for global oil demand from this summer onwards,” said Bjornar Tonhaugen, head of oil markets at Rystad Energy.

“As vaccination campaigns progress and as lockdowns are set to soon be lifted in Europe and other recovering economies, the need for road and jet fuels will increase and the result will be felt.”

All eyes for now on Crude stocks after last night (and the prior week’s) surprise build.

API

  • Crude +4.319mm (-200k exp)

  • Cushing +742k

  • Gasoline -1.288mm

  • Distillates -2.417mm (-1.2mm exp)

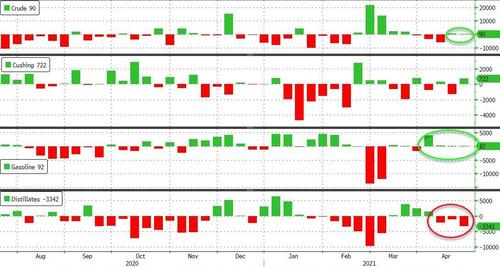
DOE

  • Crude +90k (-200k exp)

  • Cushing +722k

  • Gasoline +92k

  • Distillates -3.342mm (-1.2mm exp)

After the prior week’s surprise crude build (and API’s surprise crude build for this week), analysts continued to expect official data to show a modest draw… but instead we saw a very modest 90k build. Distillates saw a 3rd straight week of draws…

Source: Bloomberg

Gasoline Demand is back to pre-pandemic levels for this time of year…

Source: Bloomberg

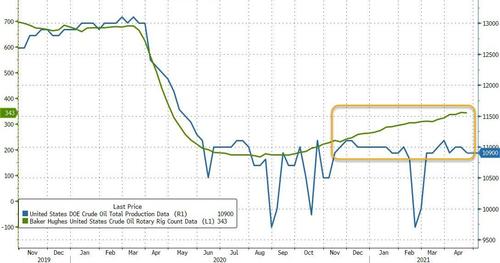
US crude production remains ‘disciplined’ despite rising rig counts and oil prices… for now…

Source: Bloomberg

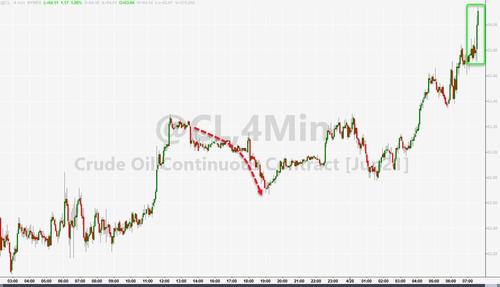
WTI was hovering around $63.80 ahead of the official data and extended gains on the rise in gasoline demand…

The surge in prices suggests confidence in the demand picture:

“Powerful reflation signals, a weaker dollar and a powerful recovery in US energy demand are all painting a brighter picture for demand down the road,” TD Securities commodity strategists led by Bart Melek said in a note.

“OPEC’s cautious approach could offer a window for higher prices should energy demand continue to rise at a fast clip amid spreading vaccinations and travel.”

But, the risks to the demand outlook are starting to show up in gauges of market health, however.

The structure of the Middle Eastern Dubai benchmark slumped on Wednesday to only a shallow backwardation – an indication that tightness in crude supplies may be easing.

Tyler Durden
Wed, 04/28/2021 – 10:35

via ZeroHedge News https://ift.tt/3aJOx2K Tyler Durden

Obituary: SPACs

Obituary: SPACs

Submitted by Thomas Kirchner of Camelot Portfolios

Obituary: SPACs

  • SPACs no longer trade at premiums.

  • Their total size exceeds potential merger opportunities.

  • Many SPACs will liquidate unglamorously.

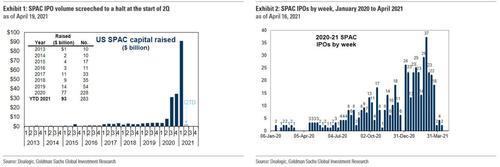
We last discussed SPACs in November, a few weeks before the mania went into overdrive. Since the beginning of April, however, issuance has crashed, as have SPAC prices. Despite being only one third into 2021, this year has already beaten prior year records with 308 SPACs raising just over $100 billioni, so a pause should not surprise anyone. Recent SPACs feature fashionable terms in their names such as “decarbonization” , “digital”, “climate” or “infrastructure” and often celebrities endorse the SPAC. Elon Musk seems to be the only celebrity not yet involved with a SPAC. But we believe he should, as we will explain below.

Return to rationality

Since late March, the market has found some sanity in pricing SPACs after their IPO and has returned to historical norms. While many SPACs traded at a premium to their $10 issuance price earlier this year, they have now returned to being priced at a discount to the per-share value of the trust account. (For readers not familiar with the mechanics of SPACs: IPO proceeds are placed in a trust account, which results in SPACs holding cash that is generally worth around $10 per share).

SPACs did not always trade at a premium to the issuance price, or to a premium to the cash trust. The return to this rational pricing alone could be called a bursting of a bubble. The mispricing earlier in the year was a strong sign of ignorance of many participants in the SPAC bubble. Moreover, while most SPACs traded at a premium to both the $10 issuance price and the value of the cash in trust, a small minority of SPACs held more than $10 in trust and had other shareholder-friendly features which would have justified a decent premium to $10. Yet, these SPACs traded at a discount to trust, albeit over $10. Clearly, many buyers bought SPACs without a rational understanding of the cash value.

but what is rational can be debated

The problem is: a case can be made for both that SPACs should trade at discounts or premia to trust cash. Which one is right depends on the bigger picture.

On average, SPACs rise by 11% after the announcement of a mergerii . Therefore, it would be rational for SPACs to trade at a premium to cash to anticipate some of that future upside.

However, if you expect that most SPACs will fail to complete an eventual merger and will liquidate and pay out its trust cash, then SPACs should trade at a discount to trust cash.

If we work backward, then we can conclude from many SPACs trading at a discount to trust cash that the market expects the liquidation of most of them. This is consistent with press reports that cast doubt on the availability of sufficient private companies to complete SPAC deals.

Too many SPACs?

It is a sign of a bubble that market participants overestimate the potential size of the market. We believe that this is the case in the current SPAC market. Companies seeking to go public have multiple options. SPACs are not just competing with traditional IPOs, but also with direct listings, of which we have seen several examples during the last few years.

427 SPACs with a total of $138 billion in cash are currently looking to do deals. This includes 57 large SPACs with more than $500 million cash each, whose firepower totals $40 billion iii. These large companies are competing directly with the traditional IPO, where the bookbuilding process can actually add value in establishing relationships with investors, something that is lacking in a SPAC merger.

If you consider that SPAC mergers are done only in part for cash and that some of the target company’s pre-merger stock is rolled into the post-merger listed company, the total value of potential transactions is a multiple of the cash held by current SPACs. We see many SPAC mergers completed at enterprise valuations that amount to 3-5 times the amount of cash held in trust. Therefore, the current $138 billion held in trust could complete mergers with a total valuation of $414-$690 billion.

How plausible is it that this can happen? For comparison, total IPO volume in 2019 was $46.3 billion spread over 235 companies iv. We use 2019 as a reference instead of 2020 because that year was not yet impacted by the Covid crisis. This number represents the cash raised in IPOs, not the aggregate valuation of the companies taken public. This means that SPACs currently looking for companies to take private would have to find enough targets to result in three times the 2019 IPO volume.

This is unlikely to happen. Therefore, many SPACs will have to liquidate after failing to find a suitable target. It makes sense if the majority of SPACs trade at a discount to cash.

Which SPACs are likely to fail and liquidate?

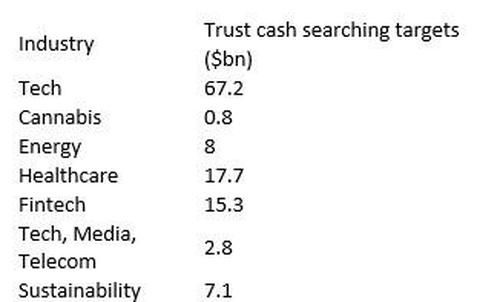
We can take this thought one step further and try to determine which SPACs are most likely to liquidate. SPACtrack.net has a helpful table that organizes SPACs by industry of prospective targets v:

Source: SPACtrack.net

SPACs are heavily geared to the technology sector, which is not a surprise because technology stocks tend to dominate the IPO market generally. With $67.2 billion currently in SPACs targeting this sector, technology alone would have to be twice the 2019 IPO volume. However, there is also ample supply of technology firms that need cash and would love to go public. Therefore, we believe that many of the SPACs in this group will complete a merger, although we would not expect them to be successful in the aggregate over a longer period of time as many of the targets will not be too early stage and will have low survival rates as they are common in venture capital-backed firms.

Particularly excessive also seems the dollar amount looking for fintech targets. While we have no doubt that there will more companies like Coinbase that will try to enter the public markets at very high valuations, we doubt that there are enough to allow SPACs to put $15 billion cash to work.

Healthcare, energy and sustainability are capital-intensive sectors where we believe that a few billion dollars can be invested without sponsors having to lower their standards and do bad deals for the sake of doing a deal.

What we find particularly striking is the small number of SPACs that target more traditional sectors such as finance (not fintech), mining and natural resources, consumer products and industrials (other than energy). Because of this scarcity, we believe that sponsors with expertise in these sectors should have an above-average likelihood of completing mergers that will turn out to be successful in the long run.

If Elon Musk had a SPAC for industrial and consumer products with a focus on the automotive industry we believe it could find a merger that could be successful long-term.

[i] spacresearch.com as of April 23, 2021.
[ii] Jason Draho,, Barry McAlinden, Jay Lee, Vincent Amaru: “SPACs: Investment considerations.” UBS, October 2, 2020. The analysis is based on SPACs that had an IPO and completed a merger between January 2018 and June 2020.
[iii] Camelot calculations based on spactrack.net data as of 4/23/21.
[iv] Source: Factset.
[v] spactrack.net/home/spacstats/ as of 4/23/21.

Tyler Durden
Wed, 04/28/2021 – 10:25

via ZeroHedge News https://ift.tt/332zUTP Tyler Durden

Goldman Goes All-In Commodities, Sees “Biggest Jump In Oil Demand Ever” Over Next 6 Months

Goldman Goes All-In Commodities, Sees “Biggest Jump In Oil Demand Ever” Over Next 6 Months

It’s time again for Goldman’s commodity permabulls to rise again.

Four months after the bank’s strategists declared the start of a new commodity supercycle, a declaration which quickly fizzled as oil slumped amid renewed covid shutdown fears and a bursting of the reflation trade, Goldman published a note overnight in which it goes “balls to the wall” long commodities, predicting that over the next six months we will see “the biggest jump in oil demand ever – a 5.2 mb/d rise over the next 6m, 50% larger than the next largest increase over that time frame since 2000 and almost twice as large as the biggest 6m supply rise since 2000.”

Here is the gist of Goldman’s argument:

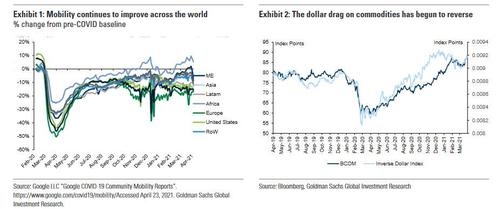
At the center of this recent period of consolidation in commodity prices was a plateau in activity levels due to renewed lockdowns in Europe, the shoulder months in commodity demand, and a macro headwind from a stronger dollar driven by rising rates. Now, all three of these factors are in the process of reversing.

Activity levels as measured by mobility have resumed their upward trajectory, particularly with the vaccination rollout in Europe now gaining momentum.

Alongside this resumption in rising activity levels is the seasonal upswing in transportation, manufacturing and construction that begins now and accelerates into June. It is important to remember that commodity markets are driven by volume, or the level of demand.  Simply put, when the volume of demand exceeds the volume of supply, a scarcity premium is created which cannot be priced in ex ante.

* * *

The magnitude of the coming change in the volume of demand– a change which supply cannot match – must not be understated. At the same time the commodity supply is near inelastic in the short run – you cannot dig another mine or grow another crop in a matter of months.

As a result, Goldman’s Jeffrey Currie writes that commodity markets have looked through a sharp rise in COVID cases in India, even as “the macro headwind has turned  into a tailwind with lower rates and a weaker dollar.”

In summary, Goldman now sees commodities rallying another 13.5% over the next six months, with oil reaching $80/bbl and copper reaching a new all time high of $11,000/t “with risks to the upside.”

Some more details from the report which is clearly having an (upward) impact on oil prices today:

You cannot price future tightness today:

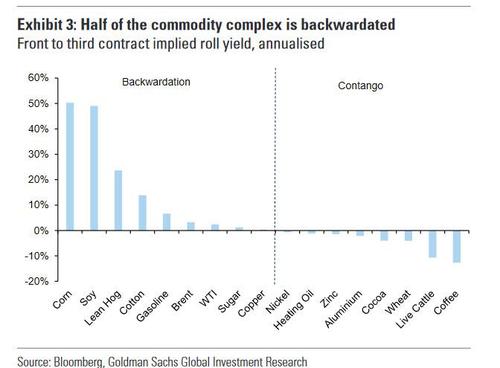
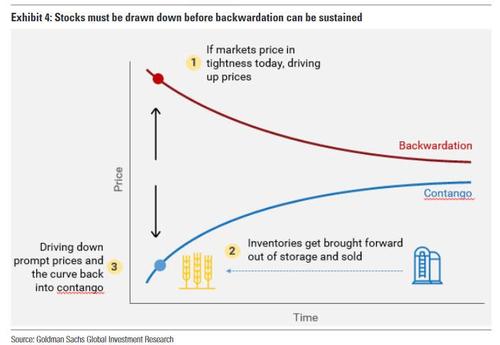
This expected surge in activity has been well flagged to the market. This begs the question – why haven’t commodities already priced this in? The key here is that commodities must price to equate the physical volume demand and supply in the market today – they cannot be forward-looking like equities. Stocks must be drawn down before a commodity scarcity premium – backwardation – can be sustained. If time spreads become backwardated in anticipation of future scarcity and tighter inventories, the current physical surplus would be pulled out of inventory and sold against the higher prompt prices, pushing the market back to where it started. Only physical scarcity can sustain backwardation, and importantly,backwardation is now in over half of all commodity markets (Exhibit 3).

This move toward backwardation across the complex also indicates a lack of inventories required to limit such rallies as physical markets get tighter. Precisely because commodities depend upon the level of demand, and only the level of demand exceeding the level of supply can create a physical scarcity premium in markets, can we be confident that sustained backwardation is showing us how commodity markets are becoming progressively tighter today.

Watch for the reopening re-rate in oil.

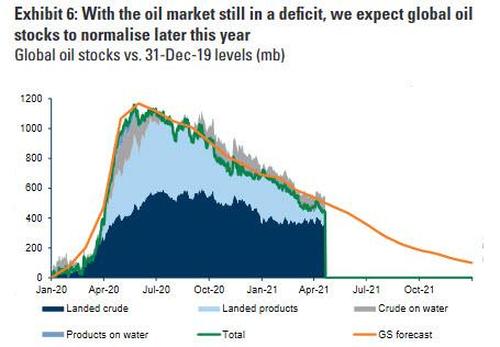
The level of global oil demand has been flat – around 95 mb/d over the past six months. While this was initially a positive surprise through the large second wave of COVID infections this past winter, it has become a speed bump to the recovery in oil prices so far this spring as demand levels flattened in India, Latin America, and parts of Europe. Importantly, we expect a significant rebound in global oil demand in coming months, key to our forecast for higher oil prices by this summer. First, we see a weakening link between lockdowns and economic activity/mobility due to more targeted policies and the ongoing ramp-up in vaccinations(with warmer weather likely to help as well). Cases already appear to be inflecting in Brazil, Chile and Europe, and plateauing in the first hit Indian state of Maharashtra. We are in turn seeing clear evidence of higher mobility in countries of advanced vaccination(US, Israel, UK), with for example US gasoline demand near 2019 levels and domestic jet demand up 20% since March.

As a result, we expect global oil demand to increase sharply by June, from 94.5 mb/d currently to 99 mb/d in 3Q21, as the pace of vaccination accelerates in Europe, finally unleashing pent-up travel demand. In particular,we expect the easing of international travel restrictions in May to lead global jet demand to recover by 1.5 mb/d (despite remaining 30% lower than pre-COVID levels this summer).

A broad-based policy-driven demand surge.

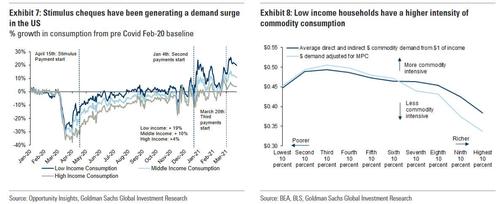
We stress that the tightness in commodity markets extends not only across the entire complex, but also across geographies and sectors, from the US, China and Europe, to construction, autos and retail. Everywhere is seeing large rises in the volume of demand. As we have argued since last year, at the center of this demand rise is a greater preference for tackling social need from policy-makers, rather than focus on macro-stability.  From the European Recovery Fund giving 50% of the funding to Italy and Spain, to President Biden’s latest stimulus package, the focus on lower-income households has been clear. Recent high-frequency data in the US show a large surge in late April consumption that was driven by the $1400 checks that went out to 80% of US households last month.

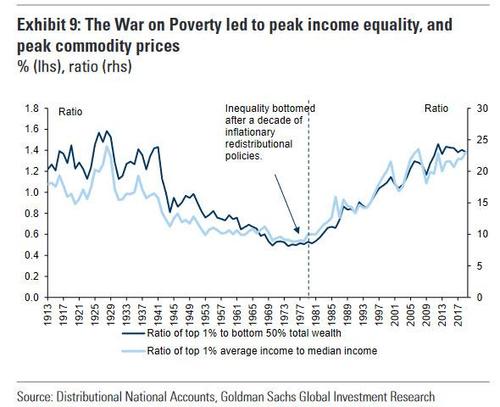
Policies to address income and wealth inequality shift unspent savings from a few high-income households to a large number of low-income households with a higher propensity to spend. Regardless of whether this is achieved through borrowing,taxing or other methods, it almost always assures the strong volumetric demand growth that lies behind an overheating economy and physical inflationary pressures. Today thisis visible in the US — from growing gasoline demand to greater meat consumption raising feed demand in grains. It’s perhaps no surprise, then, that all major commodity bull markets and inflationary episodes have been invariably tied to redistributional, or populist, policies that have reduced income and wealth inequality (Exhibit 9).

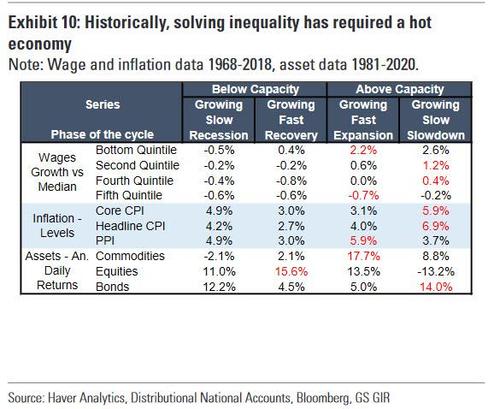
Indeed, we find that wage growth compression historically has only been achieved in overheatinge conomies as it requires reaching deep into the labor pool (Exhibit 10).

This can only occur late in the business cycle when scarcity makes sticky labor look more attractive than flexible capital.

Decarbonisation is now the backdrop for macro policy.

From discussion of a‘green leveling’ in the US to Chinese industrial policy based on ‘carbon security’, decarbonization is forming the overarching backdrop to a swathe of policy programs. This ascension of climate to policymaker’s top of mind reduces the left-tail risks to green capex, cementing the policy support at the center of our structural bull thesis for commodities. President Biden concluded his recent climate summit with a focus on how green capex creates jobs, an example of how ‘green leveling’ is being used to promote income equality.

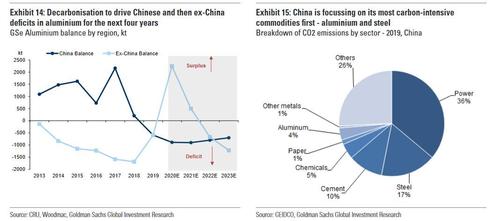
This is not dissimilar from past power-related infrastructure projects, like the Tennessee Valley Authority in FDR’s New Deal, which also had the benefit of addressing the environmental and social issues of the day. This extends to trade policy, where after focusing on agriculture, technology transfer and manufacturing jobs – areas associated with traditional protectionist policy – the US, China and Europe are all starting to shift their discussions of trade policy toward one centered around carbon border taxes and strategic competitiveness. Indeed, ‘carbon security’ is now becoming an issue of national importance – do countries have access to low carbon technologies, and the raw materials to expand key green sectors domestically? Members of both the Biden administration and the CCP are highlighting risks to sectors that cannot decarbonize before the imposition of these taxes. China’s imposition of national capacity caps alongside provincial emission targets sets the stage for tightening commodity supply. Within the metals complex, this is most impactful on steel (17% of current China emissions) and aluminum (4% of current China emissions).

Unlike the fleeting supply reform measures of the mid-2010s, the long-dated nature of decarbonisation targets suggests capacity constraints should remain in place and in turn have more sustained impact on fundamentals and price. We would note that China’s emphasis on moderating metal exports as part of rightsizing supply to domestic demand is an important bullish dimension for Western pricing.

Tyler Durden
Wed, 04/28/2021 – 10:10

via ZeroHedge News https://ift.tt/2Pvz8M5 Tyler Durden

US Orders Staff To Leave Afghanistan Embassy Due To Threats

US Orders Staff To Leave Afghanistan Embassy Due To Threats

Not willing to allow the world to witness another Vietnam-style emergency helicopter departure of American diplomats from an embassy under fire, the State Department on Tuesday ordered “the departure from US Embassy Kabul of US government employees whose functions can be performed elsewhere.”

The US is citing “increased threats” as the reason behind the order, leaving only essential personnel and the Marine security detachment, ahead of Biden’s drawdown of troops from the country. US officials confirmed to CNN that embassy employees “whose functions can be performed elsewhere” were ordered to leave Kabul.

“By minimizing the number of employees in Afghanistan whose functions can be performed elsewhere, personnel who are urgently needed to address issues related to the drawdown of US forces and to continue the vital work we are doing in support of Afghanistan and its people will be able to remain in place,” the State Department said.

Saturday May 1st was the deadline for the pullout brokered under the Trump deal with the Taliban; however, with Biden extending this to Sept.11 it has provoked Taliban outrage. Taliban spokesman have recently vowed a “nightmare” for US troops should they stay past this date

US Embassy in Kabul, via Caddell Construction

One Taliban commander weeks ago said the Americans have “proven they can’t be trusted after retreating from the May 1st deadline” and that the Taliban remains willing to “fight till the end” of the US occupation.

Acting US ambassador in Kabul Ross Wilson confirmed this week that the embassy draw down decision was made “in light of increasing violence and threat reports in Kabul.”

The prior US-Taliban peace deal was signed in February 2020 under the Trump administration, after which there’s been no US combat-related troop deaths. But the situation will likely get more violent the longer US troops stay past the upcoming May 1st deadline. 

Tyler Durden
Wed, 04/28/2021 – 09:45

via ZeroHedge News https://ift.tt/3u29DB1 Tyler Durden

Rabo: We Are Edging Closer To A Biblical Commodity Price Increase Scenario

Rabo: We Are Edging Closer To A Biblical Commodity Price Increase Scenario

By Michael Every of Rabobank

We Need Some Serious Remodelling

Yesterday’s Daily saw me float the model hypothesis that the Fed would like everyone to have all their money in stocks, so they would have a practical mechanism for inflating and deflating the economy above and beyond the need to mess around with interest rates or QE. Of course, this was a huge over-simplification. In particular, it overlooked housing: why bother only inflating stocks when not everyone holds them, when you can do the same to housing, which everyone needs? Lo and behold, yesterday’s S&P/CoreLogic 20-city prices were up 11.9% y/y. (A figure the RBA will look at with smug contempt: “That’s all you got?”)

Presumably the matching rise in US consumer confidence was driven more by stimulus checks in the mail than rent checks going out the door, or chats with realtors about affording a home in a country not exactly famous for its lack of available land. Yet surely the Fed is still missing a trick? Just switch to a digital currency, like China, and assets can be turned on and off at will, and there is no need to go through with the pretense of inflating asset markets in lieu of the general economy.

Yesterday’s Daily was also a vowel-less attempt to emphasize what is missing from the macro-models the Fed uses to form the view it will share with the world later today – in-between pushing up stock and house prices:

  • Functioning banks and credit are not part of it. Professor Steve Keen’s ‘Minsky’ software is unlikely used in the Eccles Building to spit out hockey-stick recoveries; or, if it is, the users really don’t understand what it implies is going to happen next;

  • There are no political considerations. These are now mentioned by the Fed – but I haven’t heard “labour vs. capital” from them, or what is needed to do something about it, when they are happy to expound on so many other areas – in-between pushing up stock and house prices. Yet politics and labour and capital are the only real games in town right now; apart from.

  • Supply chains, which also don’t exist. Trade just ‘happens’ in a frictionless manner.

Now I am not going to pretend to be a supply-chain expert, but I do understand that lines on charts and numbers on spreadsheets reflect a real world, and I have even been to see some of these facilities in person. Years ago, I visited a hot, dusty Vietnamese port. The main warehouse was elevated so the largest trucks could pull up next to it, and cargo slide in. Except half the ground below had subsided a few inches, as South-East Asian soils do after rainy season, and so the truck floor-bed and warehouse ‘lip’ were no longer flush, and each truck had to be filled far more slowly by manual labor. While there were plans to level the ground, I was told, for now only the cargo they liked got to use ‘the good end’. Luckily much of the time we can get away with just presuming trade ‘happens’, rather than accounting for the above anecdote.

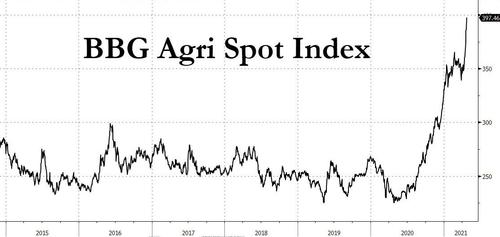
But not during Covid, and not today: actual supply-chain experts are saying they have never seen anything like what is currently happening. There is a total, global log-jam; goods cannot be shipped in some cases; and supply-side inflation on a scale we have not seen for a long, long time looks imminent. And that is on top of weather-related disruption edging us closer to the Biblical agri-commodity price increase scenario we discussed back here. It also sits alongside geopolitical problems, with Saudi Arabia claiming an attempt was made to ram a ship filled with explosives into its Yanbu oil port, the latest tit-for-tat episode in that region.

As such, it is going to be even more surreal than usual to have to listen to the Fed warble on about unemployment projections today, and then the market warble back about clues as to which particular month of which particular year might flag the potential start of a gradual process of perhaps not pushing up stock and house prices quite as fast as at present (in the flawed theoretical assumption the economy does not then topple over as a result).

In-between, homes are becoming unaffordable; rent is becoming unaffordable; food is set to become far less affordable; and many other goods too. Not just in the US, but everywhere. The first two problems central banks clearly won’t do anything about until pushed; and the latter two they can’t do anything about even when pushed. But, hey, enjoy Fed day, folks!

Meanwhile, in a more general round-up of pre-Fed developments, Bloomberg reports ICBC was the lucky bank obliged to stump up $600MM to help struggling Chinese asset-manager Huarong pay off-shore debt due yesterday. So risk on and risk off. The only difference is timing: on which, Fitch has cut Huarong’s credit rating three notches, and that as its 4.5% perpetual bond(!) is trading at 64.5 cents on the dollar. One wonders what model was used for the original rating, with Bloomberg concluding: “it’s unclear whether Chinese authorities have decided on a plan to resolve the company’s longer-term challenges.” So East and West still have much in common then.

One being an awful demographic profile, with suggestions that China’s population may have actually shrunk in 2020 for the first time since 1949: “The pace and scale of China’s demographic crisis are faster and bigger than we imagined. That could have a disastrous impact on the country,” in the words of one expert quoted. It’s unclear if this really is the case, but there are claims of regular over-reporting of population at lower administrative levels, and a very sharp decline in fertility rates overall that is now generating a marked shift on the political/policy front. (As other countries show, likely to little effect, however.)

The EU is suing Astra-Zeneca for not supplying them with sufficient vaccines for them to then not use; 20 ex-French generals have penned a letter threatening military rule(!) if the country cannot sort itself out; and Finland is the latest to delay the €800bn Recovery Fund planned for an economy that was already supposed to be back to normal by now rather than still locked down.

In the UK, Boris Johnson is under attack even in the Tory press for saying he was willing to see bodies piled high to avoid a Covid lockdown that happened anyway; and for not coming clean on who paid for his GBP58,000 wallpaper in No. 11 Downing Street. What an Eton mess this all is – and I am also referring to the wallpaper. It may seem unrelated to the arguments and news above, but the fact that a British Prime Minister leading the country through the largest crisis since WW2 would allow his partner to spend twice the average UK salary on gaudy wallpaper in a property they don’t even own says a great deal about the need for some *serious* global remodeling.

Lastly, Australia, which literally has a prime-time TV show based on remodelling property for crazy profit margins no matter how badly the contestants manage the process, just released Q1 CPI data. In q/q terms it was up just 0.6% vs. 0.9% consensus and in y/y terms 1.1% vs. 1.4%, and all the core measures are also still far closer to 1% than 2%. That’s nice for the RBA: now they can get back to a policy of benign neglect allowing 30% y/y house-price inflation, in-between ignoring fellow Australian Steve Keen and his ‘Minsky’ software pointing out how this all ends.    

Tyler Durden
Wed, 04/28/2021 – 09:25

via ZeroHedge News https://ift.tt/2R7dcrf Tyler Durden

Value Investing Icon Jumps Off Manhattan Skyrscraper To His Death Days After Liquidating Fund

Value Investing Icon Jumps Off Manhattan Skyrscraper To His Death Days After Liquidating Fund

Desperate analysts languishing on the bottom rung of finance’s long career ladder aren’t the only ones committing suicide anymore.

Charles de Vaulx, a renowned value investor and co-founder of International Value Advisors, “died suddenly Monday afternoon, leaving the asset management industry in shock. It was an apparent suicide, according to the New York Police Department, who confirmed to the press that de Vaulx jumped from the 10th floor of a Manhattan skyscraper to his death. The apparent suicide comes just days after he finished winding down his investment firm.

As Barrons adds, “de Vaulx, 59, had built a long career as a risk-aware global investor who never deviated from his deep-value approach, even when it meant keeping as much as 40% of his funds in cash because he couldn’t find attractive investments during a 13-year stretch in which the markets favored faster-growing companies. De Vaulx’s conviction set him apart in the industry, even among other battle-tested contrarians.”

Charles de Vaulx

For de Vaulx and thousands of other dedicated value investors, the last decade or so, where the Federal Reserve has perverted the price discovery process by flooding the financial system with liquidity, has been led to an extended drought for their businesses. Though value enjoyed a brief resurgence earlier this year, momentum growth funds and cryptocurrencies have produced world-beating returns while dividend-producing value stocks have seen valuations stagnate at levels well below their momentum rivals as investors place a premium on projections in a low-yield universe.

And while even value-investing titan Warren Buffet has been forced to adapt by embracing Apple and other tech stocks, de Vaulx – a disciple of legendary French value manager Jean-Marie Eveillard at SoGen and then First Eagle, before he went on to launch IVA in 2008 – was a value purist until the end. He served as chairman and CIO of IVA until it closed up shop earlier this month.

“Others were willing to compromise and try some new approaches to adapt,” said Gregg Wolper, senior analyst at Morningstar Manager Research. “De Vaulx didn’t think that was appropriate, and stuck to the deep value approach. His investors appreciated it because there weren’t many other places to find that.”

And the end finally came earlier this year when International Value Advisers announced in March that it planned to liquidate its two US mutual funds. The liquidation was finalized last week. The firm added that “all associated accounts and funds will be similarly liquidated,” Morning Star, which broke the news of Vaulx’s suicide, reported.

“It is with heavy hearts that we announce the passing of our Chairman and CIO, Charles de Vaulx,” reads a statement on IVA’s website. The firm had more than $20 billion in assets under management at its peak, but had shrunk to just $863 million as of the end of last year.

But for all the years of peer-beating performance at First Eagle and then IVA, de Vaulx’s investors apparently weren’t thrilled when he took a step back as the shocking accumulation of debt in the post-crisis era deeply bothered him, making it near-impossible for him to pick stocks using his traditional methods.

Very much a bottoms-up investor who did deep research into companies and would passionately make the case for them, de Valux was also attuned to broader macroeconomic forces. And the high levels of debt around the world—both government and individual—troubled de Vaulx. That along with high valuations contributed to his desire to hang on to cash, even as markets charged ahead. “The reason he stuck with it wasn’t because he was stubborn but because he felt it was the best way to invest to protect his shareholders from losses and it was his duty to preserve capital,” Wolper added.

That conviction earned him respect in the industry. “Charles was a thoughtful, talented, disciplined, and risk-averse investor, who brought an intensity to his craft,” said Larry Pitkowsky, a fellow value manager at GoodHaven Capital Management. “And he was also a generous friend to many in the investment business.”

One source close to de Vaulx told the New York Post that his death was like “a Shakespearean tragedy.” The Post also reported that de Vaulx had reportedly been depressed by the redemptions at his firm, especially when longtime clients pulled money.

Tyler Durden
Wed, 04/28/2021 – 09:08

via ZeroHedge News https://ift.tt/3vE76xB Tyler Durden

Warning Light Flashing Red

Warning Light Flashing Red

Authored by Charles Hugh Smith via OfTwoMinds blog,

When the warning light is flashing red, it’s prudent to have a capital preservation strategy in place.

Not everyone has an IRA or 401K invested in the stock market, for those who do, the red warning light is flashing red: markets have reached historic extremes on numerous fronts.

Just like in 2000, proponents claim “this time it’s different.” Back then, the claim was that since the Internet would be growing for decades, dot-com stocks could go to the moon and beyond.

The claim the the Internet would continue growing was sound, but the prediction that this growth would drive stock valuations into a never-ending bubble was unsound.

Once again we hear reasonable-sounding claims being used to support predictions of a never-ending rise in stock valuations.

What hasn’t changed is humans are still running Wetware 1.0 which has default settings for extremes of emotion, particularly manic euphoria, running with the herd (a.k.a. FOMO, fear of missing out) and panic / fear.

Despite all the assurances to the contrary, all bubbles pop because they are based in human emotions. We attempt to rationalize them by invoking the real world, but the reality is speculative manias are manifestations of human emotions and the feedback of running in a herd of social animals.

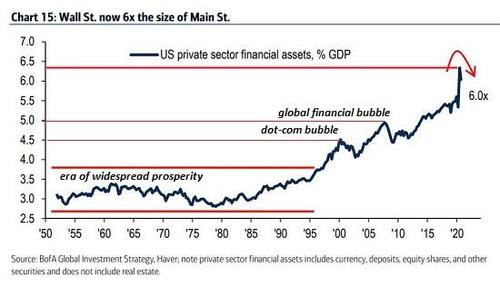
Here’s a chart of financial assets as a percentage of Gross Domestic Product (GDP). (below) Note that in the “Glorious Thirty” years of the postwar era of broad-based prosperity, financial assets were around 3 times GDP.

This ratio increased with every one of the three bubbles since the mid-1990s: the dot-com bubble in 1999-2000 (Fed Bubble #1) , the subprime bubble in 2007-08 (Fed Bubble #2) and now the Everything Bubble of 2020-21 (Fed Bubble #3). Financial assets are now 6 times the size of the “real economy” (GDP), an extreme beyond all previous extremes.

This reflects the dominance of financial assets based on extreme expansions of debt, leverage and speculation.

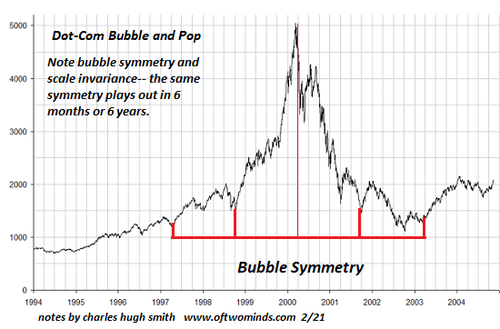
The red warning light of extremes in sentiment, valuation, etc. can flash for quite some time, but as I’ve noted over the years, speculative bubbles often display symmetry: those that spike higher tend to collapse in a mirror-image of the manic rise. This symmetry isn’t perfect, of course, just as correlations are rarely if ever perfect, but as a generality, bubbles tend to display symmetry as manic greed slips into doubt and then cascades into panic. (see chart below)

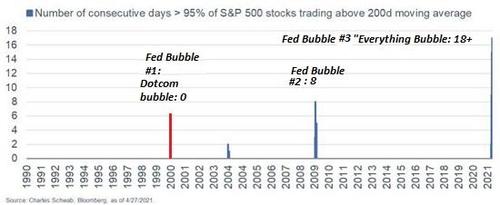
Extreme bullishness is noteworthy. (see chart below of S&P 500 stocks above their 200-day moving average–a standard definition of a stock in a bullish trend.) Not only is the number of S&P 500 stocks that aren’t in a bullish uptrend essentially signal noise, this extreme reading has been pegged to the upper boundary for weeks, far longer than the extremes reached in previous manias.

As my old quant boss Stew Pillette would observe, when all the good news is out and has already been priced into the market, the next bit of news is likely to be bad and not priced in.

There are seven factors to keep in mind that may intensify reversals and risks:

One factor to keep in mind is the dominance of ETFs (exchange-traded funds) and index funds. As money pours into these passive funds, the funds buy whatever stocks are in the ETF or index. Good, bad and indifferent stocks in each ETF or index are purchased without any assessment of their relative value.

When owners sell, the process is reversed: every stock in the ETF or index is automatically sold to fund the redemption. This leads to “the baby being thrown out with the bathwater” as the best performing companies get sold off with the dregs in the ETF or index.

Another factor to keep in mind is the reliance of bubbles on borrowed money (margin debt) and leverage: 2X and 3X leveraged ETFs and a variety of financialization tricks to increase leverage and thus gains. When assets that have been leveraged reverse even modestly, the losses are quickly consequential, and the “solution” is to liquidate every leveraged asset before the position is wiped out. Selling begets selling, and this is the self-reinforcing feedback of crashes.

A third factor to keep in mind is the decline of short interest to all-time lows. Put another way, the number of speculators who have an incentive to buy shares in a decline is near all-time lows, so the only buyers in a real decline will be “buy the dip” players who will soon be wiped out if the decline continues.

A fourth factor to keep in mind is the narrowing of the speculative universe into a few assets. This creates an extreme dependency on the few rocketships to keep soaring lest the entire ETF / index fund world collapse.

A fifth factor to keep in mind is the potential for the Covid virus to spread globally beyond current expectations. Such an expansion could trigger a global slowdown / recession.

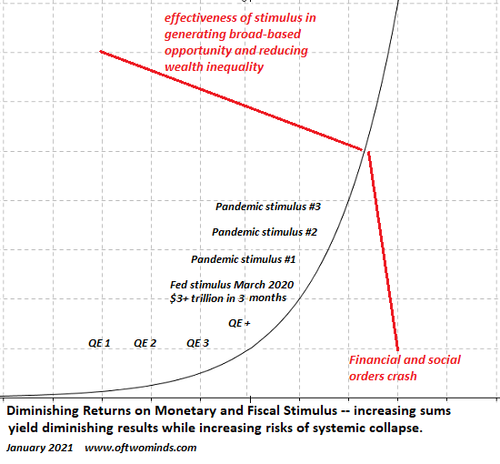
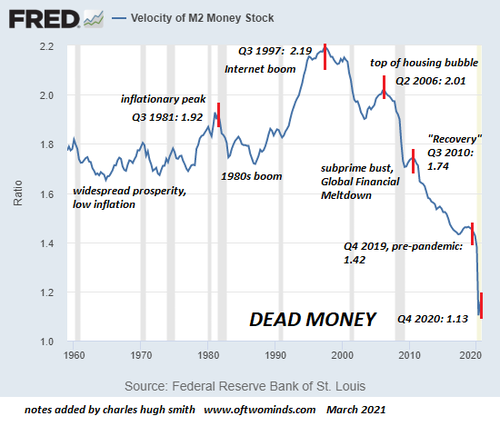
A sixth point to keep in mind is that all fiscal and monetary stimulus suffers from diminishing returns. (see chart below)

The chart of money velocity suggests the returns have fallen off a cliff. (see chart below)

A seventh factor is the dominance of algorithm-driven trading (algos, trading bots, etc., which appears to be mostly programmed to be momentum / trend-following. If these programs are withdrawn to avoid high volatility, the liquidity the market depends on to maintain stability may dry up, increasing the odds of the market going bidless, i.e. buyers vanish and prices crash.

When the warning light is flashing red, it’s prudent to have a capital preservation strategy in place.

*  *  *

If you found value in this content, please join me in seeking solutions by becoming a $1/month patron of my work via patreon.com.

*  *  *

My recent books:

A Hacker’s Teleology: Sharing the Wealth of Our Shrinking Planet (Kindle $8.95, print $20, audiobook $17.46) Read the first section for free (PDF).

Will You Be Richer or Poorer?: Profit, Power, and AI in a Traumatized World (Kindle $5, print $10, audiobook) Read the first section for free (PDF).

Pathfinding our Destiny: Preventing the Final Fall of Our Democratic Republic ($5 (Kindle), $10 (print), ( audiobook): Read the first section for free (PDF).

The Adventures of the Consulting Philosopher: The Disappearance of Drake $1.29 (Kindle), $8.95 (print); read the first chapters for free (PDF)

Money and Work Unchained $6.95 (Kindle), $15 (print) Read the first section for free (PDF).

Tyler Durden
Wed, 04/28/2021 – 08:51

via ZeroHedge News https://ift.tt/3dYTJBM Tyler Durden