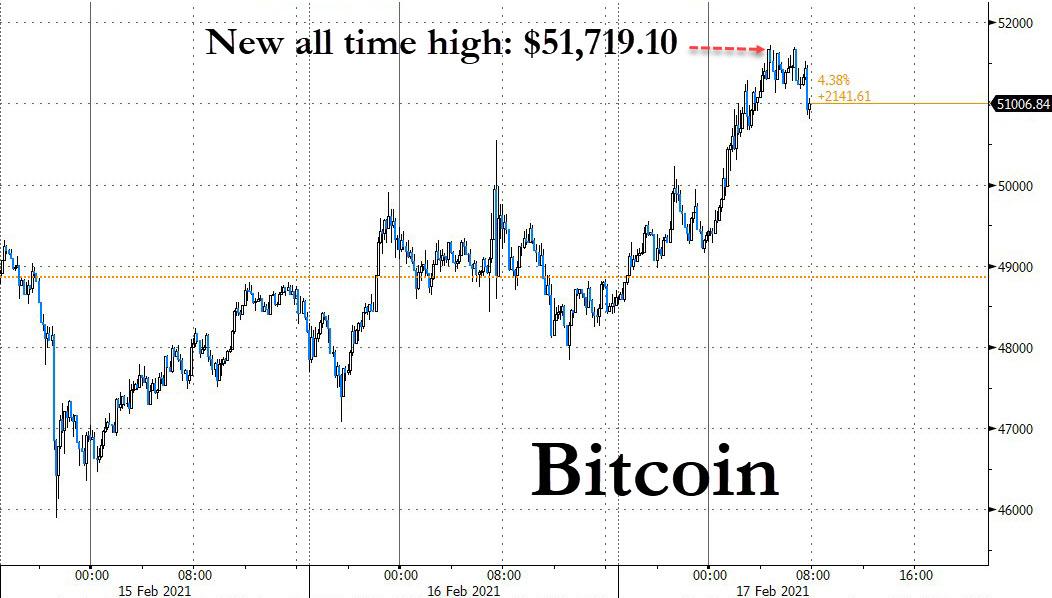
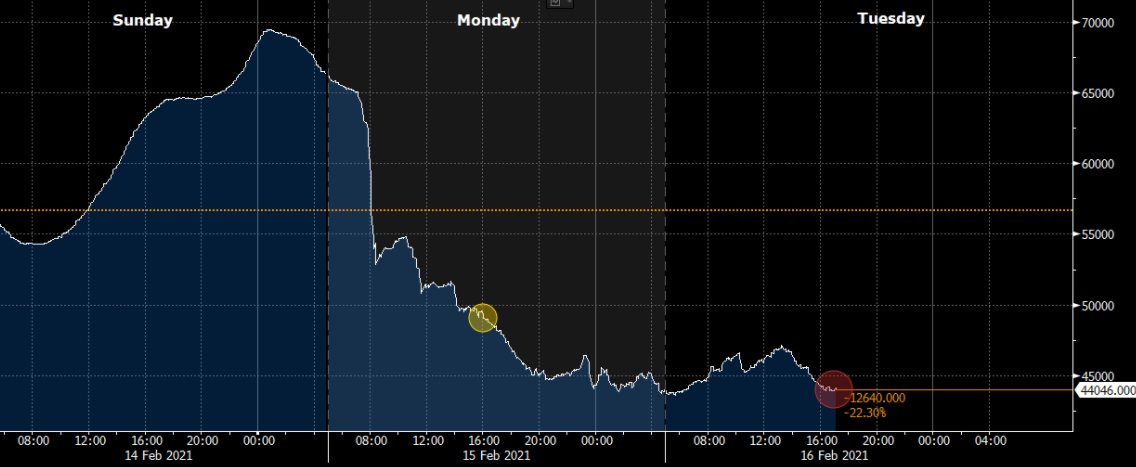
Bitcoin Soars To $51,700 As Traders Predict “Parabolic Advance”
And so the treacherous path to $100,000 begin.
Overnight, bitcoin surged almost 6% to about $51,431, ending a bout of weakness around $50K, and following delayed reaction to the news that MicroStrategy would sell $600 million of convertible bonds and use the proceeds to buy more of the tokens, a deal which has since been upsized to $900 million.
Also overnight, shares of Asian crypto-linked companies are advancing too. Japan’s Monex Group Inc. jumped 11% to hit a 13-year high, while BC Technology Group Ltd. in Hong Kong closed at a record. Bitcoin fintech proxy Silvergate Capital continued its recent surge, hitting new all time highs.
Tuesday had seen Bitcoin rise $50,000 for the first time ever, although that level failed to hold for more than a matter of minutes. MicroStrategy’s latest step is “a warning sign if there ever was one that things are getting out of hand in the crypto world,” Jeffrey Halley, a senior market analyst at Oanda Asia Pacific Pte, wrote in emailed comments.
JPMorgan Chase & Co. strategists said Bitcoin’s volatility needs to ease to prevent its rally from fizzling. Other commentators see a mania likely to end in a bust akin to the implosion in 2017. The digital coin’s 60-day realized volatility is around the highest since May last year, though still below the levels seen around the peak of its last boom some three years ago.
Others naturally disagreed: the largest cryptocurrency is in a “parabolic advance” — the fourth in its twelve-year history, bullish analysts said. “Big picture $BTC Bitcoin is undergoing its third parabolic advance in the past decade,” chartiest Peter Brandt tweeted alongside an annotated price chart. Brandt added that should the advance be violated, a correction of 80% is “most common” as a bearish consequence. Such behavior was observed in 2018 after Bitcoin peaked at near $20,000 — the market bottomed out at $3,100 one year later.
Big picture $BTC
Bitcoin is undergoing its third parabolic advance in the past decade. A parabolic advance on an arithmetic scale is extremely rare – three on a log scale is historic pic.twitter.com/fyyM5Ws6N5
As Cointelegraph reported, various indicators nonetheless suggest that Bitcoin is far from violating any uptrend, being at the start, rather than the end of its bull run. “$50,000 #Bitcoin is the new normal,” Blockstream CSO Samson Mow declared on Wednesday.
Discussing the new price highs, others noted that macro factors could converge to create a chain reaction of adoption, which would push Bitcoin further still into price discovery.
“If you think $50,000 a bitcoin is expensive, wait until you hear that the government is about to print $1,900,000,000,000 out of thin air,” popular Twitter account Documenting Bitcoin added.
Data meanwhile showed that Bitcoin had taken the momentum out of altcoin growth with its moves over the last few days, with all of the top ten cryptocurrencies except Polkadot (DOT) seeing sideways price action.
“There are a number of reasons why Bitcoin is soaring, but what stands out most is the trend that MicroStrategy started and Tesla popularised: moving institutional balance sheets into Bitcoin to hedge against inflation,” said Nicholas Pelecanos, head of trading at NEM.
Meanwhile, as Bloomberg notes, activity in Bitcoin futures suggests traders don’t see a sudden end to the crypto rally, with spreads continuing to widen between the active contract and March futures.
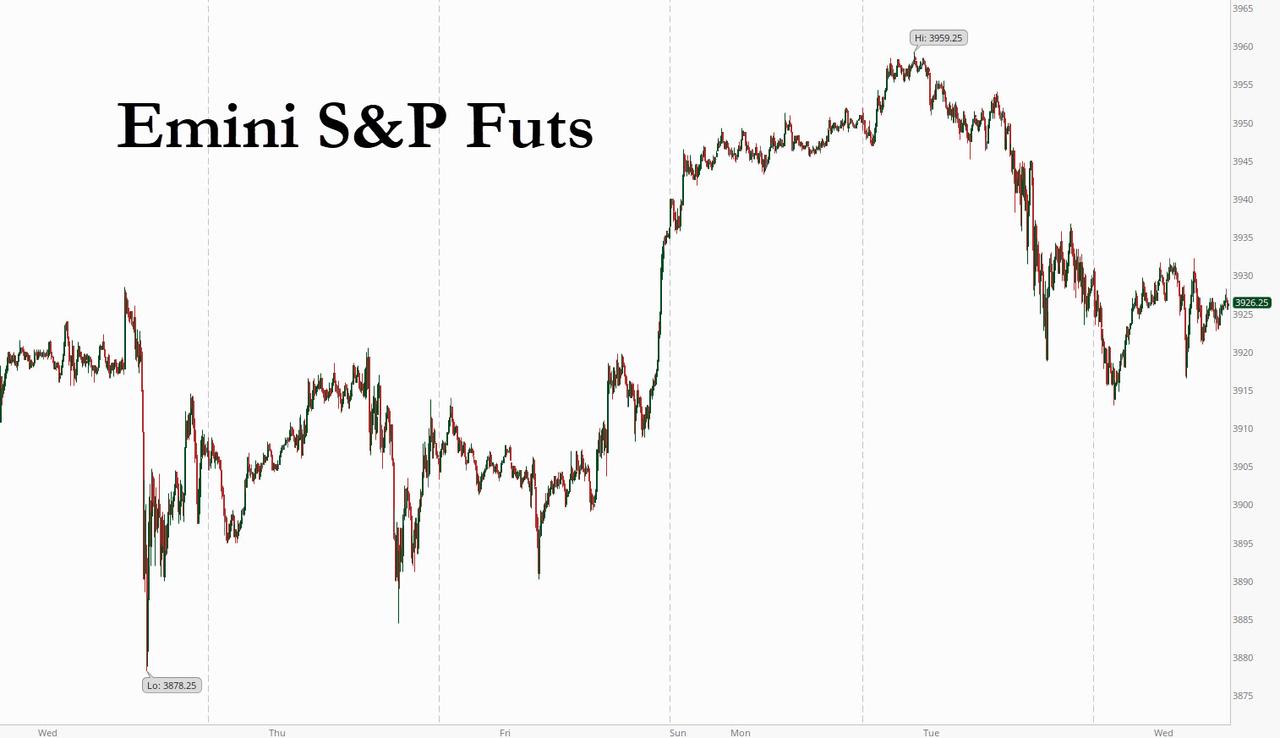
Futures Rebound From Overnight Lows As Bond Rout Slows
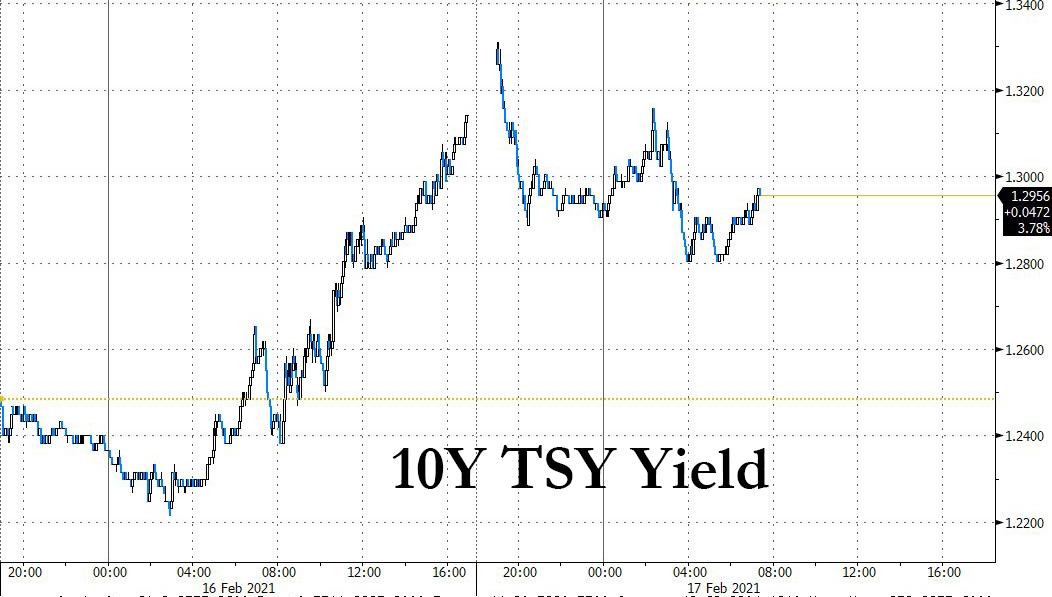
US equity futures rebounded from an overnight selloff which dragged Asian and European stocks lower, and which was sparked by surging bond yields. Emini futures unchanged around 3,927 as 10Y yields slipped from a 1-year high of 1.34% to 1.29% as buyers emerged in the Asian and European session ahead of a number of US risk events, including the January FOMC Minutes.
The MSCI world equity benchmark fell 0.1% as a weaker start of trading in Europe offset a brief surge in Asia overnight. The index ended flat on Tuesday to snap 11 straight positive sessions, the longest streak in 17 years.
“The market is fairly frothy here from a sentiment perspective,” Liz Ann Sonders, chief investment strategist at Charles Schwab & Co., said on Bloomberg TV. “You have to put a move higher in yields that goes out of the comfort zone as a potential risk associated with that.”
Europe’s Stoxx 600 Index slipped amid a mixed bag of corporate results. Kering dragged retail shares lower after its Gucci brand missed estimates, and British American Tobacco Plc slid following its full-year results. Rio Tinto Group climbed after reporting a 20% jump in annual profit on a surge in iron ore prices. Here are some of the biggest European movers today:
Rio Tinto shares gain as much as 4.4%, touching a record high, after the miner reported its largest annual profit in nine years and said it will pay a record dividend, helping to boost mining stocks.
Sinch shares surge as much as 24% to a record after the cloud communications software firm bought Inteliquent in a deal that Handelsbanken said would add fuel to the “rocketing” stock.
CNP Assurances shares gain as much as 5.4% to the highest in nearly a year, with Bryan Garnier saying the “very good news” in the insurer’s in-line earnings was the payment of a dividend.
Kering shares plunge as much as 9.2%, the most since March 18, with analysts saying the luxury-goods group’s key Gucci brand missed relatively low expectations in the fourth quarter.
British American Tobacco shares slide as much as 7.5%, the most since March 16, with analysts saying the group’s guidance was disappointing given the recovery in industry volumes.
Asian stocks erased a loss to trade little changed, as stocks surged in Taiwan and fell in South Korea. TSMC was the biggest boost to the MSCI Asia Pacific Index after a report said the Taiwanese chipmaker plans to boost advanced process production amid rising demand. The Taiex climbed 3.5%. Vietnam’s key equity gauge also gained more than 3%. Internet giants Tencent and Meituan helped power advances in Hong Kong shares. South Korean stocks dropped, dragged lower by Samsung Electronics after it halted operations at a Texas plant due to the recent blackouts. Philippine stocks fell amid concerns over rising inflation on higher oil prices. Markets in China remained closed for Lunar New Year holidays
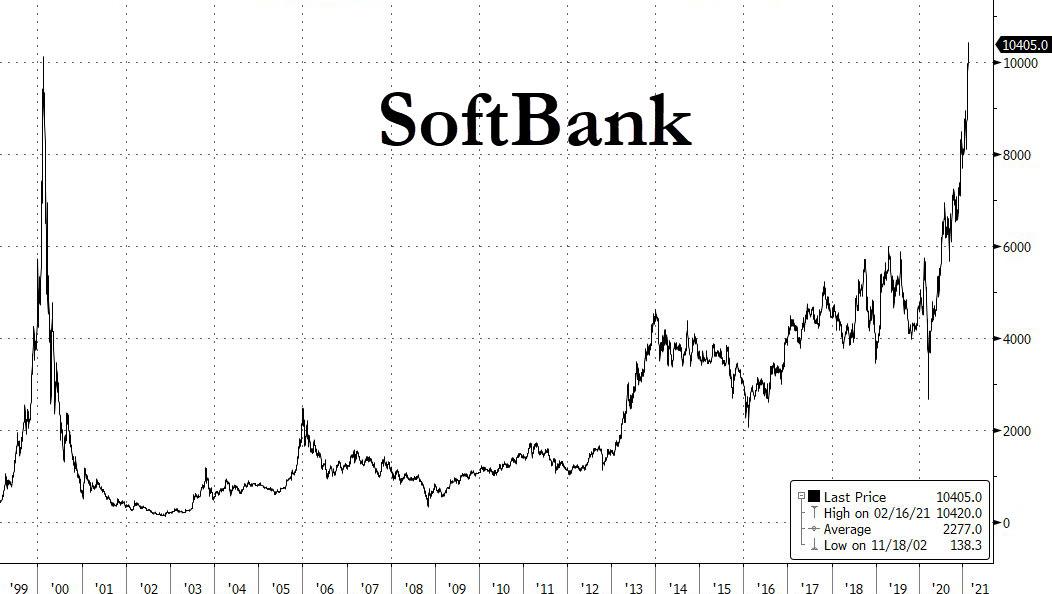
With China still closed much of the focus was on Japan, where stocks fell after a rally that pushed the nation’s stock gauges to the highest levels in 30 years and as rising yields spooked some investors. Electronics makers were the biggest drag on the Topix, which closed Tuesday at its highest level since June 1991. The Nikkei 225 pulled back after advancing beyond the key 30,000 mark to its highest since August 1990. The 14-day relative strength index on both measures continues to hover above the key 70 level, which some see as indicating the market is due for a correction. SoftBank Group closed slightly lower after climbing to a record high Tuesday.
The big story in markets remains the move in bonds, where ten-year Treasury yields are up nearly 40 basis points this year as vaccine progress and economic data begin drive investor focus on soaring inflation. Yields rose as far as 1.3330% before easing to 1.29%. The 2s10s, or the gap between 10-year and two-year U.S. yields, also reached its widest in nearly three years in anticipation of short-term rates going nowhere.
To be sure, there are plenty of reasons for the move, as investors try to price in the impact of a still-to-be-completed stimulus bill, and the reopening of the U.S. economy. As JPM discussed on Tuesday, from a trader’s perspective, the question “why yields are rising” matters even more. As JPM futures trader Matt Booras explains, if yields are rising for “good reasons” such as increasing GDP forecasts, then stocks will be fine. However, if there is a “bad” yield rising event such as a lack of demand for US Treasuries then stocks may come under pressure. Irrespective of the reason, Booras is looking for yields to eventually compress multiples which could disproportionately hit Tech while Cyclicals still move higher.
“Regarding the bond market sell-off, things are finally starting to get serious as real yields are on the rise, driven by bets … of central banks tightening sooner than previously expected,” said Arne Petimezas, analysts at AFS in Amsterdam. “Risk-assets are now becoming vulnerable to a pull-back.”
In the short term, however, investors expect central banks to keep monetary policy loose and minutes later on Wednesday from the U.S Federal Reserve’s January meeting are expected to reinforce that view.
“Recent remarks by (Fed Chair Jerome) Powell and several other Fed officials show that the FOMC is very comfortable with its current policy stance,” wrote UniCredit strategists.
In FX, the Bloomberg Dollar Spot Index rose a second day as the greenback advanced versus all of its Group-of-10 peers apart from the yen. Scandinavian currencies led the decline, while the yen was little changed at around 106 per dollar after slipping for four consecutive days. The kiwi pared an intraday drop after the Auckland lockdown was lifted, before slipping again. Bitcoin’s rally showed little sign of abating after the token jumped past $51,000 for the first time. The euro fell 0.2% to $1.2075. Sterling, which has been surging as vaccinations roll out rapidly across the United Kingdom, was last down 0.1% at $1.3892.
In commodities, oil fluctuated around $60 a barrel in New York amid a deepening energy crisis in the U.S. Meanwhile, Bitcoin continues to rise and jumped past $51,000 for the first time. Gold touched a two-week low on Wednesday.
Looking to the day ahead there are a number of US data releases, including January’s retail sales, industrial production and PPI, while there’s also the NAHB housing market index for February. Otherwise, there’s also the January CPI readings from the UK and Canada. Separately, we’ll also get the minutes of the Federal Reserve’s January meeting, and the Fed’s Barkin, Rosengren and the BoE’s Ramsden will be speaking.
Market Snapshot
S&P 500 futures little changed at 3,925.00
MXAP little changed at 220.84
MXAPJ up 0.4% to 744.85
Nikkei down 0.6% to 30,292.19
Topix down 0.2% to 1,961.49
Hang Seng Index up 1.1% to 31,084.94
Shanghai Composite up 1.4% to 3,655.09
German 10Y yield little changed at -0.35%
Euro down 0.3% to $1.2073
Brent futures up 0.6% to $63.72/bbl
Sensex down 0.7% to 51,736.50
Australia S&P/ASX 200 down 0.5% to 6,885.22
Kospi down 0.9% to 3,133.73
Brent futures up 0.6% to $63.73/bbl
Gold spot down 0.4% to $1,786.50
U.S. Dollar Index up 0.3% to 90.76
Top Overnight News
Mario Draghi said the European Union needs a common budget to battle recessions and urged Italians to pull together in a historic effort to rebuild their country, as he made his initial speech in the Senate as Italy’s prime minister
U.S. Treasuries are in for more wild gyrations, with volatility markets signaling that the benchmark bond yield could surge or drop by almost 30 basis points in the next three months. The three-month implied volatility on 10-year swap rates jumped by the most since March on Tuesday, surpassing the levels heading into the 2020 U.S. election
Europe is getting left in the dust like never before by the reflation frenzy across the Atlantic. Rising energy costs are driving yields on Treasuries and German bunds higher, yet market proxies for inflation expectations in the U.S. are outpacing those in the euro area by the most in over a decade
Germany had to pay to borrow money for the first time in nearly a year as market bets on global reflation have pushed up yields
U.K. inflation unexpectedly accelerated in January, in what economists say is the first step toward a significant increase that could bring the rate close to the Bank of England 2% target later this year
The European Union finalized an agreement with Pfizer Inc. and BioNTech SE for 200 million more doses of their Covid-19 vaccine, locking in a second-quarter supply boost as countries struggle to speed up their immunization drives
JPMorgan Chase & Co. is working with about 10 stressed or distressed borrowers in Europe hoping to lower the cost of government bailout loans in the debt market, according to senior bankers
A quick look at global markets courtesy of Newsquawk
Asia-Pac equity markets traded mostly lower after the lacklustre handover from Wall Street where the major indices finished mixed and retreated from fresh intraday records as the rising yield environment provided a headwind for stocks. ASX 200 (-0.5%) was negative with underperformance in gold miners after the precious metal retreated beneath USD 1800/oz and consumer staples were also pressured by declines in supermarket operator Coles despite posting profit growth in H1, as it warned sales in the sector could moderate significantly or even decline in H2 and beyond. However, the losses in the broader market were cushioned as participants digested a slew of mixed results including a jump in Westpac profits which boosted shares in the big 4 lender and with some slight encouragement from the announcement to lift the 5-day snap lockdown in Victoria state. Nikkei 225 (-0.6%) conformed to the subdued mood after reports suggested the government was not planning to lift COVID-19 emergency measures and following mixed data in which Machinery Orders showed surprise growth for December but Exports and Imports in January missed estimates, while KOSPI (-0.9%) suffered after domestic COVID-19 cases rose to the highest since early January following the Lunar New Year holiday. Conversely, Taiwan’s TAIEX (+3.5%) surged as it played catch up to the recent global advances on return from its 11-day closure and the Hang Seng (+1.1%) shrugged off early losses to extend on its best levels since early 2018 amid Hong Kong IPO optimism for this year and ahead of the return of mainland participants tomorrow. Finally, 10yr JGBs continued to weaken on spillover selling from USTs and with domestic yields tracking stateside counterparts which earlier rose to fresh cycle highs, while the absence of BoJ purchases in the market also contributed to the lack of demand for Japanese government bonds.
Top Asian News
Baidu’s Back With an $80 Billion Rally and Electric Car Ambition
Qatar Lays Out Ambition to Be LNG King for At Least Two Decades
Tokyo Olympics to Pick Female Minister as Chief, NHK Says
Hong Kong May Prohibit Insults of Public Officials, Reports Say
European stocks opened today’s session relatively flat/mixed but with a downside bias following a similarly downbeat APAC close. Meanwhile, US equity futures are trading flat but with the cyclically-driven Russell 2000 futures modestly underperforming. Bourses in Europe continue to follow the slightly softer trend (Euro Stoxx 50 -0.3%), considering the lack of news flow thus far in the run-up to FOMC minutes. Sectors are mainly in the red with no distinct risk bias and with some seemingly moving on idiosyncratic factors. Energy is the outperformer following the price action in the crude complex and the sectorial laggard is Retail (-2.9%) as Kering’s (-7.9%) biggest brand Gucci fell short of LFL sales expectations -10.3% vs exp. -7.2%. Moreover, in-fitting with this, the Consumer Discretionary sector and the CAC are softer, with Kering accounting for over 3% of the index’s weighting. Elsewhere, Rio Tinto (+3.4%) is higher after Co. announced FY profit after tax of USD 10.4bln vs prev. USD 7.0bln and a dividend of USD 5.57/shr vs prev. USD 4.43/shr. Meanwhile, British American Tobacco (-5.4%) trades lower, potentially due to commentary surrounding FY21 global tobacco volume , which is expected to fall by 3.0%. Akzo Nobel are (+1.6%) higher in the wake of their better-than-expected earnings. Turning away from earnings, Nestle (-0.3%) trades modestly into the red amid reports that it is offloading regional spring water brands, purified water business and beverage delivery operations in US and Canada to One Rock Capital Partners for USD 4.3bln.
Top European News
Europe Clinches Pfizer-BioNTech Deal for 200 Million More Doses
Draghi Tells Italy Lawmakers EU Needs Common Budget
Akzo Plans $1.2 Billion Buyback After Rival Snatches M&A Target
U.K. Inflation Ticks Higher on Its Way Toward BOE’s 2% Target
It remains largely a long term rates and reflation rather than general risk sentiment story in terms of Dollar direction and corresponding moves in other currencies by default, but global stocks are beginning to get twitchy about the implications of soaring yields and steeper curves to keep the Greenback underpinned on safe haven grounds even when US Treasuries and bond peers enjoy bouts of consolidation and recuperation. Indeed, the index is just shy of a fresh rebound high and mostly above the 21 DMA that comes in at 90.624 today within a 90.844-617 band in the run up to a raft of data, more Fed speak and FOMC minutes from the January policy meeting. However, the impending Usd 27 bn 20 year note auction results may have more bearing for the Buck via any reaction in USTs.
In FX, the Franc and Euro are bearing the brunt of the Dollar renaissance, as the former slips below 0.8950 and latter to circa 1.2060 with little in the way of support until 1.2050 for psychological reasons. Moreover, the single currency is also feeling the weight of relative Sterling strength or resilience as Eur/Gbp extends even further to the downside and through 0.8690.
NZD/AUD/GBP – Little traction from news that COVID-19 restrictions will be relaxed in Auckland and NZ as a whole from tomorrow, with the Kiwi pulling back beneath 0.7200 vs its US rival and underperforming against the Aussie as the Aud/Nzd cross rebounds from around 1.0750 to 1.0786. Conversely, Aud/Usd is keeping sight of 0.7250 in the run up to jobs data and some timely comments from RBA’s Kent overnight on the labour market (needs to be tight to lift earnings and inflation). Note, the Assistant Governor also announced tweaks to FX swaps in favour of longer term foreign currency purchases, but with no impact on the value of the Aud. Elsewhere, the Pound has lost grip of the 1.3900 handle even though UK inflation metrics were firmer than forecast and Cable now awaits rhetoric from BoE’s Ramsden for some independent impetus.
JPY/CAD – The Yen has clawed back some lost ground after sliding under 106.00 as JGBs play catch-up in yields and long end swap rates spike, but Usd/Jpy is still elevated following the breach of key resistance levels. Similarly, the Loonie failed to tread water above 1.2700, but has pared some of its decline from 1.2719 before Canadian CPI alongside firmer crude.
In commodities, WTI and Brent front month futures continue with their upward trajectories as the complex remains elevated by underlying fundamentals (vaccine/reflationary/recovery hopes and OPEC+ support), alongside the short-term supply cripple in Texas amid serious adverse weather conditions – with US output hit by some 3.5mln BPD, roughly equivalent to Iraq’s oil production. Texas produced around 4.6mln BPD according to the latest data by the EIA. These factors have kept WTI buoyed around 60.50/bbl (vs low USD 59.55/bbl) whilst its Brent counterpart probes USD 64/bbl (vs low USD 62.75/bbl). Crude prices at these levels have prompted market chatter regarding OPEC+ politics and policy; it’s expected that hawkish producers, namely Russia, will exert some pressure on the group to ease output cuts, with recent commentary from Russia’s Novak also suggesting that the market is balanced. However, Saudi will have to avoid a rift widening as the Kingdom itself is currently poised to reintroduced the 1mln BPD of oil which was taken offline as a goodwill gesture in January. ING suggests “It is unlikely that the group would bring a little over 2.2mln BPD of supply back onto the market, aware that the market would baulk at such a decision”, but highlights that there is room for some sort of easing, contingent on how much output volume Saudi decides to return from its cuts. Note, the Saudi Energy Minister is set to speak today at 12:00GMT/07:00EST at the IEA-IEF-OPEC Symposium on Energy Outlooks. Focus will be on his short/medium term outlooks – which could provide some hints as to the producer’s preferred policy route ahead of the JMMC and OPEC+ meeting on Mar 3rd and 4th respectively. The minister will likely reaffirm the group’s flexibility and the need to be proactive, whilst attempting to steer clear of any direct comments on the upcoming meeting itself. Remarks surrounding the Texas developments could echo the Qatari Energy Minister’s view in which he highlighted the temporary nature of the weather disruptions and the robustness of the US oil market. Analysts at ING have upgraded their oil forecasts, with 2021 Brent seen averaging USD 65/bbl (vs. prev. USD 60/bbl) – “While we see limited further upside in the first half of this year, it is over the second half of this year where we see more upside, given the expectation of a stronger demand recovery over this period.” That being said, the bank is aware of the clear downside risks lingering, including 1) further COVID waves, 2) Fed tapering and 3) the “swift” return of Iranian oil into the market and 4) the non-zero chance of OPEC+ not reaching an accord. Elsewhere, precious metals erred lower during early European hours with spot gold losing further ground below USD 1,800/oz as a result of rising real yields, a firmer Dollar and the confirmed “death cross” setup from a technical standpoint. Downside levels for the yellow metal include USD 1,774.85/oz, USD 1,773.10/oz and USD 1,764/oz, marking the 1st Dec, 27th Nov and 30th Nov lows respectively. Turning to base metals, LME copper is softer today amid the firmer Buck and the broader defensive bias but remains comfortable above USD 8,000/t.
US Event Calendar
8:30am: Jan. PPI Final Demand MoM, est. 0.4%, prior 0.3%; PPI Final Demand YoY, est. 0.9%, prior 0.8%
8:30am: Jan. PPI Ex Food and Energy YoY, est. 1.1%, prior 1.2%; PPI Ex Food and Energy MoM, est. 0.2%, prior 0.1%
8:30am: Jan. Retail Sales Control Group, est. 1.0%, prior -1.9%; Retail Sales Advance MoM, est. 1.1%, prior -0.7%
8:30am: Jan. Retail Sales Ex Auto MoM, est. 1.0%, prior -1.4%; Retail Sales Ex Auto and Gas, est. 0.9%, prior -2.1%
9:15am: Jan. Capacity Utilization, est. 74.9%, prior 74.5%;
Manufacturing (SIC) Production, est. 0.7%, prior 0.9%
Industrial Production MoM, est. 0.5%, prior 1.6%
10am: Dec. Business Inventories, est. 0.5%, prior 0.5%;
10am: Feb. NAHB Housing Market Index, est. 83, prior 83
2pm: Jan. FOMC Meeting Minutes
DB’s Jim Reid concludes the overnight wrap
With the US arriving back at their (home) offices after Monday’s holiday, the astonishing equity rally we’ve seen in recent days has showed signs of petering out over the last 24 hours, as the MSCI World Index (-0.02pts and -0.00%) missed out by the narrowest margin on a 12th successive gain yesterday that would have been the longest winning run since 2003. This slight pullback in equities was evident across different regions, with Europe’s STOXX 600 and S&P 500 both falling -0.06% from their recent highs. The reflation rotation was in full force though as rising yields and climbing oil prices helped Bank (+2.79%) and Energy (+2.26%) stocks to keep the S&P 500 near unchanged, while European Banks (+1.06%) and Basic Resources (+1.24%) did the same for the STOXX 600. Meanwhile Tech Hardware (-1.33%) and defensive bond-proxies such as Real Estate (-1.07%) and Utilities (-1.14%) were among the S&P’s worst performers.
Indeed the bigger story was taking place in sovereign bond markets, where the selloff continued to gather pace as investors stuck with the reflation trade, not least as Congress is increasingly focusing on the passage of stimulus now that former President Trump’s impeachment hearing is out of the way. Yesterday saw a significant bear-steepening in US Treasuries, with 10yr yields up +10.6bps to 1.314% (trading at 1.296% this morning), taking them above their highs last March when we had a crazy period where Treasuries climbed over 85bps (including intra-day extremes) in around 7 business days before reversing the move over the next 10.
Tuesday’s move took the 2y10y yield curve +8.9bps steeper to 118.4bps – its steepest point since March of 2017. 30 year yields were +8.0bps higher yesterday at 2.09%. The session saw the biggest daily move higher for US yields since that crazy March period in the midst of the initial global pandemic response. On top of this, inflation expectations powered forward as well, with 10yr US breakevens at a fresh 6-year high of 2.25%, as 2-year breakevens climbed to their highest level in nearly a decade, at 2.65%. President Biden himself said “bigger is better now” on stimulus in a townhall meeting last night. We also got confirmation that President Biden would make his first address to a joint session of Congress in March, with the administration waiting to get the current pandemic relief plan through beforehand. The topic of that address is expected to focus on Biden’s longer term economic recovery plan including infrastructure and clean energy initiatives as well as any measures that do not make it into the initial bill – notably the minimum wage hike. On the stimulus package, House Majority Leader Hoyer said in a call with Congressional Democrats that the House is aiming to vote on Feb 26. A vote in the Senate will take place shortly thereafter in order for the benefits to be enacted by mid-March when much of the previous pandemic relief runs out.
Note that it was announced yesterday that Powell will be delivering the semi annual policy report to Congress next Tuesday so it’ll be interesting whether he continues to be as dovish as he has been recently given these moves and the ongoing stimulus debate. 7 days is a long time in markets so we’ll see where yields are then but it could be a big focal point for markets.
Over in Europe it was much the same story yesterday, with 10yr bunds seeing a +3.3bps increase to -0.35%, their highest level since last June. The moves were given added support by a couple of positive data surprises, with the expectations reading in the German ZEW survey unexpectedly rising to a 5-month high of 71.2 (vs. 59.5 expected), whilst the Q4 GDP print for the Euro Area as a whole was revised down a tenth to show a smaller -0.6% contraction. Italian debt was on its way to once again outperforming, with their spread over bunds tightening a further -1.5bps intraday to a 5-year low of 0.89%, before a late widening saw the spread finish +1.2bps wider overall at 0.92%. That came as a 10-year bond offering in Italy attracted a record €110bn in demand, demonstrating how investor expectations are incredibly high for Draghi’s performance as PM. Speaking of Draghi, his government will face a confidence vote in the Senate today, before another vote takes place in the lower house tomorrow, though given his broad base of support among most of the political parties, he should count on a very large majority in parliament.
Asian markets are generally dipping this morning with the Nikkei (-0.56%), India’s Nifty (-0.60%), Kospi (-1.12%) and Asx (-0.46%) all down. An exception to this pattern is the Hang Seng which is up +0.76%. China’s markets continue to remain closed and will again open tomorrow. Futures on the S&P 500 are trading broadly flat while in keeping with the slight risk off tone, the US dollar index is up +0.15%.
Turning to the coronavirus pandemic, our chart in today’s email looks at the share of people in England who’ve got Covid-19 antibodies by age, which comes from the Office for National Statistics’ Covid-19 infection survey. The second of this series came out yesterday, which has allowed us to compare the data between the two points, and it shows that the biggest spike in antibodies has been among the over-80s. This makes sense when you consider that they were first in line for vaccinations, and that it takes another 2-3 weeks for the body to generate enough antibodies to fight infection. Over the coming weeks, you’d expect that increased vaccination numbers should send those percentages up further for the elderly groups, and move us closer to herd immunity. So this is a good news graph which hopefully will turn into a huge drop in cases for this group when the economy reopens. The vaccination table and the usual case and fatalities tables are in the pdf as ever.
Elsewhere, President Biden expressed confidence in his target of administering 100m vaccine doses within his first 100 days in office. In a tweet, Biden said “I believe we’ll not only reach that, we’ll break it.” This comes as the country is increasing vaccine supply to 13.5mn doses per week, up from 11mn and the Biden Administration will double the number of shots available at pharmacies. During the aforementioned townhall late last night, President Biden said that the US expects to have 600M vaccine doses by the end of July, which would make it possible to inoculate all residents. The president also made clear that the goal is to have schools reopened fully by the end of his first 100 days. Meanwhile, amidst the progress on vaccinations, the US has also seen a 39% decline in hospitalisations from a winter peak of 114,281 on January 25. As of yesterday, the hospitalization from the disease stood at 70,277.
Over in the EU, the European Medicines Agency received Johnson & Johnson’s application for conditional marketing authorisation for its Covid vaccine. The EMA said that they could issue an opinion by mid-March, which would make it the fourth vaccine to be authorised in the EU, after BioNTech/Pfizer, Moderna and AstraZeneca’s.
In other news, the US energy shortages continued yesterday thanks to the recent cold weather, with nearly 5 million left without electricity. Given the freezing temperatures in Texas and the Midwestern US, oil refineries and shale wells were closed which continued to push up oil prices. Occidental Petroleum (+4.21%), the second largest crude producer in the Permian Basin, declared a force majeure to its customers – indicating to buyers that Occidental is being forced to curb deliveries for an undetermined length of time. However, WTI oil prices have eased back from their intraday highs on Monday, when they hit $60.95/bbl, and closed yesterday at $60.10/bbl.
Given the power outages in Texas, planned remarks from Dallas Fed President Kaplan were cancelled yesterday. However, we did hear from St Louis Fed President Bullard, who said in a CNBC interview that he didn’t think there was a bubble in markets, even as he acknowledged that stocks were “highly valued on the whole.” We also heard from the San Francisco Fed President Daly that she does not believe there is “unwanted inflation right around the corner” and that the fear of inflation could cost “millions of jobs”. Staying on the Fed, later today we’ll get the minutes of last month’s FOMC meeting, which our US economists say should point to upside risks to the growth outlook given the prospects for further fiscal stimulus this year. However, as the comments above illustrate, Fed officials have resoundingly reiterated that the threat of an unwanted inflation overshoot remains low, and Chair Powell set the tone last week when he reiterated that the US was still “very far from a strong labor market whose benefits are broadly shared”. So overall our economists don’t expect the minutes to yield any specifics on tapering other than to reiterate that they’ll seek to provide guidance “well in advance”.
To the day ahead now, and there are a number of US data releases, including January’s retail sales, industrial production and PPI, while there’s also the NAHB housing market index for February. Otherwise, there’s also the January CPI readings from the UK and Canada. Separately, we’ll also get the minutes of the Federal Reserve’s January meeting, and the Fed’s Barkin, Rosengren and the BoE’s Ramsden will be speaking.
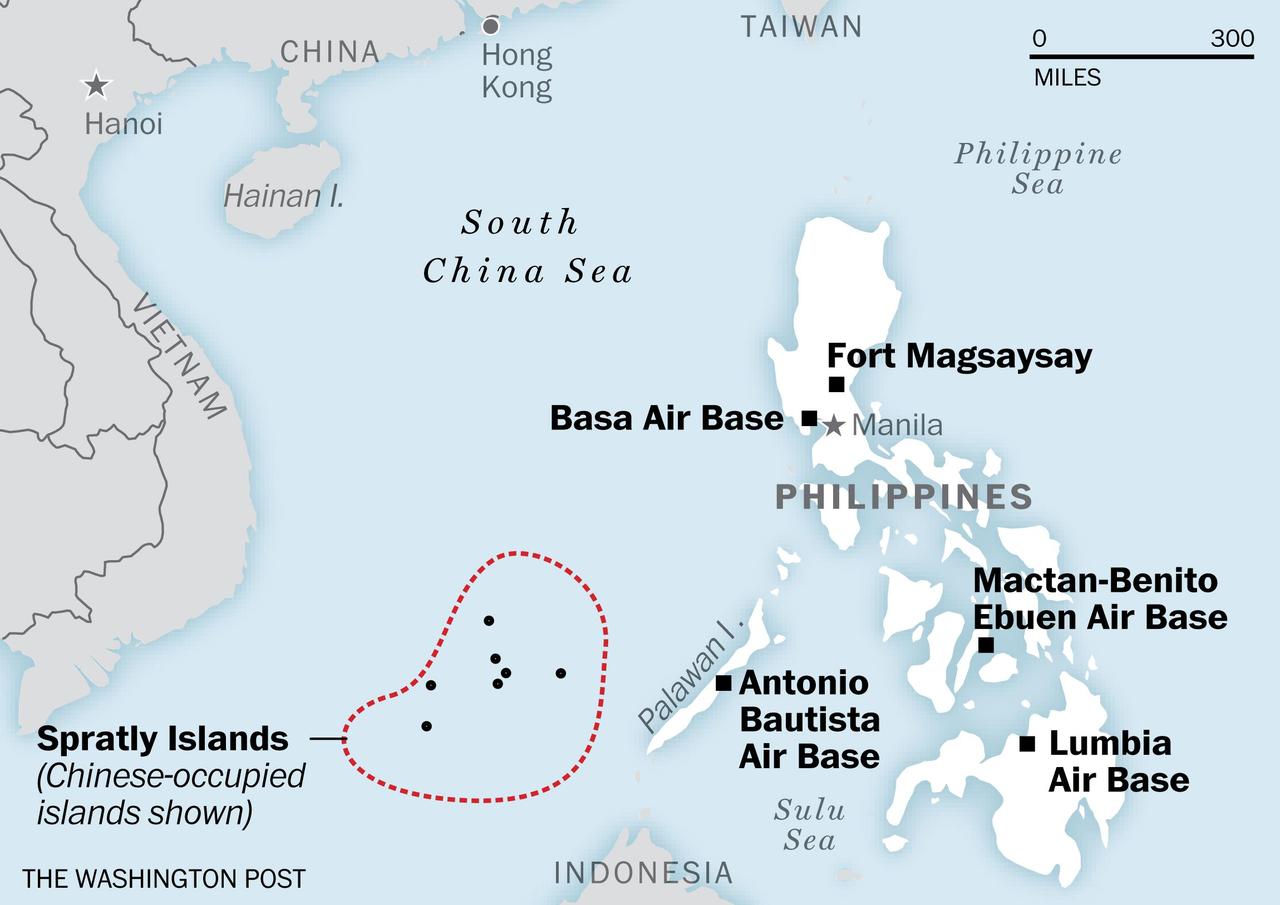
US Warship Sails By China-Controlled Islands, Angering Beijing
Following conflicts over trade, technology, and capital markets, tensions between the US and China continue to rise with the latest escalation coming after a US Navy warship sailed near China-claimed islands in the South China Sea on Wednesday. This was the second sailing of a warship near China’s heavily disputed islands under the Biden administration, according to Reuters.
The US Navy’s 7th Fleet’s USS Russell (DDG-59), an Arleigh Burke-class destroyer, sailed within 12 nautical miles on a “freedom of navigation operation” (FONOP) of the Spratly Islands, consistent with international law.
“This freedom of navigation operation (“FONOP”) upheld the rights, freedoms and lawful uses of the sea recognized in international law by challenging unlawful restrictions on innocent passage imposed by China, Vietnam and Taiwan,” Lt. Joe Keiley, a spokesman for the US Navy’s 7th Fleet, said in a statement.
The Russell’s FONOP followed a similar operation earlier this month when the USS John S. McCain, an Arleigh Burke-class destroyer, entered the waters near Paracel islands. This is the second sailing in the last couple of weeks under the Biden administration as they step up pressure on China.
The two destroyers’ sailings in the South China Sea come a little more than one week after USS Theodore Roosevelt and USS Nimitz, two supercarriers, conducted rare drills in the heavily disputed waters.
“Unlawful and sweeping maritime claims in the South China Sea pose a serious threat to the freedom of the sea, including freedoms of navigation and overflight, free trade and unimpeded commerce, and freedom of economic opportunity for South China Sea littoral nations,” Keiley said in the statement.
The heavily disputed waterway is one of the flashpoints in the US-China relationship, including a trade war, technology war, US sanctions, Hong Kong and Taiwan.
Meanwhile, according to the latest naval deployment map from Stratfor, CVN 71 Roosevelt is underway in the Philippine Sea, and CVN68 Eisenhower is underway in the Atlantic Ocean following a Middle East deployment.
Over the past year, the US has increased aerial patrols, and US Navy warship sails through the disrupted region and near and through the Taiwan Strait, an exercise aimed at angering Beijing. Such “close encounters” and US flyovers and sail throughs in the South China Sea and near Taiwan became more frequent during the Trump presidency’s tail-end.
In President Biden’s first foreign policy address earlier this month, he described China as the “most serious competitor” to the US and promised to confront Bejing on multiple levels.
“We’ll confront China’s economic abuses, counter its aggressive, coercive actions, and push back on China’s attack on human rights, intellectual property, and global governance,” Biden said.
3 Million Texans Without Power As Grid Chaos Continues Ahead Of Imminent Ice Storm
Here are the key takeaways from rolling blackouts in Texas:
Oncor Electric Delivery Warns Of Additional Outages
Fuel Shortages Develop In Western Half Of Texas
Power Prices Jump In Austin As Evening Sets In
Gov. Greg Abbott Calls For ERCOT Leadership To Resign
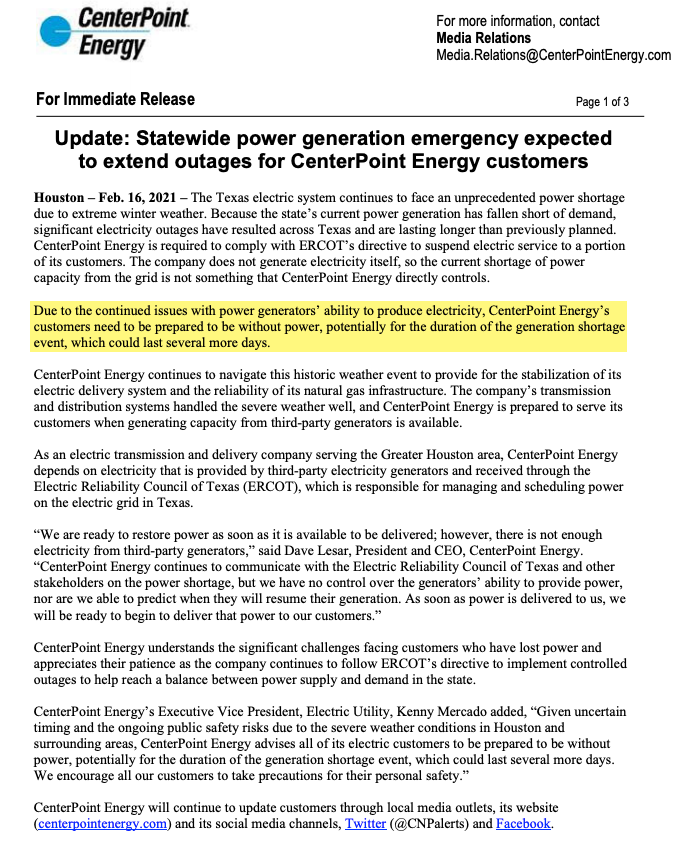
CenterPoint Energy Warns Power Shortages Could Last “Several Days”
Power Grid Crisis Spreads To Mexico
15 States Have Power Outages Due To Extreme Weather
Gov. Greg Abbott Requests LNG Exporter Freeport To Limit Gas Intake
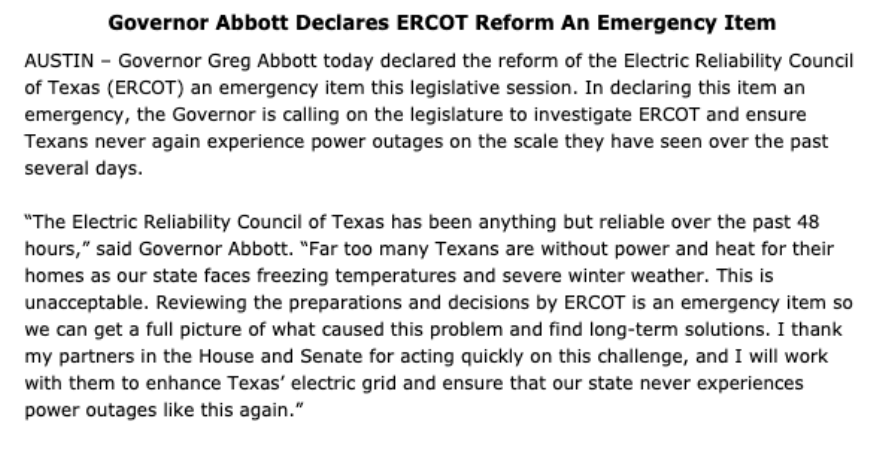
Gov. Greg Abbott Declares ERCOT Reform
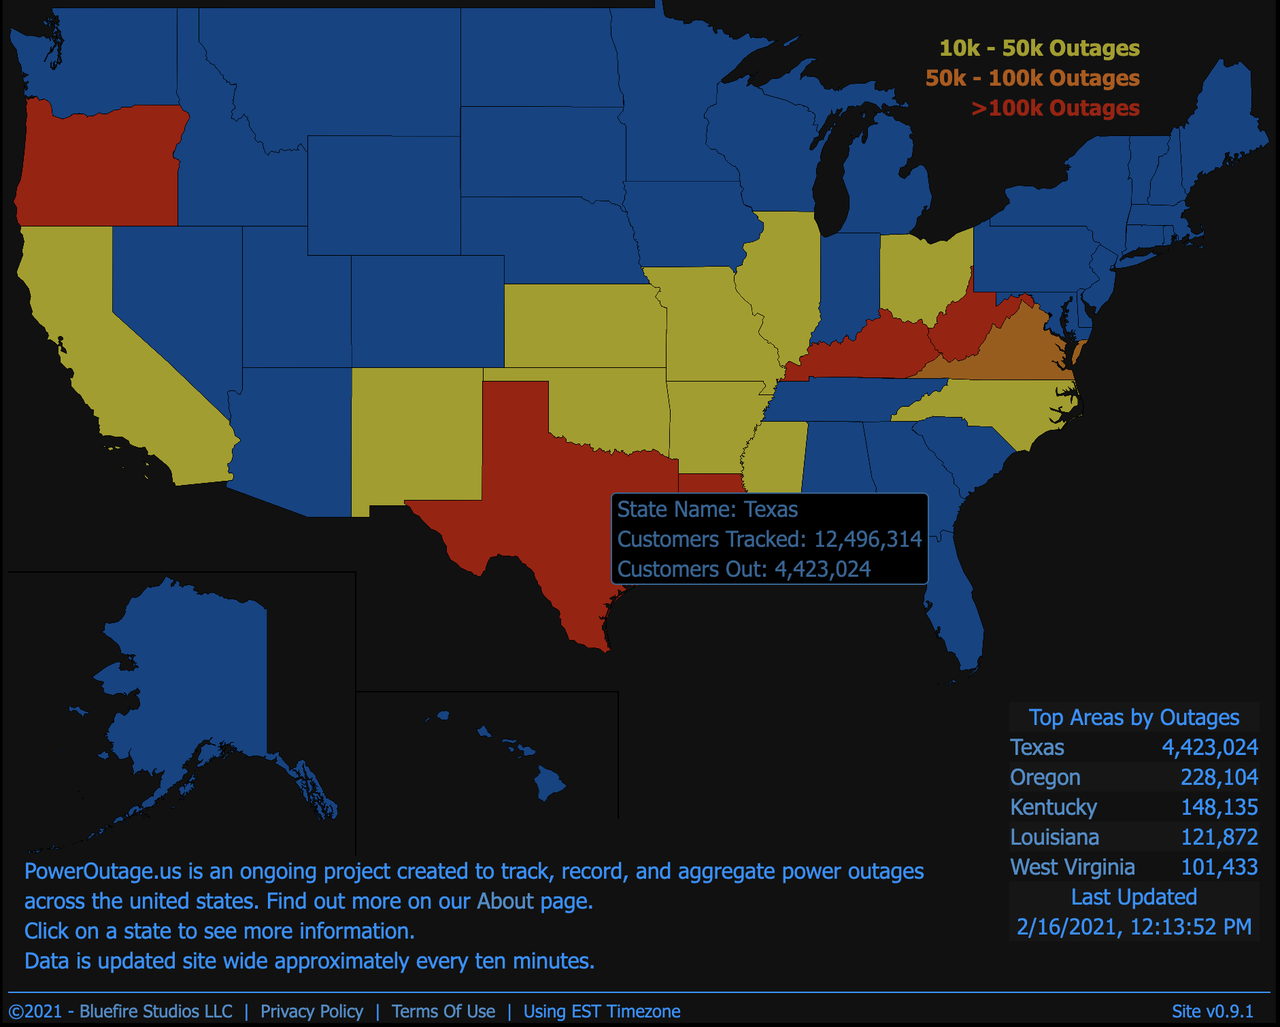
4.423 million Customers In Texas Without Power
Bloomberg’s Javier Blas Warns “Blackouts Have Spread Again”
General Motors Idles Arlington Assembly Factory
Oncor Electric Delivery Warns Of “Controlled Outages” Across State
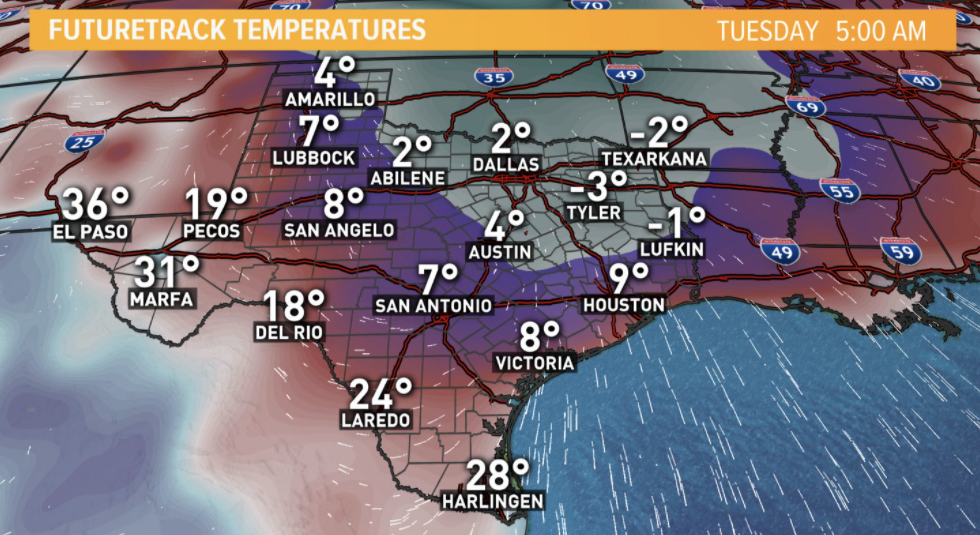
Temperatures In Tyler, Texas -3F On Tuesday Morning
ERCOT Hopes To Restore Power With More Generators Returning To Grid
The Southwest Power Pool Said Blackouts To Continue For The Second Day
Houston Police Chief Art Acevedo Tweets Weather-Related Death
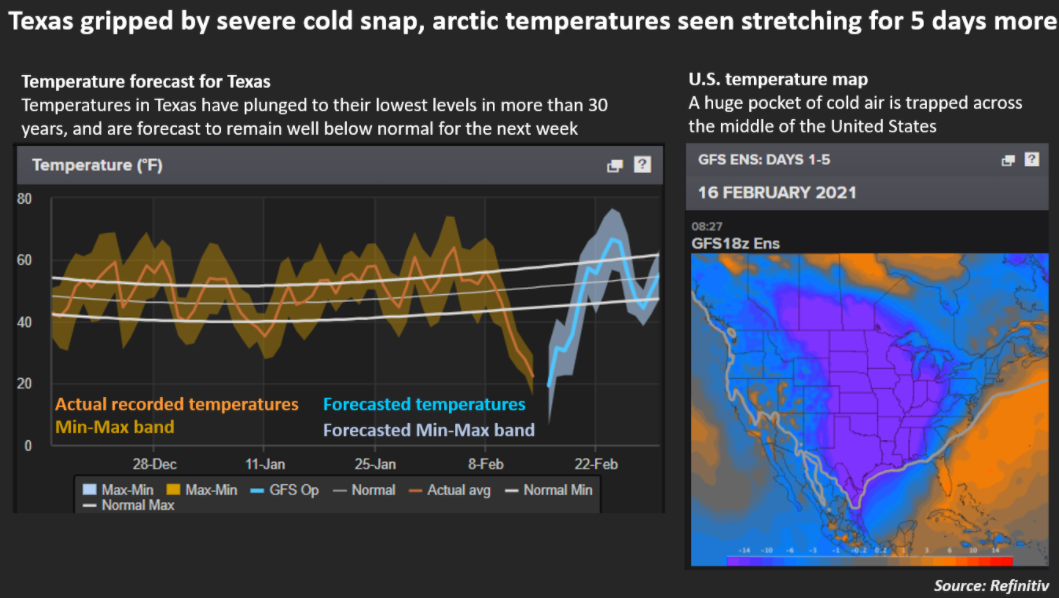
Refinitiv Data Shows Arctic Air To Remain In Texas Until End Of Week
ERCOT Wholesale Electricity Prices Topped $9k Per Megawatt-Hour Overnight
Rolling Blackouts Morph Into Down Celular Networks
Texas Prepares For Second Winter Storm
* * *
Update (2149ET): Oncor Electric Delivery, Texas’ largest transmission and electric distribution utility, warns customers to “be prepared for additional outages and stay weather aware due to an active Winter Storm Warning.”
People are freezing in their own homes.
My sister, who lives in Port Lavaca, TX, hasn’t had electricity since 1am Monday. There is nothing “rolling” about that. Her electric provider claims they are awaiting permission from @ERCOT_ISO – please explain. Her house is 37 degrees. https://t.co/f1zKsnmplspic.twitter.com/sGkqexucW0
Update (2139 ET): The cold snap in Texas has forced the shutdown of “refineries, oil wells, and meat plants, disrupted shipments of soybeans and corn, and is still leaving more than 3 million customers without electricity could continue to keep parts of Texas in the dark for several days,” according to Bloomberg.
With more than 3 million customers without power, there is no way ERCOT will restore power tonight. It could be a couple of days before full power is restored.
Bloomberg also said fuel storages are developing in the western half of the state.
* * *
Update (2048 ET): This certainly won’t sit well with Texans after experiencing one of the worst power grid collapses in the state’s history.
* * *
Update (1929 ET): Gov. Greg Abbott told ABC13 Houston that ERCOT had provided him with zero answers about the ongoing power grid collapse across Texas.
ABC13’s Gina Gaston asked Abbott if ERCOT leadership should resign. He immediately responded with “yes.”
The local media outlet also said residents should prepare for the next round of wintery weather, expected to hit the state on Tuesday night.
Winter weather watches and warnings have been posted for most of the state.
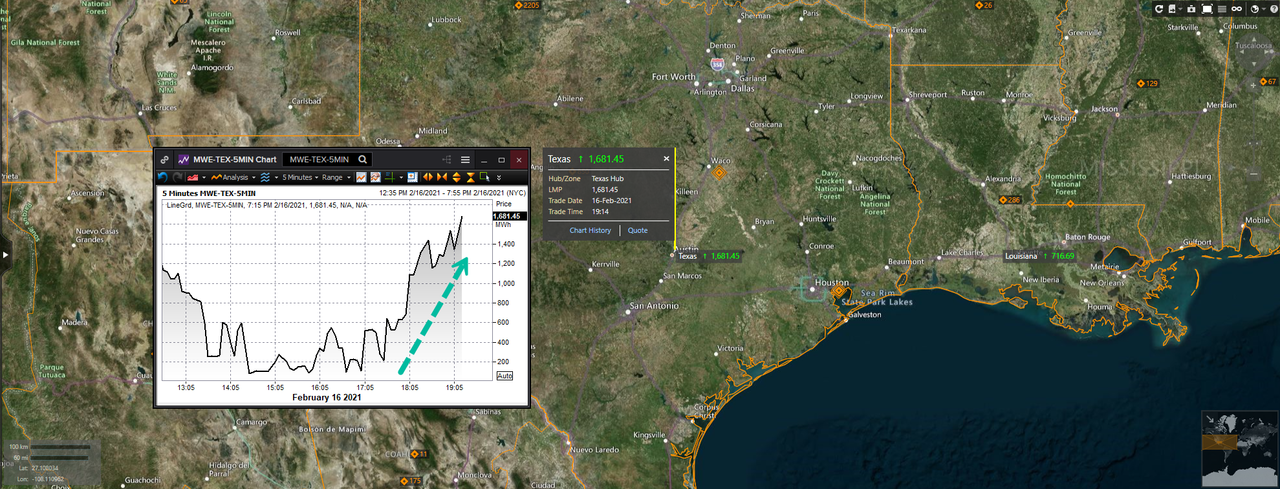
As evening sets in Texas, power prices in Austin are exploding higher. In the last 145 minutes, prices have jumped 1,346% to $1,600 per MWh.
More than 3 million customers remain without power in Texas.
Stay warm.
* * *
Update (1818 ET): CenterPoint Energy, the utility that delivers electricity to Houston-area homes and distributes natural gas, provided an update on the ongoing grid chaos in Texas with some bad news Tuesday evening.
CenterPoint said power shortages could last “several more days” and warned customers “to take precautions for their personal safety.”
*HOUSTON POWER OUTAGES COULD LAST SEVERAL MORE DAYS: CENTERPOINT
Update (1650 ET): ERCOT President and CEO Bill Magness provide an update on the power outage situation in Texas.
Watch Live
KUT Austin’s Claire McInerny has so far summed up the ERCOT presser as the”worst” ever media briefing she “has ever been a part of.”
this is THE WORSE media briefing I have ever been a part of.
the @ERCOT_ISO communications person is reading questions that people are texting her? which doesn’t give everyone an opportunity to submit a question. this is INSANITY. local people can’t ask questions
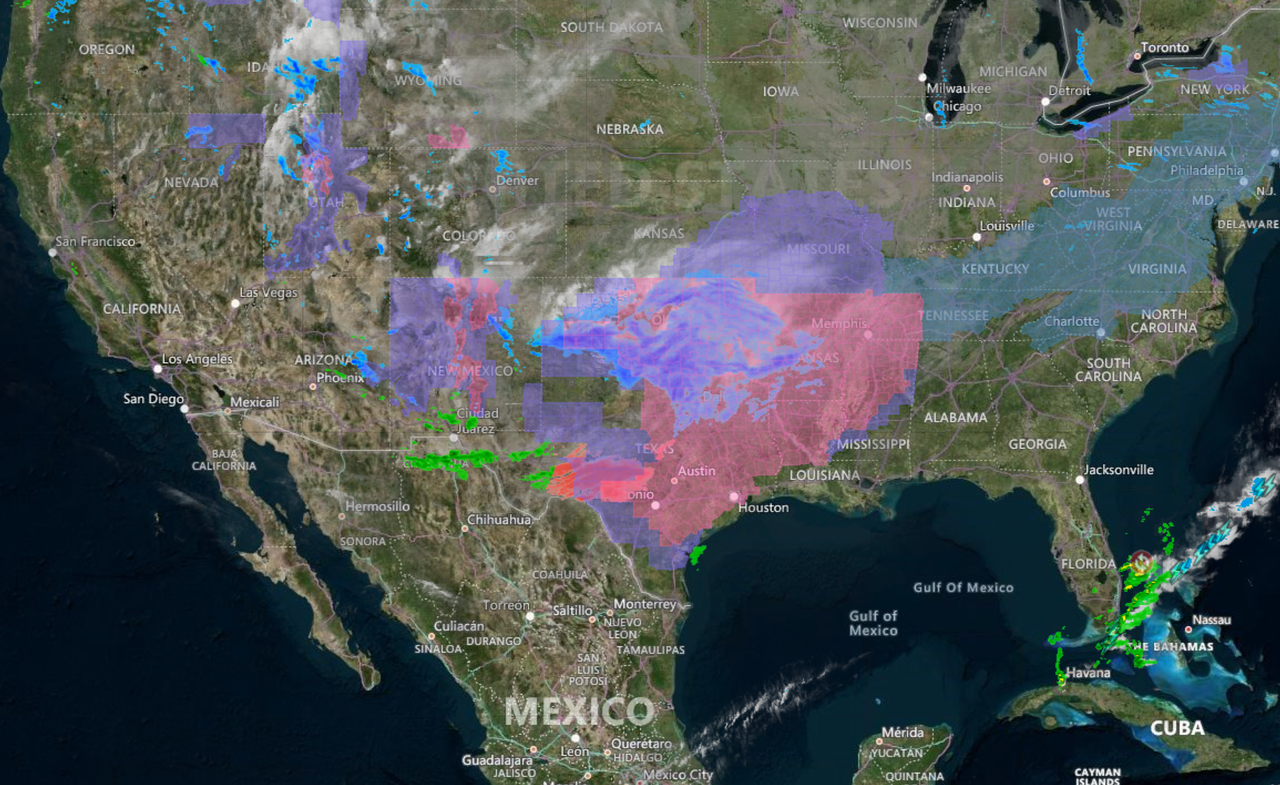
Update (1415 ET): Rolling blackouts and power outages have hit 15 states on Tuesday as a polar vortex dumps Arctic air into much of the country.
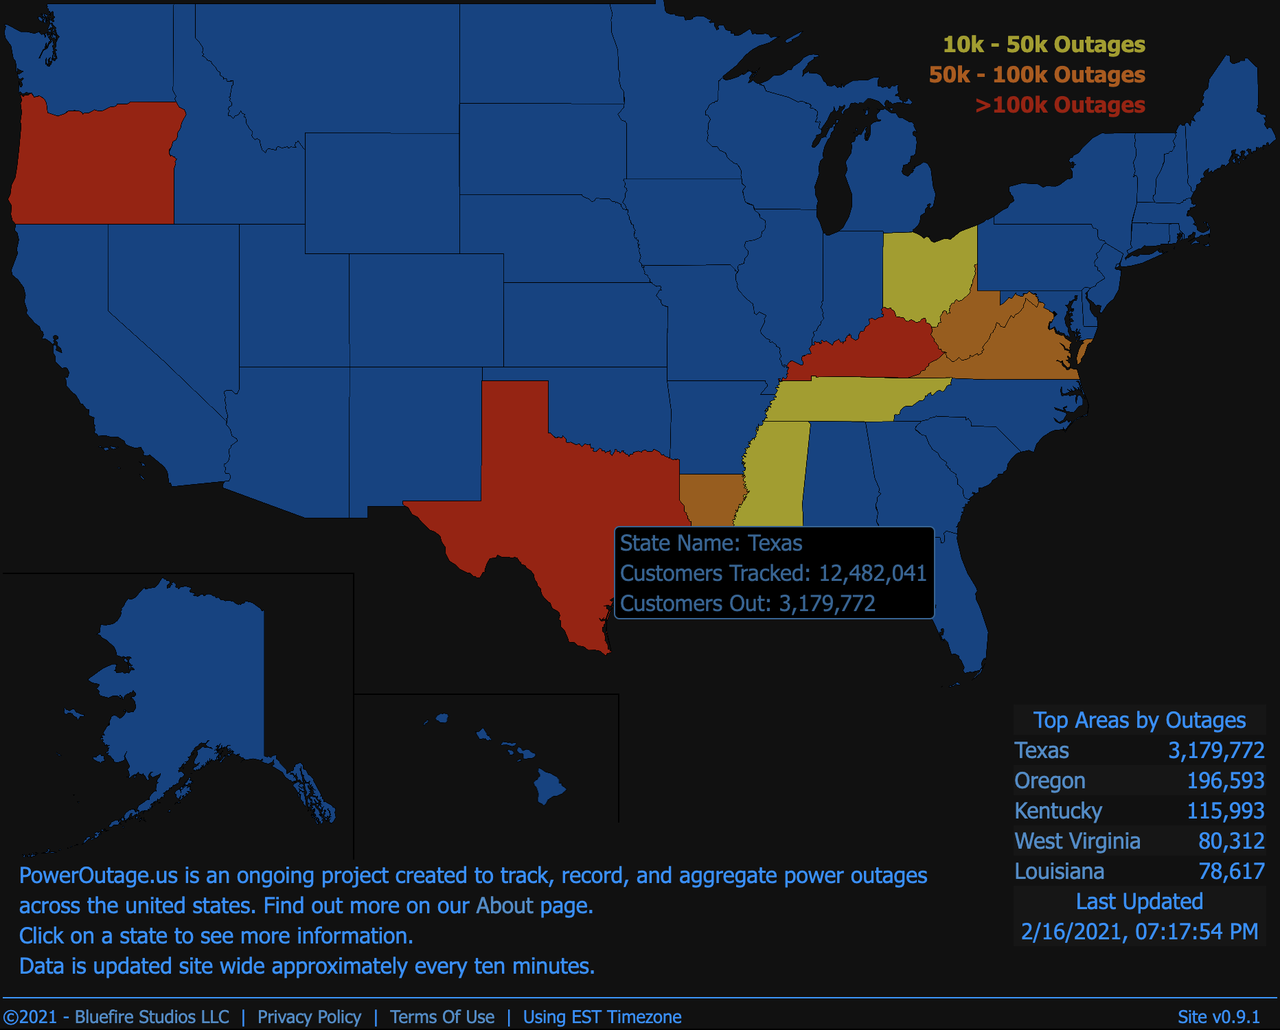
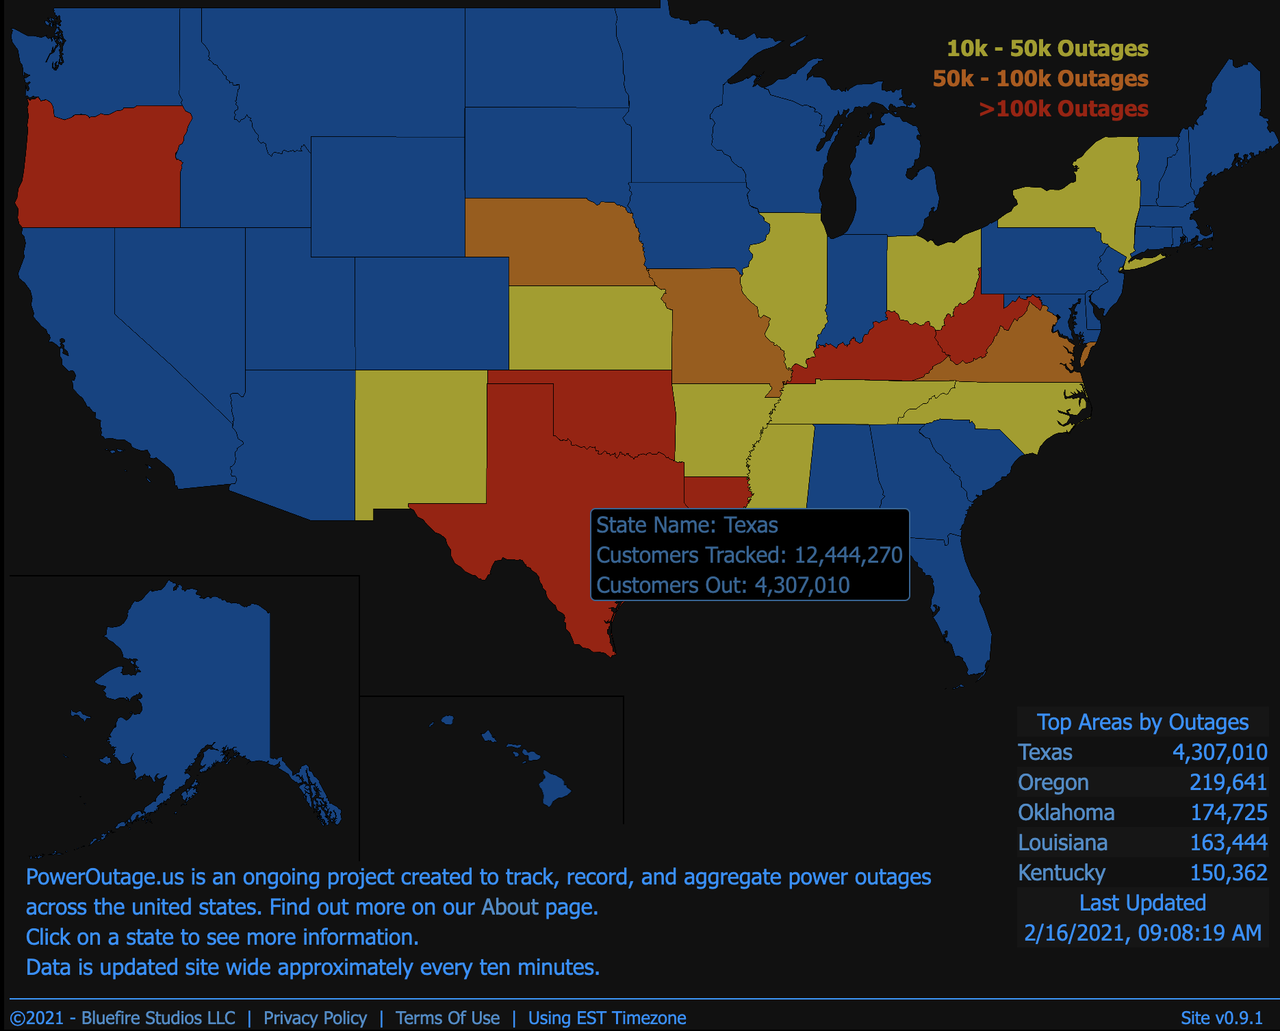
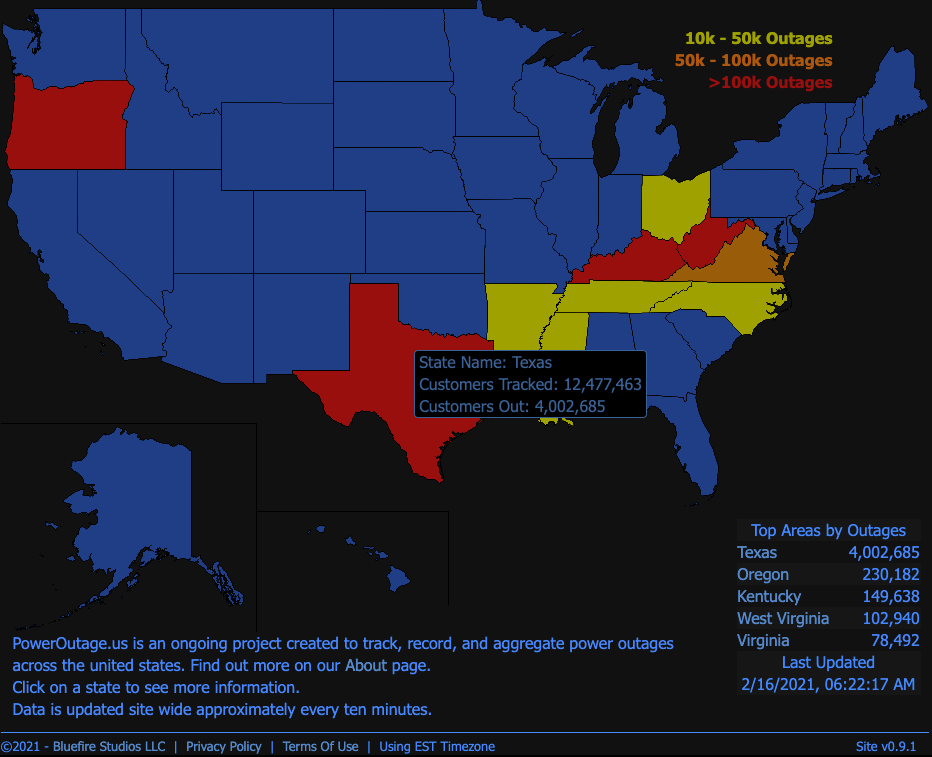
According to PowerOutage.US, 15 states are experiencing rolling blackouts or outages because of extreme weather. Most of the outages are seen in Texas, with over 4 million customers without power (as of this update).
The polar vortex will continue pouring frigid air into much of the country through this week. Temperature anomalies are well below normal, creating major power-grid chaos.
The disruption has spilled over into Mexico, where the US has curbed natural gas exports, resulting in power stations grinding to a halt.
OilPrice.com expands more on the chaos unfolding across Mexico’s northern power grid.
The plummeting natural gas exports from the United States to Mexico amid an Arctic cold spell in the country that has led to a gas demand surge is causing blackouts in northern Mexico, with some 4.77 million households and businesses left without power on Monday.
Argus noted that most of the natural gas Mexico receives from the United States comes from the Permian, where the production of both oil and gas has been affected by the cold weather that has caused power outages across Texas.
Oil wells are being shut down, and so are refineries along the Gulf Coast, Reuters reported earlier today, adding oil and gas pipeline operations were also disrupted by the weather.
The blackouts, Bloomberg reports, will strengthen the government’s argument that Mexico needs to be less dependent on energy imports, with President Andres Manuel Lopez Obrador spearheading the drive to reduce this dependency. Obrador wants to boost Mexico’s domestic oil and gas production to tackle the problem, but this has proved challenging without the participation of private energy companies as the president seeks to fortify the dominant status of state energy major Pemex.
* * *
Update (1313 ET): Gov. Greg Abbott has requested LNG exporter Freeport to limit gas intake as domestic supplies are low due to frozen wellheads.
Winter blast in plains expected to last through next weekend. Supply is literally frozen. Midcontinent NG could hit GME^batshit levels https://t.co/pFvSgwovxz
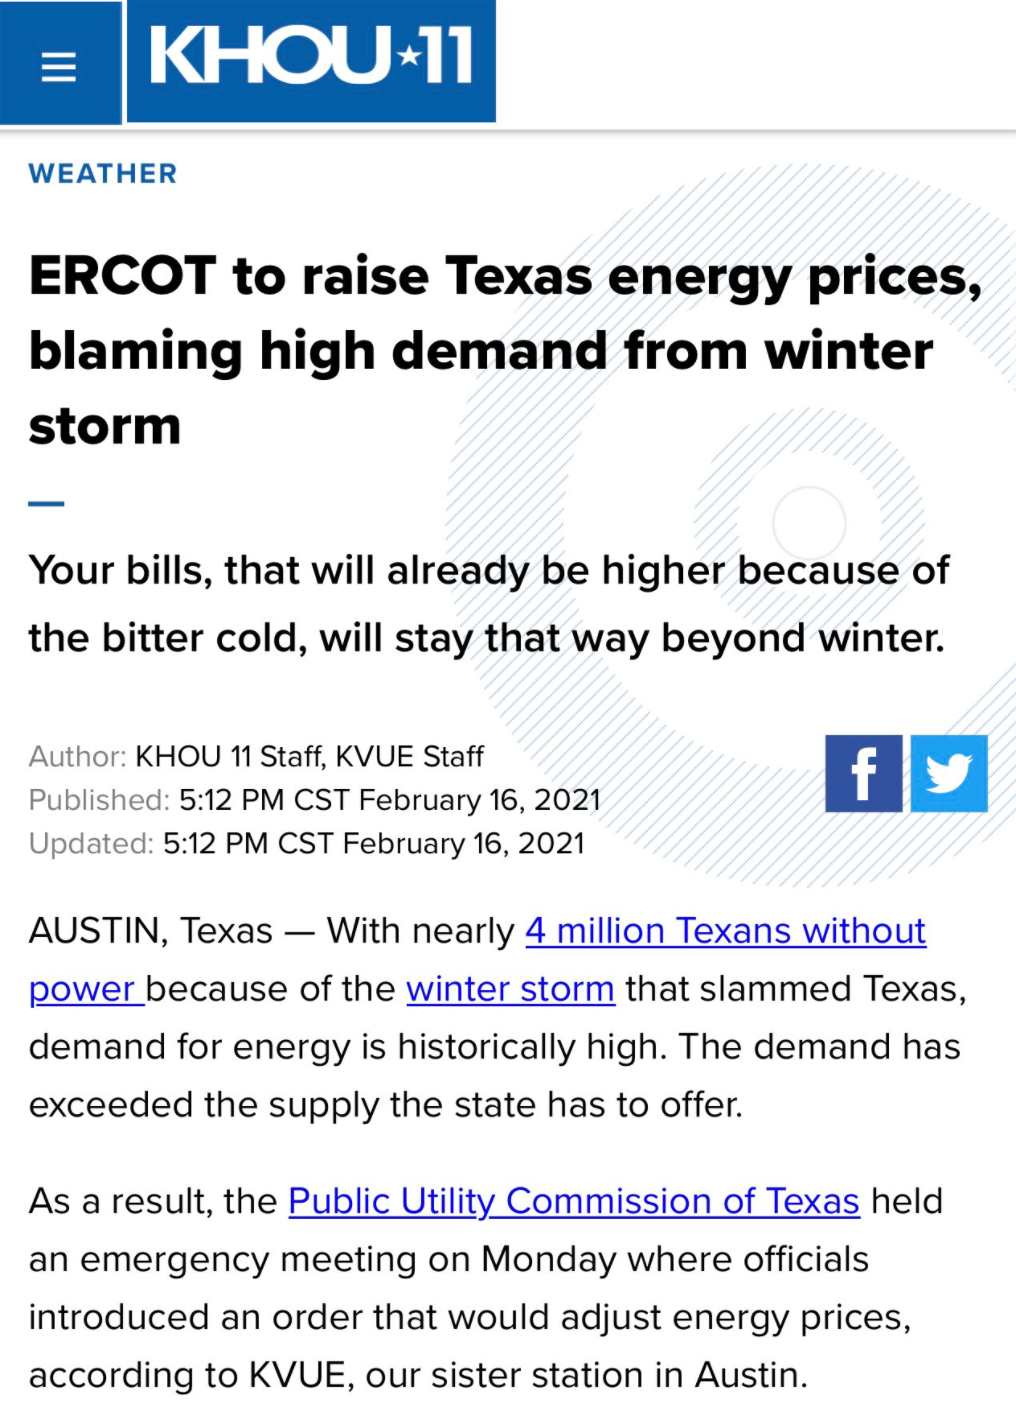
The lack of gas flowing to powerplants plus unprecedented demand for power has resulted in the state’s highest-ever electricity rates. Power demand has surpassed supply leading to massive blackouts for the last couple of days. The goal now is to get power generation back online.
* * *
Update (1256 ET): Following the power grid collapse in Texas, Gov. Greg Abbott released a statement Tuesday that “declared the reform” of ERCOT in the new legislative session. Abbott will pressure lawmakers to investigate ERCOT’s failures and make sure rolling blackouts never happen again.
“The Electric Reliability Council of Texas has been anything but reliable over the past 48 hours,” said Abbott. “Far too many Texans are without power and heat for their homes as our state faces freezing temperatures and severe winter weather. This is unacceptable. Reviewing the preparations and decisions by ERCOT is an emergency item so we can get a full picture of what caused this problem and find long-term solutions. I thank my partners in the House and Senate for acting quickly on this challenge, and I will work with them to enhance Texas’ electric grid and ensure that our state never experiences power outages like this again.”
Here’s the full text:
* * *
Update (1234 ET): ERCOT officials have promised to restore some power generation today, but according to PowerOutage.US, around 1221 ET, there are more than 4.423 million customers without electricity in the state. That’s up 100k since 0900 ET.
Bloomberg’s Javier Blas tweets out he “doesn’t have good news” concerning the power grid collapse in the state.
“The load on the ERCOT grid is right now nearly the lowest it has been since the blackouts started more than 36 hours ago. Load climbed a bit earlier (see chart, note GMT hours), but since has fallen, which indicates blackouts have spread again.”
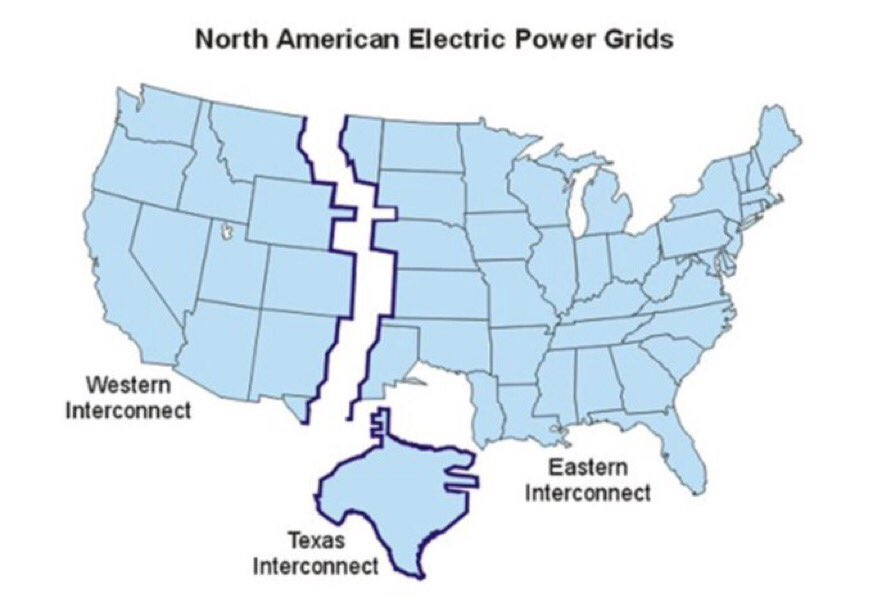
Update (1208 ET): There are three major power grids in the Lower 48 states: the Eastern Interconnection, the Western Interconnection — and Texas Interconnection.
The Texas grid is called ERCOT (Electric Reliability Council of Texas). It covers 90% of the state’s electric load except for El Paso and the upper Panhandle, and East Texas.
Local utilities under ERCOT have pledged not to sell their power to out-of-state customers. Texas grid’s independence dates back to World War II.
While there’s little pressure to integrate ERCOT into the national grid, that could all change with the latest wave of blackouts across the Lone Star State.
* * *
Update (1003 ET): Some Texans have been living in their cars to stay warm as rolling blackouts have left millions without power.
CBS DFW spoke with at least one person who’s been sitting in his car since Sunday to get warm.
Collin County resident Clint Cash has had no power in North Texas for a couple of days. He said his house went dark Sunday, which was when he decided to bundle up and sit in his parked car with the heater on full blast.
Isha Elhence, a Dallas resident who lost power around 2 a.m. Monday, was quoted by Bloomberg as saying, “We lost power around 2 a.m. Monday. It was only supposed to be for one to two hours, which seemed manageable… Now it’s kind of indefinite with no updates, so we’re unsure of what we’re supposed to be doing.”
“This is extremely dangerous,” said Eric Berger, a forecaster with Houston’s Space City Weather.
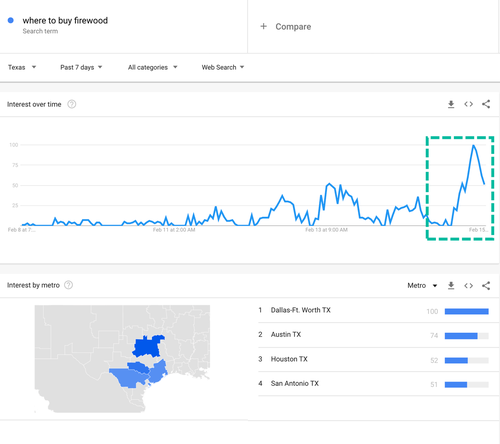
As the rolling blackouts increased across Texas, we noted Monday evening, internet searches for firewood exploded across the state.
Internet searches for “where to buy firewood” erupted on Monday.
Texas’ grid collapse has transformed the state into a third world country.
* * *
Update (0950 ET): With temperatures near zero this morning, GM decided to idle its massive Arlington Assembly plant due to “weather problems” for the second day. The facility sits on about 250 acres and employs approximately 5,480 people.
There are no further updates on when the facility will reopen. Temperatures are expected to stay frigid until the end of the week.
* * *
Update (0915 ET): Oncor Electric Delivery, Texas’ largest transmission and electric distribution utility, tweeted:
“Due to ongoing record-low temps and generation, @ERCOT_ISO has continued to direct Oncor & utilities across TX to drop power load through maintained controlled outages. These controlled outages are occurring across the state and our entire service territory.”
Oncor also tweeted:
“At this time, @ERCOT_ISO is unable to predict when grid conditions will stabilize. All customers are urged to be prepared for cont’ extended outages. Please also prioritize safety. Warming stations are available in many areas- check online or call 211 for more.”
Temperatures across Texas this morning are absolutely frigid.
At the moment, PowerOutage.US shows 4.307 million customers in Texas are without power.
* * *
Update (0854 ET): Texas power grid operator ERCOT, which represents 90% of the state’s electric load, tweeted Tuesday morning that “generators to return, renewable output to increase = increased customer restoration.”
Bloomberg published a headline that said the grid operator expects all power to be back on Tuesday evening.
“It’s a function of how many generations we are able to get back on line, especially gas and coal,” Dan Woodfin, a senior director for the ERCOT, said in an interview. “It could be as early as early afternoon today. But then it is also possible it could go into the evening hours tonight.”
However, Bloomberg’s Javier Blas said the grid is “still short of at least 18.5 GW.” He said that equates to outages for at least 3 million homes.
ERCOT confirms what I was calculating earlier: the grid is still short of at least 18.5 GW. That’s a staggering number, which equals probably to ~3 million homes, at the very least. This is ~36 hours into the rolling blackouts | #texaspoweroutagehttps://t.co/gnvMCNOuOB
Update ( 0832 ET): The Southwest Power Pool (SSP), which manages the electric grid and wholesale power market for the central US, including Kansas, Oklahoma, portions of New Mexico, Texas, Arkansas, Louisiana, South Dakota, North Dakota, Montana, Missouri, Minnesota, Iowa, Wyoming, and Nebraska, said Tuesday morning that blackouts would continue for a second day.
Here’s what blackouts in Houston looked like overnight.
Why are the ‘poor’ suburban areas dark while downtown is all lit up?
* * *
Four million Texans are without power Tuesday morning after a polar vortex split poured Arctic air into the region, collapsing the state’s power grid, forcing grid operators to impose rolling blackouts because of higher power demand.
The PowerOutage.us website, which tracks power outages, said four million Texas customers were experiencing outages at 0630 ET Tuesday.
Houston Police Chief Art Acevedo tweeted that a weather-related death was reported Monday night. He said exposure to “extremely low temperatures” was the cause of death.
Very sad about the death of a male subject in our city. Please seek shelter tonight. Temperature is already down to 20 degrees with windchill of 6 degrees. pic.twitter.com/5NSu8Wa155
Acevedo tweeted, “Please pray for our elderly and vulnerable populations tonight. With the 2nd consecutive night of massive power outages and frigid cold, many lives are at risk. State of Texas leaders must do better, lives depend on it.”
Refinitiv data shows Texas continues to deal with Arctic air, now stretching for the fifth day.
Below-average Texas temperatures will likely clear out by the end of the weekend.
ERCOT wholesale electricity prices topped the grid’s price cap of $9,000 per megawatt-hour several times in the overnight session. Reminding readers, ERCOT prices are usually around $25/MWh.
Meanwhile, rolling blackouts have set off a chain reaction of problems. RT News reports “some water treatment plants and cell phone networks” are offline.
Several metro areas across central Texas warned of water issues.
Due to a prolonged power outage at the water treatment plant, Pflugerville is under a boil water notice. We are working with Oncor to restore power, but until further notice, all city water customers must boil their water prior to consumption. (1/3) pic.twitter.com/alhpeSfyaN
Governor Greg Abbott wrote on Twitter that “Texas power grid has not been compromised.” However, millions of Texans are unhappy with his response to the grid crisis that has sparked chaos across the state. He deployed National Guard troops to assist the state in relief efforts.
Living in Texas sounds like a third-world country. Here’s a tweet from Dallas County Judge Clay Jenkins:
“The additional shed coupled with increased demand will likely increase blackout numbers and times. We should discuss how Texas let this happen. I understand your anger. I’m angry too. But tonight-right now- is about human and animal survival. Check on and help one another!”
President Joe Biden declared an emergency on Monday for the Lone Star State, where temperatures in some areas hovered near zero.
The freeze also took a toll on the state’s energy industry, the country’s largest crude refinery shuttered operations on Monday. Over the weekend, natural gas pipelines had restricted flow as wellheads froze.
… and the worst might not be over as a second winter storm could batter the state by midweek.
Ebola is back, and people are starting to die. So should we be concerned?
When I first heard that a new Ebola cluster had been identified in eastern Congo, I didn’t think too much of it, but now an “Ebola epidemic” has been declared in the country of Guinea in west Africa. So far, four people have died, and more victims are being treated. These are the very first Ebola deaths in Guinea since the horrific outbreak that finally ended in 2016. Global health authorities are rushing to contain this new “epidemic”, because there would be grave consequences if an Ebola outbreak is allowed to spiral out of control. According to Wikipedia, the average death rate during an Ebola outbreak is “about 50%”…
Ebola, also known as Ebola virus disease (EVD) or Ebola hemorrhagic fever (EHF), is a viral hemorrhagic fever of humans and other primates caused by ebolaviruses.[1] Signs and symptoms typically start between two days and three weeks after contracting the virus with a fever, sore throat, muscular pain, and headaches.[1]Vomiting, diarrhoea and rash usually follow, along with decreased function of the liver and kidneys.[1] At this time, some people begin to bleed both internally and externally. The disease has a high risk of death, killing 25% to 90% of those infected, with an average of about 50%.[1] This is often due to low blood pressure from fluid loss, and typically follows six to 16 days after symptoms appear.
Dying from Ebola is a truly horrifying way to go.
I am sure that many of you remember the panic that ensued a number of years ago when it was revealed that Ebola patients were being flown into the United States for treatment. Thankfully that did not result in an outbreak here in the United States, but at the time people were extremely concerned about what might happen.
Once it gets loose in an area, Ebola can be an absolute nightmare for health authorities, and that is why the epidemic in Guinea is being taken so seriously…
On Monday morning, a fourth victim died in Guinea and four others are being treated in an isolation centre, suffering vomiting, diarrhoea and bleeding. At least seven of the people who contracted the virus attended the funeral of a nurse in Goueke, a town near the Liberian border, on 1 February the government said on Sunday.
“All measures are being taken to stem this epidemic as soon as possible,” Guinea’s health ministry said, declaring an outbreak of the virus last seen in the region in 2016 – at the end of a traumatic three-year outbreak, which infected more than 28,000 people and caused 11,000 deaths in west Africa.
Hopefully they have gotten on top of this outbreak early enough to be able to contain it easily.
But what is strange is that this new epidemic in Guinea comes right on the heels of a new outbreak in eastern Congo…
Guinea’s new outbreak follows a resurgence in eastern Congo, where four cases have been reported – the latest on 14 February. Since August 2018, the region has been grappling with the world’s first Ebola outbreak in an active conflict zone. The new cluster emerged three months after the country’s last outbreak – in the west of the country – was declared over. In total, there have been 12 outbreaks in Congo since Ebola was first identified in 1976.
If you look at a map of Africa, you will see that Guinea and Congo are not anywhere near each other.
So right now we have two outbreaks of Ebola at the exact same time in two vastly different regions of the continent.
That seems rather odd, doesn’t it?
The good news is that Ebola does not spread very easily from person to person, and global health authorities have had a lot of practice in containing Ebola outbreaks over the last several decades. As one official told NBC News, speed is the key to containing these sorts of outbreaks…
“There are tools and systems that can be mobilized quickly to address these cases. The key will be speed, ensuring appropriate people and materials are where they need to be,” said Donald Brooks, chief executive officer of Initiative: Eau, a U.S. aid group focused on water and sanitation, who has worked on establishing public health emergency response systems in West Africa.
“If not and it spreads to urban centers, it could result in disastrous loss of life,” he warned.
Ebola also doesn’t seem to fit the profile of the sort of killer global pandemic that I warned about in my latest book. A few years ago an experimental “Ebola vaccine” was developed, and pharmaceutical companies have also come up with treatments that appear to be at least somewhat successful in temporarily extending the lives of Ebola patients.
But if we ever did see a global Ebola pandemic, the death rate would still be extremely high.
And it should be noted that governments around the globe have been attempting to weaponize Ebola and other similar diseases. The following comes from a Daily Mail report that was published just the other day…
Experts fear Russia could weaponise the deadly Ebola virus as part of a catastrophic biological weapons project.
Unit 68240 of Moscow’s FSB spy agency – linked to the Salisbury Novichok poisonings – is thought to be behind the programme codenamed Toledo.
It is believed the unit is researching both Ebola and the even-more deadly Marburg virus.
If the Russians (or someone else) cooks up a weaponized version of Ebola in a lab and it gets out into the general public, it is doubtful that any existing vaccine or treatment would be effective against it.
As far as this new epidemic in Africa is concerned, we will watch and see what happens.
Outbreaks of disease happen all the time, and very few of those outbreaks ever develop into true global pandemics.
However, experts assure us that it is just a matter of time before a killer pandemic that will be much, much worse than we are experiencing now comes along.
That future pandemic may occur naturally, or it may happen because a really nasty bug gets released from a lab on purpose or accidentally.
However it happens, the truth is that we are extremely vulnerable, and COVID has already shown everyone how much sheer panic a global pandemic can cause.
* * *
Michael’s new book entitled “Lost Prophecies Of The Future Of America” is now available in paperback and for the Kindle on Amazon.
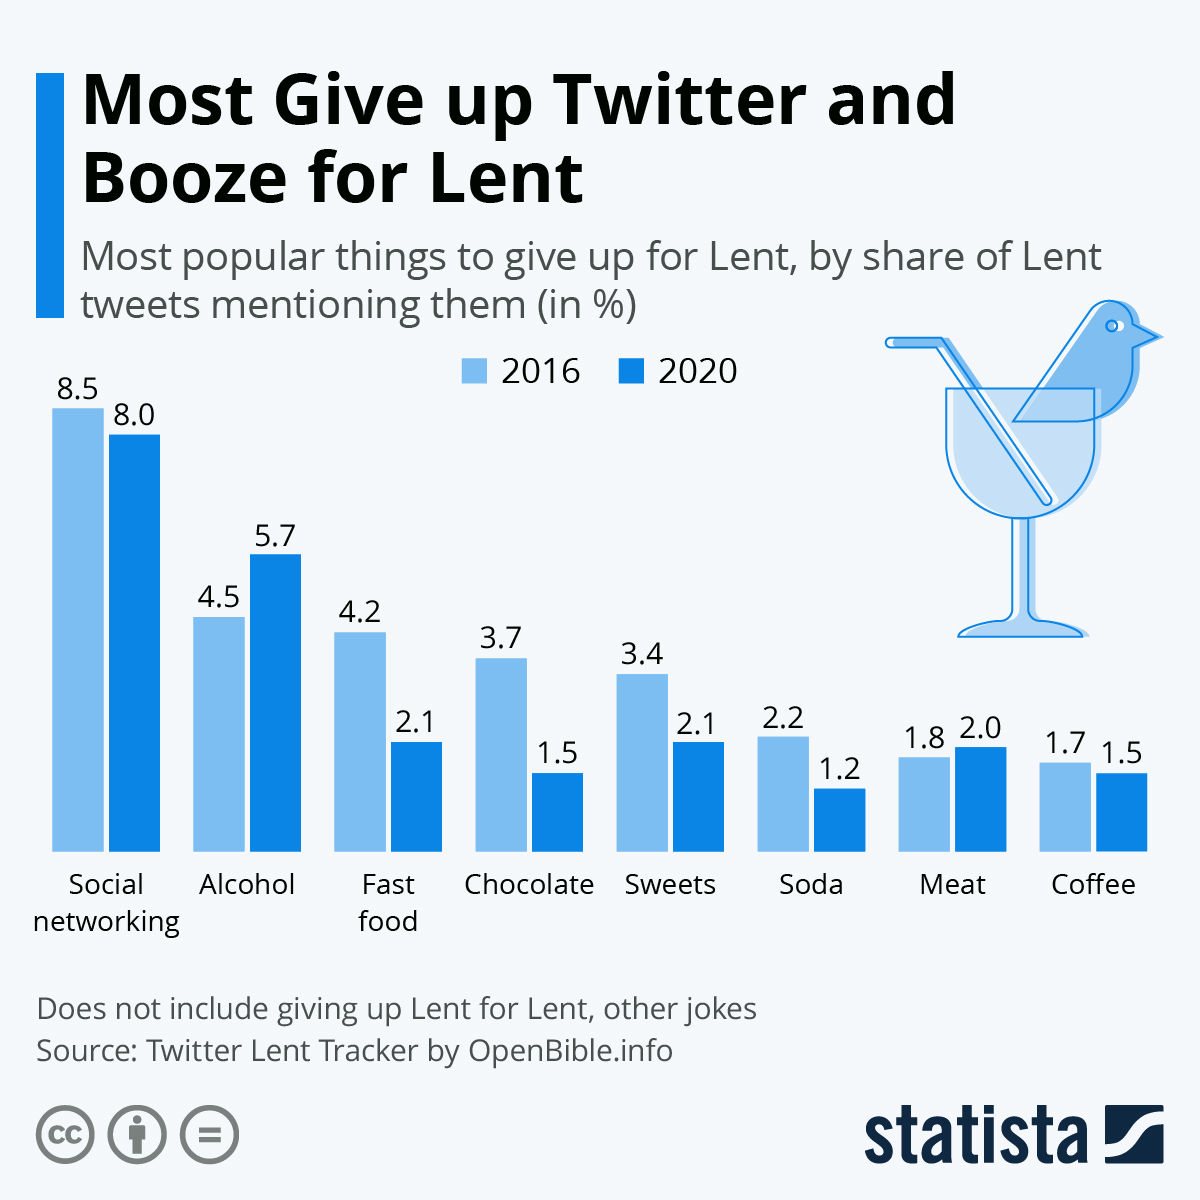
Giving up social media or alcohol for Lent are by far the most common ways to engage in modern fasting before Easter, but, as Statista’s Katharina Buchholz notes, interest in (temporarily) swearing off meat is rising. This is according to tweets on the topic of Lent analyzed by Bible data site OpenBible.info.
The intention to give up social networking has been continuously high throughout the years, while interest in a sober Lent has also increased. The makers of the Twitter Lent Tracker credit this to the recent rise of dry January. The month has become Lent’s rival fasting occasion for people seeking an alternative to New Year’s resolutions. Just as seen in the Lent trends, giving up meat (and other animal products) for a while has proven popular as Veganuary. As far as social media goes, Twitter was identified as the fast-worthiest – far ahead of Facebook or Instagram -, but this could also be due to the fact that the analysis was carried out on Twitter itself.
Swearing off fast food, soda and sweets has seemingly fallen out of fashion in recent years. Equally, interest in fasting on potato chips has more halved from around 2 percent of all Lent tweets mentioning it in 2017 to only 0.8 percent in 2020. Interest in swearing less went a similar route. Laying off sex has hovered at around 1-1.5 percent over the years, similar to foregoing coffee.
Ash Wednesday on today, Feb 17, marks the start of Lent in 2021.Some Christians fast during this time to commemorate Jesus’ 40-day journey into the desert after his baptism. Traditional practices range from going without meat and/or dairy, eating only bread or even nothing at all during the day.
An attempt to register Black Lives Matter (BLM) as a political party in the United Kingdom has been blocked due to concerns that the name might be misleading to voters.
Britain’s Electoral Commission – an independent agency that is responsible for overseeing elections, registering political parties, and regulating their finances – rejected an application to make BLM a political party on the grounds that the proposed name is “likely to mislead a voter as to the effect of their vote.”
“As part of our considerations we examined the existing groups by the same or similar names in the UK. Having contacted a number of groups, they confirmed that the party was not associated with them,” a spokesman for the commission told MailOnline, adding that a “reasonable voter” could assume that the party “represents, or is in some way associated with, these groups when that is not the case.”
The identities of the applicants who submitted the application to the commission remain unknown, according to MailOnline.
Black Lives Matter UK, the main BLM group in the country, confirmed to the news site that it had nothing to do with the failed BLM party bid.
“We has absolutely no connection, affiliations or other and no individual or group has informed or made us aware of their intentions of forming a political party under the name of Black Lives Matter,” a BLM UK statement reads, according to the Mail.
First emerging in the United States during President Barack Obama’s second term, the BLM movement initially appeared in response to excessive use of deadly force in law enforcement actions, which many argue disproportionately affects the black community. The non-profit organization that bears the same name, however, goes much further to advocate for a number of Marxist causes, including the dissolution of nuclear family.
“We disrupt the Western-prescribed nuclear family structure requirement by supporting each other as extended families and ‘villages’ that collectively care for one another, especially our children, to the degree that mothers, parents, and children are comfortable,” the organization’s website read.
The BLM movement, as well as the BLM organization, gained global attention during the summer of 2020, which was marked by widespread protests sparked by the death of George Floyd in the custody of Minneapolis police officers. Many of those protests turned violent, resulting in large-scale rioting, looting, arson, and destruction of private and public properties.
In the United States and the UK, BLM protesters defaced and toppled the statues of prominent historical figures, including American Founding Father George Washington, and British Prime Minister Winston Churchill, who has long been celebrated for his leadership of the British Empire during the WWII.
Iran To Block Nuclear Inspections Starting Next Week If US Doesn’t Drop Sanctions
European signatories to the 2015 Iran nuclear deal are warning Tehran not to block inspections by the International Atomic Energy Agency (IAEA) after Iranian officials issued an ultimatum to Washington threatening to do just that. “It would be completely unacceptable should Iran obstruct IAEA inspections,” a German diplomat was cited as saying in Reuters.
“We urge Iran to refrain from this step, and are in close contact regarding this issue with our partners, including the United States,” the diplomat added. This was in response to Iran announcing on Monday that it’s poised to limit inspections should the United States not lift at least some sanctions by February 21st.
“Foreign ministry spokesman Saeed Khatibzadeh said President Hassan Rouhani’s government is obliged by law to stop voluntarily implementing the Additional Protocol – which gives the UN’s nuclear watchdog more inspection authority – if US sanctions on Iran’s oil and banking sectors are not lifted by February 21,” Al Jazeera reported.
Alongside Iran lately blowing past uranium enrichment caps set by the terms of the JCPOA, barring snap inspections from nuclear facilities would constitute the most serious escalation by the Islamic Republic thus far.
It further comes on the heels of Iran for the first time producing uranium metal which can be a core component of nuclear weapons and is a major step crossing over from uranium enrichment.
Tehran has been ratcheting its defiance for weeks as part of efforts to leverage the Biden White House into acting swiftly to lift sanctions, which has squeezed the population and choked the national economy, sending the currency spiraling over the past year.
The February 21st deadline to lift sanctions was part of December legislation past by Iran’s largely hardline parliament. Interestingly President Hassan Rouhani opposed taking the dramatic step, however, he’s required under Iranian law to implement it.
Biden administration officials keep talking about Iran’s compliance with JCPOA
In what capacity?
U.S. ceased participation in May 2018, violated JCPOA & punished those complying with UN resolution.
The law was presented as ‘revenge’ and the necessary repercussions aimed at Washington for the January 2020 assassination by US drone strike of IRGC Quds Force General Qassem Soleimani.
Despite Biden’s prior campaign promises to quickly restore US participation in the nuclear deal, the US is now telling Iran it must come back into compliance first, while Tehran has firmly maintained it was Washington that backed out first.
For the third time in a row, the Catalan pro-independence movement wins with an absolute majority in the Catalan elections. It has won resoundingly with 74 seats, more than the 68 that establishes the majority (in the previous elections it had won with 70). This time also with 51.22% of the votes, making it the majority among the voters.
The elections were due next year, but they were brought forward because the Spanish courts overthrew Catalan President Joaquim Torra for having disobeyed an electoral board that ordered him to take down a banner criticising the imprisonment of Catalan politicians. The President refused, citing freedom of expression, and the Spanish judiciary considered that the contempt was sufficient to force the removal of the President of the Parliament of Catalonia and cause the elections to be brought forward.
Furthermore, after consulting experts on the pandemic, the provisional Catalan executive decided to postpone the elections for five months until the third wave of Covid-19 had subsided. However, yet again, the Spanish judiciary interfered forcing the elections to be held on 14th February.
This is the same Spanish Justice that keeps 9 Catalan politicians and activists in prison, that has issued search and arrest warrants against 7 exiled Catalan politicians (which the German and Belgian courts rejected because they did not see the accusations as justified or because they understood that there were no guarantees of a fair trial in Spain), it is the same Spanish Justice that maintains the search and arrest warrant against a Majorcan musician –exiled in Belgium– for singing against the King of Spain and that is imminently going to imprison another Catalan musician, Pablo Hasel, for also having sung against the King.
In this context, and despite having the entire state apparatus and the Spanish press against them, independence has won again, and has done so obtaining a larger absolute majority than ever and with over 51% of the votes. In front of the pro-independence movement, we have the former Spanish socialist health minister during the pandemic, who has had the full support of the state, the press and unionism in general, and also the Spanish extreme-right of VOX, which has burst onto the Catalan Parliament with 11 seats.
Given this scenario, the Spanish state and the European Union cannot deny the right of self-determination of Catalan society, which must be expressed in a referendum with democratic guarantees, transparency and without foul play.
All in all, democracy is about allowing citizens to decide at the ballot box, not about violating their will with the application of laws that should in fact serve to guarantee there is a framework that respects what societies want for themselves.
Cashless Society? UK ATM-Use Plummets During Pandemic
According to the UK’s largest ATM network, “LINK is committed to protecting free access to cash for as long as consumers want it”.
The question is, how long will the desire for good old fashioned bank notes last?
As this infographic shows, the use of LINK cash machines was down year-on-year in every month of 2019, as noted by the company in their 2020 report:
“The impact of many consumers reducing their cash usage continues to be seen across the LINK network.The number of transactions fell by 12.9% between December 2018 and December 2019.”
Estimates for the life expectancy of the country’s ATMs will have to be put on hold for now though, as Statista’s Martin Armstrong notes that with the Covid-19 pandemic drastically changing the way we interact with businesses – at least temporarily, and in some ways potentially forever. The lockdown-related closures of premises with an ATM will naturally be remedied once the measures are once and for all retracted, as will the lack of need for cash due to businesses such as bars and restaurants being closed.
The inevitable death of some brick and mortar businesses and the migration of commerce online will be an effect which be be felt for much longer, however. Likewise, the importance of making transactions contactless during the pandemic has led to the increased presence of card readers in establishments which previously only accepted cash – another trend which is unlikely to be reversed once the crisis is over.