The admin panel used by hackers to access over one hundred accounts can be used by over 1,000 twitter employees — two former Twitter employees revealed.
More than 1,000 Twitter employees and contractors had access to the internal admin panel that enabled last week’s Twitter hack of 130 high profile accounts.
According to Reuters on July 24, two former employees have shed light on just how vulnerable Twitter’s security was — and may still be. They said that, in addition to employees, contractors like Cognizant could also have access.
Former chief security officer at AT&T Edward Amoroso, told Reuters that such powerful controls should not be available to so many people.
“That sounds like there are too many people with access,” he said, adding that staff should have limited rights with responsibilities split up as well as multiple checks and balances in place for adjusting sensitive information.
“In order to do cyber security right, you can’t forget the boring stuff.”
What happened?
On July 15 attackers accessed Twitter’s admin panel allowing them to take control of any Twitter account, post tweets from them and access personal information including private messages.
They posted scam Bitcoin (BTC) ‘giveaways’, by promising to send back double any sum received. All told, the scammers got away with around 12 BTC.
High profile accounts taken over include Tesla founder Elon Musk, former United States President Barack Obama, Amazon owner Jeff Bezos, Microsoft co-founder Bill Gates and 2020 U.S. presidential candidate and former Vice-President Joe Biden. Other celebrities, politicians and top business personalities also lost control of their accounts.
Twitter and the FBI are working together to investigate the breach, with regular updates from Twitter on their findings. On Jul 23, the company revealed that in “up to 36 of the 130 targeted accounts, the attackers accessed the DM inbox, including 1 elected official in the Netherlands.”
To recap:
🔹130 total accounts targeted by attackers
🔹45 accounts had Tweets sent by attackers
🔹36 accounts had the DM inbox accessed
🔹8 accounts had an archive of “Your Twitter Data” downloaded, none of these are Verified
Twitter has also revealed they are looking for a new security head in order to improve security and employee training.
Security experts are concerned that the required upgrades to Twitter’s security and processes may not be complete before the U.S. elections on Nov. 3 with other countries potentially having the ability to manipulate the outcome through social media account take-overs.
Network security company Tenable founder Ron Gula asked:
“Does Twitter do enough to prevent account takeovers for our presidential candidates and news outlets when faced with sophisticated threats that leverage whole-of-nation approaches?”
via ZeroHedge News https://ift.tt/3eZ0tNw Tyler Durden
Some Optimism From Goldman: The Number Of New COVID Cases Is Starting To Flatten Tyler Durden
Fri, 07/24/2020 – 12:05
As the US reports more than 1k deaths for the third straight day, reporters are mostly focusing on this milestone, along with the US surmounting the 4 million-case mark, as the biggest COVID-19-related stories of the day. But a team of market-focused analysts at Goldman Sachs pointed out that the daily case totals in some of the worst hit Sun Belt states appear to have finally plateaued.
Earlier, Texas Gov Greg Abbott sat for an interview with Joe Kernen and Andrew Ross Sorkin during the first hour of CNBC’s “Squawk Box” where he argued that social distancing measures and the closure of bars etc undertaken in his state are working, before pleading with viewers to please wear a mask in public.
“Let me be very clear we do not want to shutdown again. The only way we can go about the process of not shutting down is for people to embrace this process of wearing a face mask,” says @GregAbbott_TX on #COVID19. pic.twitter.com/6NDkONcNWK
Though the tone of most of the media coverage might suggest otherwise, Abbott insisted that Texas has definitively passed its infection peak, and that Texans must continue to assiduously follow the government’s advice if they want to see the outbreak dissipate.
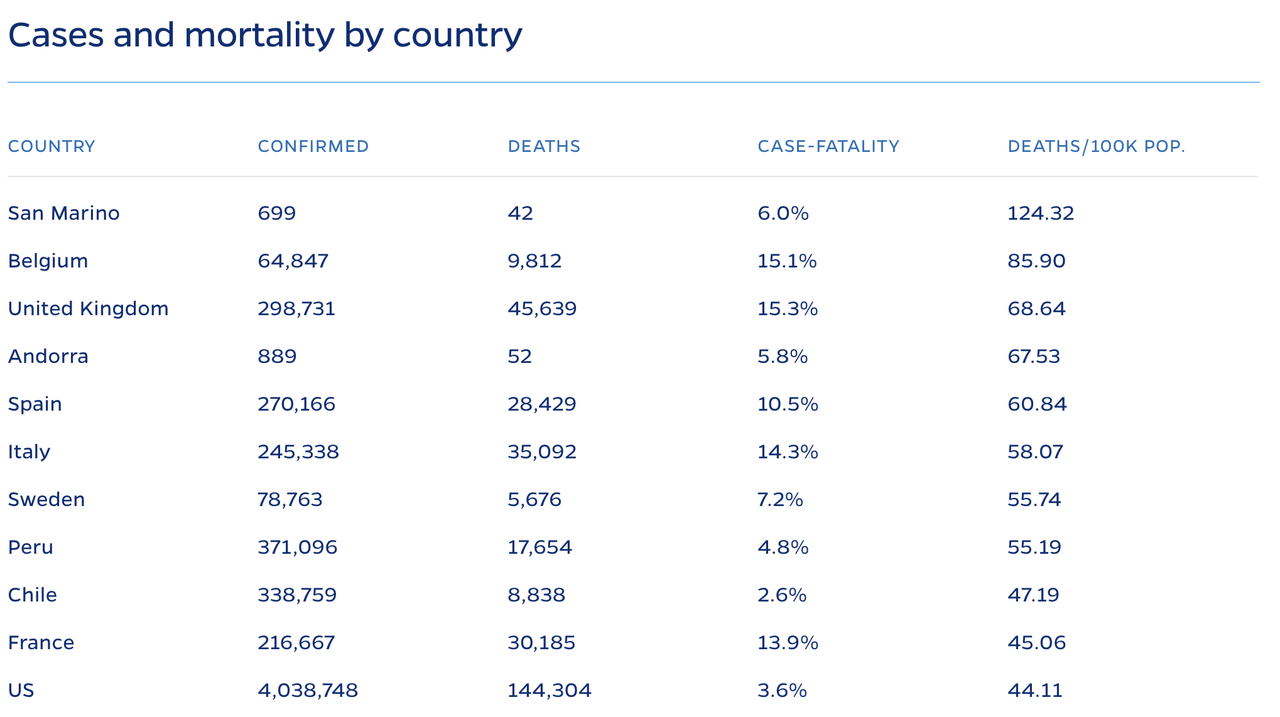
As it turns out, Abbott has gotten some unexpected help from a team of analysts at Goldman Sachs, who argued in their latest COVID-19 daily US update that there are reasons for optimism, even as Paul Krugman opines that Italy’s handling of its coronavirus response has outshone the US, despite the fact that Italy’s case-fatality rate and deaths per 100k people rate were both higher than in the US, according to Johns Hopkins Data.
Anyway, as the team from Goldman writes, it looks like some of the worst-hit states are finally seeing their case numbers plateau, eve as the national new-case numbers continue to trend higher (looking at the 7-day average).
And while the GS team noted that governors are probably still “reluctant to push forward” with reopening measures, the time to reimpose sweeping lockdowns appears to have come and gone.
* * *
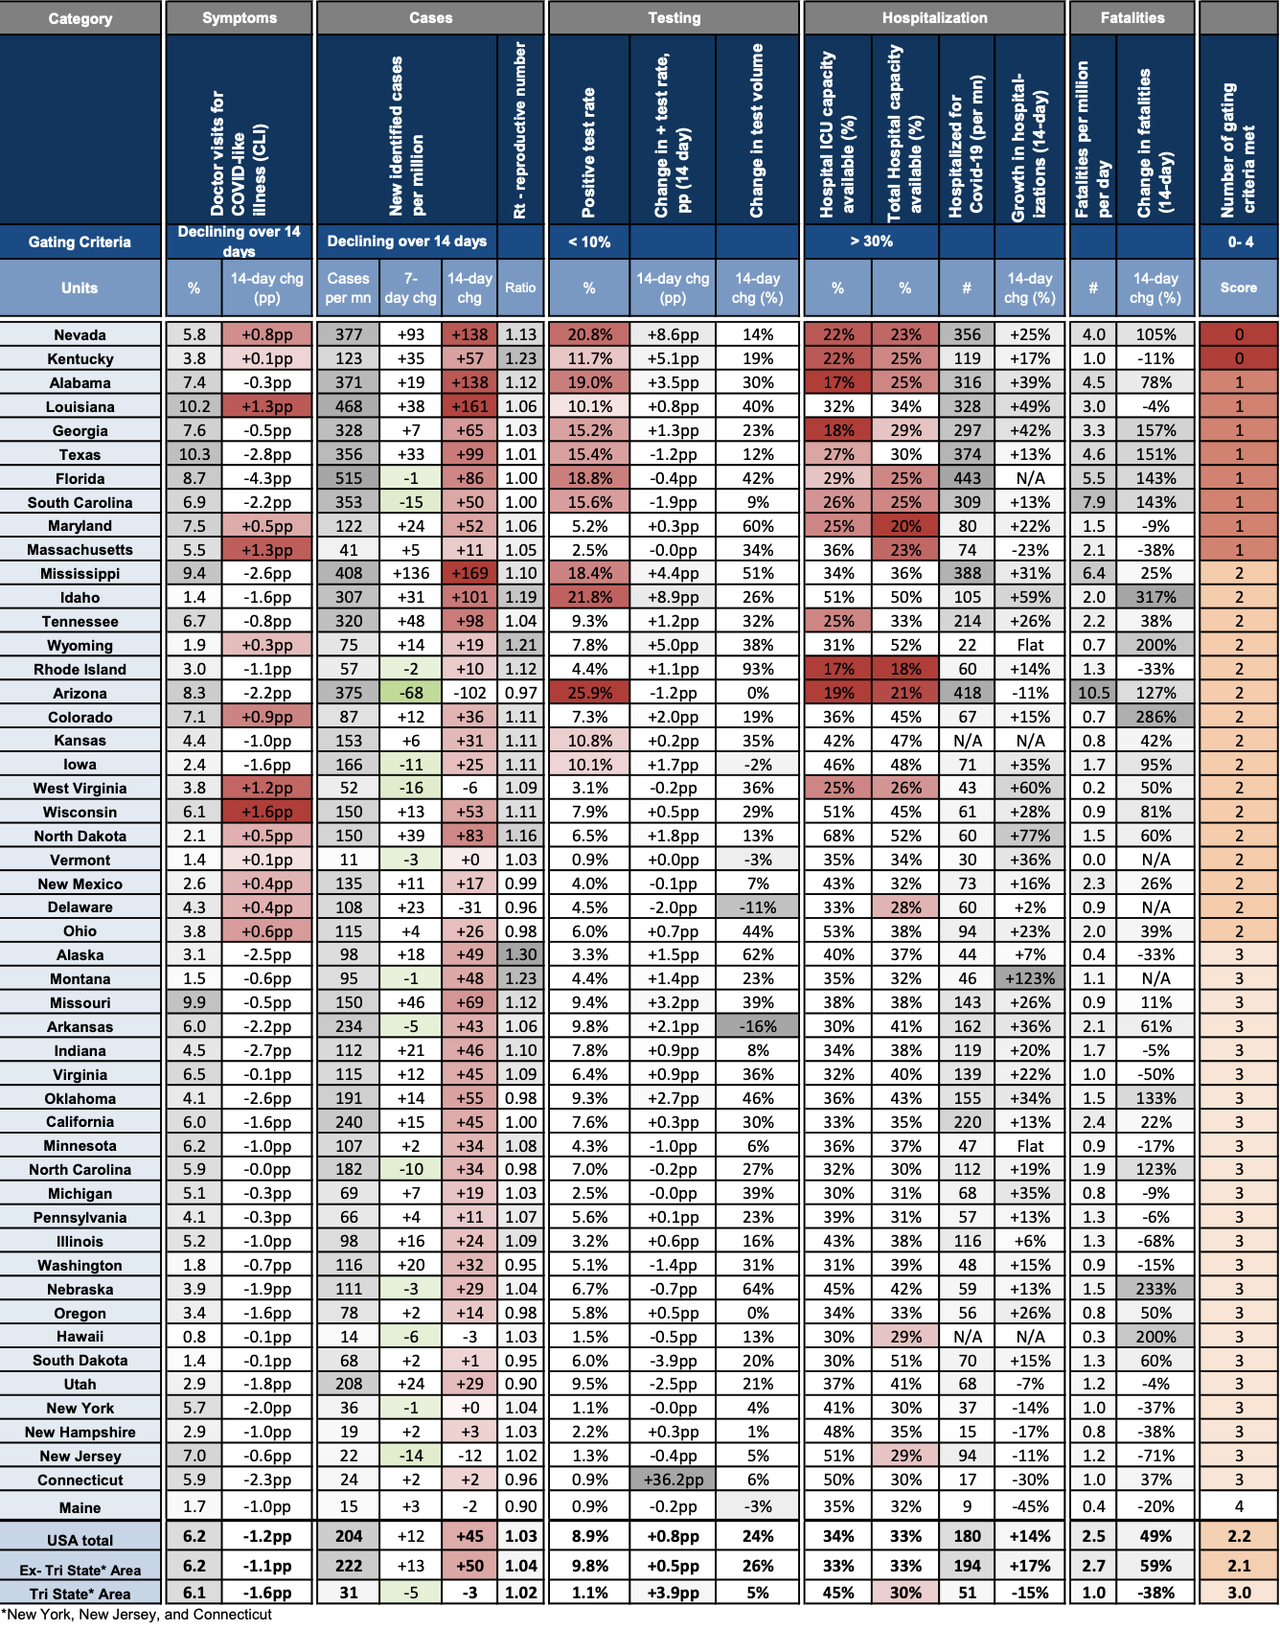
The number of new cases per day is very high but apparently flattening in a few states that experienced significant virus resurgence over the past week, including Arizona, Florida, and South Carolina. Meanwhile, the number of new cases per day is elevated and surging higher in a handful of other states including Nevada, Alabama, Louisiana, Mississippi, Idaho, and Tennessee. Nationally, new cases continue to rise further on average and remain on upward trajectories in a majority of states.
Hospitalizations and fatalities also continue to rise further nationally and sharply in some states. In Louisiana, some hospitals have halted non-emergency surgeries in order to increase available capacity to accommodate greater numbers of COVID-19 patients.
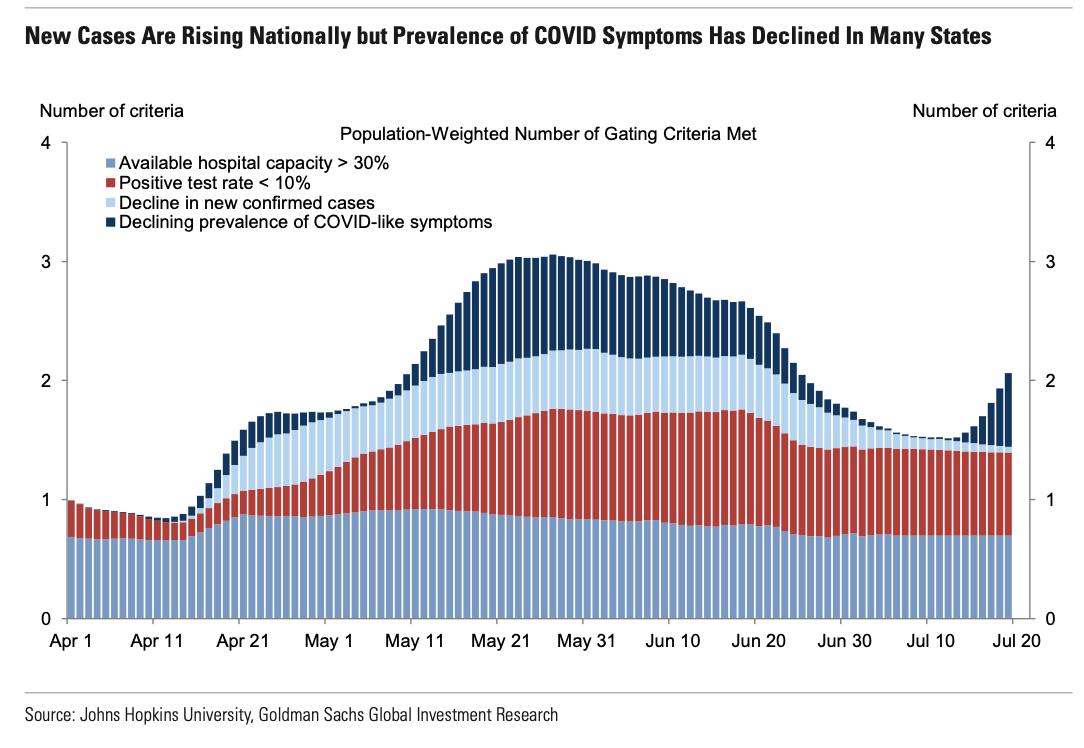
The average number of the four gating criteria the federal government recommends to proceed with reopening that states are meeting has risen over the past few days as prevalence of COVID-like illness symptoms has declined in several states, potentially suggesting downward pressure on case growth. But with the level of new cases already very high in several states and on average nationally, state government officials may remain reluctant to push forward with reopening.
The number of new cases per day is very high but apparently flattening in a few states that experienced significant virus resurgence over the past week, including Arizona, Florida, and South Carolina. Meanwhile, the number of new cases per day is elevated and surging higher in a handful of other states including Nevada, Alabama, Louisiana, Mississippi, Idaho, and Tennessee. Nationally, new cases continue to rise further on average and remain on upward trajectories in a majority of states.
Hospitalizations and fatalities also continue to rise further nationally and sharply in some states. In Louisiana, some hospitals have halted non-emergency surgeries in order to increase available capacity to accommodate greater numbers of COVID-19 patients.
The average number of the four gating criteria the federal government recommends to proceed with reopening that states are meeting has risen over the past few days as prevalence of COVID-like illness symptoms has declined in several states, potentially suggesting downward pressure on case growth. But with the level of new cases already very high in several states and on average nationally, state government officials may remain reluctant to push forward with reopening.
* * *
Source: Goldman Sachs
via ZeroHedge News https://ift.tt/3hxhcsN Tyler Durden
How great a burden can even an unrivaled superpower carry before it buckles and breaks? We may be about to find out…
Rome was the superpower of its time, ruling for centuries almost the entirety of what was then called the civilized world.
Great Britain was a superpower of its day, but she bled, bankrupted and broke herself in the Thirty Years War of the West from 1914-1945.
By Winston Churchill’s death in 1965, the empire had vanished, and Britain was being invaded by a stream of migrants from its former colonies.
America was the real superpower of the 20th century and became sole claimant to that title with the collapse of the Soviet Union between 1989 and 1991, an event Vladimir Putin called “the greatest geopolitical tragedy of the 20th century.”
Has America’s turn come? Is America breaking under the burdens it has lately assumed and is attempting to carry?
Today, at the presidential library of Richard Nixon, who ushered Mao’s China onto the world stage, Secretary of State Mike Pompeo is laying out a strategy of containment and confrontation of a China that is far more the equal of the USA than was the USSR.
Writes Hudson’s Institute’s Arthur Herman:
“In the 1960s, manufacturing made up 25% of U.S. gross domestic product. It’s barely 11% today. More than five million American manufacturing jobs have been lost since 2000.”
China controls the production of 97% of the antibiotics upon which the lives of millions of Americans depend. She provides critical components in the production chains of U.S. weapons systems.
Beijing commands more warships than the U.S. Navy and holds a trillion dollars in U.S. debt. Moscow never had this kind of hold on us.
Writes Herman:
“Since 2000, America’s defense industry has shed more than 20,000 U.S.-based manufacturing companies. As the work those companies once did domestically has shifted overseas, much of it has gone to China. From rare-earth metals and permanent magnets to high-end electronic components and printed circuit boards, the Pentagon has slowly become dependent on Chinese industrial output. Asia produces 90% of the world’s circuit boards — more than half of them in China. The U.S. share of global circuit-board production has fallen to 5%.”
Decoupling from China and re-industrializing America would be an immense undertaking. But unless and until we do it, we remain vulnerable.
Another decades-long struggle, this time with China, like the Cold War that consumed so much of our attention and wealth from the 1940s to 1991, is not the only challenge America faces.
Through NATO, the U.S. is still the principal protector of almost 30 European nations. And despite Donald Trump’s promise to end our forever wars, 8,500 U.S. troops remain in Afghanistan, 5,000 in Iraq, hundreds in Syria, thousands more in Kuwait and Bahrain.
There are other huge new claims on America’s time, attention and resources.
Some 145,000 Americans have perished in five months of the coronavirus pandemic, more U.S. dead than all the Americans soldiers lost in Korea, Vietnam, Iraq and Afghanistan.
A thousand Americans are dying every day, a higher daily death toll than in World War II and the Civil War combined.
The U.S. economy has been thrust into something approaching a second Depression. The 2020 deficit runs into the trillions of dollars. Our national debt is now far larger than our GDP and soaring. Tens of millions are unemployed. And the shutdowns are beginning anew.
From the protests, riots, rampages and statue-smashing of the last two months, it is apparent that millions of Americans detest our history and heroes. Though nowhere in recorded time have 42 million people of African descent achieved the measures of freedom and prosperity they have in the USA, we are daily admonished that ours is a rotten and sick society whose every institution is shot through with “systemic racism.”
The racial divisions are almost as ugly as during the riots of the 1960s in Harlem, Watts, Newark and 100 cities that exploded after the assassination of Dr. Martin Luther King.
In the numbers of citizens now shot and killed every week, great American cities such as Baltimore, St. Louis, Detroit and Chicago are looking more like Baghdad.
The Democratic Party is promising to take up the issue of racial reparations for our original sin of slavery. The first order of business, we are told, is ending inequality — of income, wealth, educational attainment and health care. The racial disparity in police arrests, prosecutions, incarcerations and school expulsions, must end.
But if the trillions we have spent to address these inequalities since the Great Society days have failed to make greater progress, why should we believe that we even know how to succeed, absent the imposition of a rigid socialist egalitarianism of results?
The Old Republic is facing a stress test unlike any it has known since the Union was threatened with dissolution in the Civil War.
via ZeroHedge News https://ift.tt/39ok9t3 Tyler Durden
Goldman Spots A Historic Inversion In The Market Tyler Durden
Fri, 07/24/2020 – 11:25
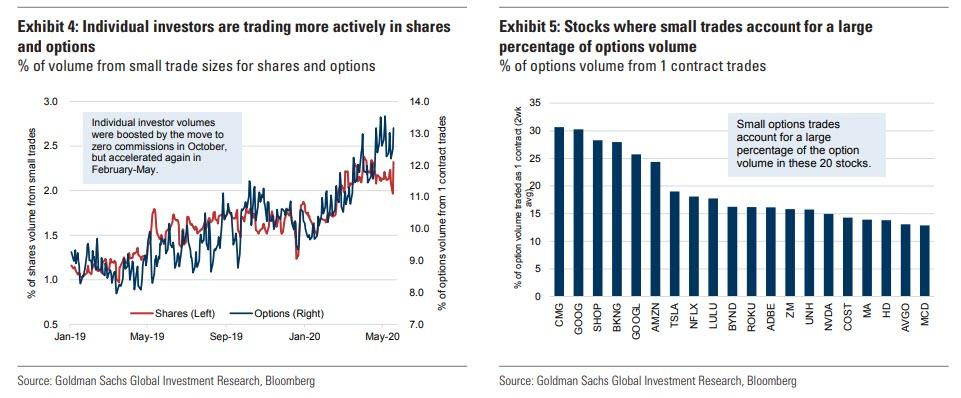
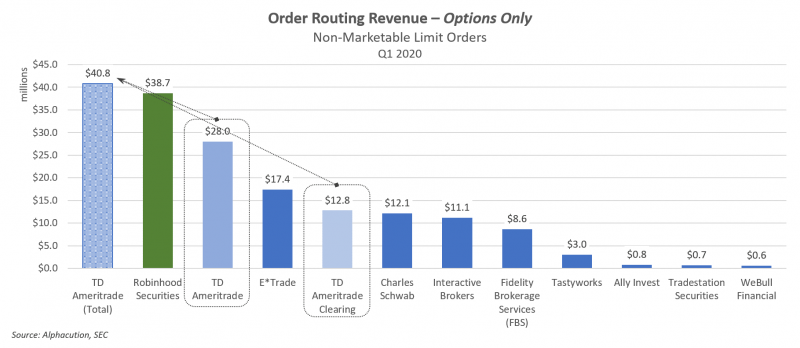
Back in May when we explained “how retail investors took over the stock market“ (which Bloomberg again confirmed overnight when it reported that hedge funds are now chasing robinhood investors, and buying whatever Millennial and GenZ daytraders are buying) we said that the recent surge in options trading – which has far more impact on market flows due to embedded leverage – has had a key role in this transformation, and cited Goldman data which showed that “individual investor active trading is playing an increased role in market volatility, particularly in select stocks. In the shares market, 2.3% of all volume is made up of trades for $2,000 or less. The increase in small trades has been even more notable in the options market, where 13% of all trades are for 1 contract.”
Since then, options trading by retail investors has exploded and according to a follow up from Goldman, which has spotted an unprecedented market inversion, for the first time ever, the volume of option trades surpassed that of ordinary shares! Translation: the derivative is now more liquid and popular than the actual underlying.
According to Goldman’s John Marshall and Vishal Vivek, who first spotted the dramatic surge in retail option trading, single stock options volumes rose to record highs in July, with notional volumes up 129% YTD and 35% over the past month alone as retail investors flooded markets to blow their government stimulus checks on “sure things” with leverage.
And in the most dramatic observations yet, the average daily value of options traded has exceeded shares for the first time, with July single stock options volumes currently tracking 114% of shares volumes.
While equity trading activity increased to all-time highs in March of this year when the flood of retail investors first hit Robinhood, Schwab and Etrade, and has declined since then, options trading activity has increased 129% YTD (up 35% from June levels), which helps expain why various HFT outfits are paying so much to frontrun Robinhood option trades.
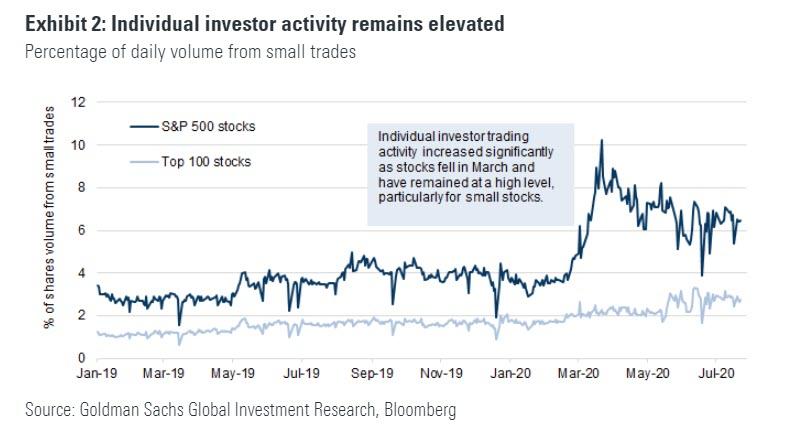
It will certainly not come as a surprise that according to Goldman’s recent analysis, increased activity by individual investors was the single biggest contributor to growth in volumes this year. Options trading activity by individual investors comprised 10% of volumes in large liquid names at the beginning of 2020, and is currently up to 15%. This compares to a 60% increase in total single stock options contract volumes YTD.
Some more observations: Goldman estimates that individual investor activity has doubled in the past year for S&P 500 stocks. For options on S&P 500 stocks, individual investor activity is up 40% over the past year.
(1) Shares: While individual investor activity in mega-caps has accounted for a smaller percentage of volume than for the bottom 400 names in the S&P 500 on an absolute basis, mega-cap individual investor participation has increased over the past three months.
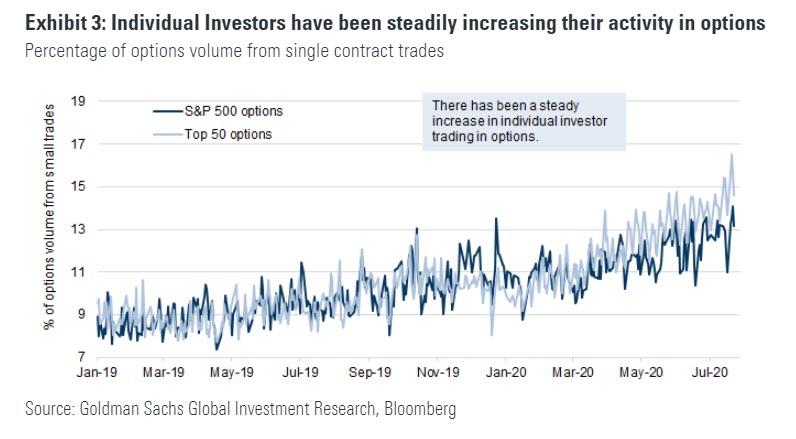
(2) Options: Individual investor activity in both the top 50 and the top 500 US names has continued a steady climb over the past few months, with a larger recent increase in the proportion of volume among the top 50.
It gets crazier: a significant portion of this increase has been driven by higher volumes in short dated contracts, as investors are literally using massive leverage to wager on near-term momentum moves such as those often highlighted OTM calls traded in Tesla stock.
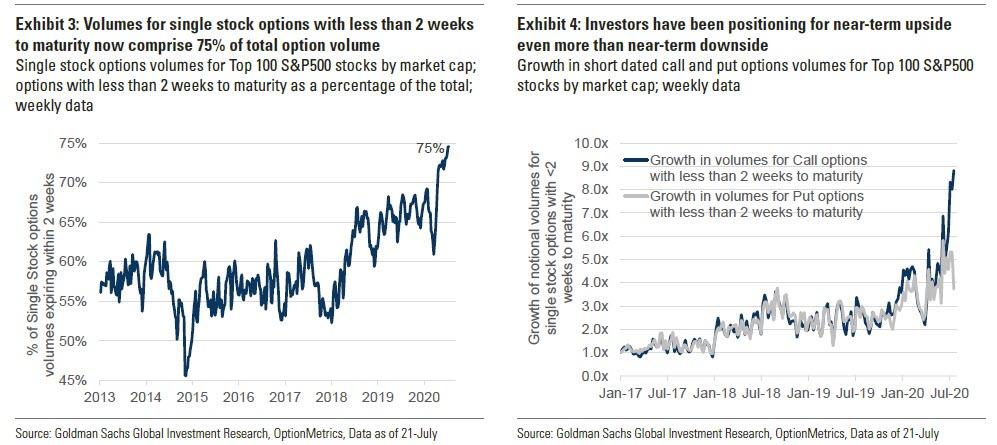
As Goldman explains, “the proliferation of weekly options, and increased focus on using options to trade catalysts, has likely boosted growth in shorter dated (options with less than 2 weeks to expiry) trading strategies. While weekly maturities on single stocks became popular in 2012, volumes in short dated options typically comprised 50-60% of total volumes until 2017. This changed in 2018, as the volatility spike early in the year likely led to investors increasingly trading short dated options, driven by low absolute premiums and better visibility of the catalyst path. In 2020, volumes in short dated options have increased to record highs.”
As a result, single stock options with maturities less than 2 weeks now comprise 75% of all maturities, up from 65% a year ago. Meanwhile, in recent weeks, investors have further increased focus on trading calls with volumes of short dated call options having increased rapidly relative to puts.
In the context of these findings, Goldman next looked at yesterday’s sharp selloff and found several additional bizarre patterns:
Stocks where individual investors were most active in OPTIONS over the past two weeks were down 1.3% yesterday, consistent with the 1.5% decline in the average stock in the NDX.
Stocks where individual investors were most active in SHARES over the past two weeks were up 0.7% yesterday, while the average stock in the SPX was down 0.2%.
According to Goldman, this shows that individual investors have tended to be most active in the SHARES of stocks that have recently underperformed (i.e. buying the dip); this sets up for outperformance when the market broadly exhibits a trend reversal.
At the same time, individuals tend to be most active in the OPTIONS of stocks that have recently seen strong performance (i.e. momentum); therefore, yesterday’s decline in these names is also consistent with a reversal of recent momentum. The report also found that popular options names are highly correlated with the NDX over time, making put buying on the NDX an attractive way for investors to hedge against a continuation of yesterday’s move.
Finally, for those asking where the retail option trade footprint is largest, here is a look at which stocks have fueled the sharp rise in options volumes:
Options volumes have been driven higher by an increase in trading in many of the large market cap names. AMZN, TSLA, AAPL, NFLX and FB had the highest volumes in July. Among the top 25 underliers with high notional volumes, MRNA, WMT, NKLA and TSLA saw the biggest jump relative to the prior 12-months.
Notably, bullish sentiment on a number of names, as indicated by options market skew, is at extremely high levels. Three-month normalized put-call skew in AMZN, TSLA, SQ and MRNA have declined to below 0. Negative skew is a relatively rare statistic for large cap names such as AMZN (where three month skew is currently at all-time lows), implying crowding in long AMZN calls.
One final warning: if and when a trend reversal in the names listed above, watch out below as months of aggressive retail chasing of momentum will hit a brick wall and then go into reverse.
via ZeroHedge News https://ift.tt/2Egq0VM Tyler Durden
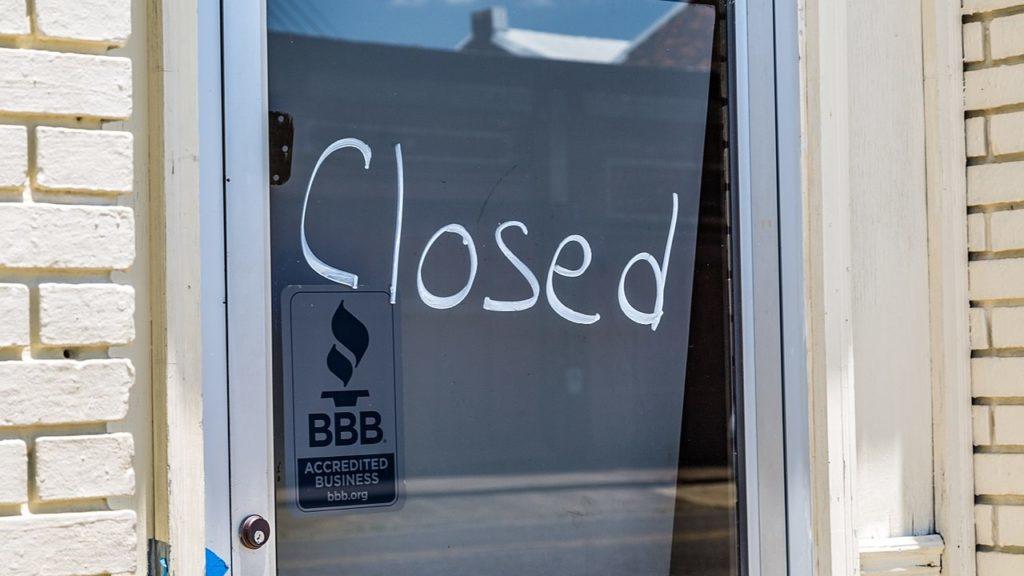
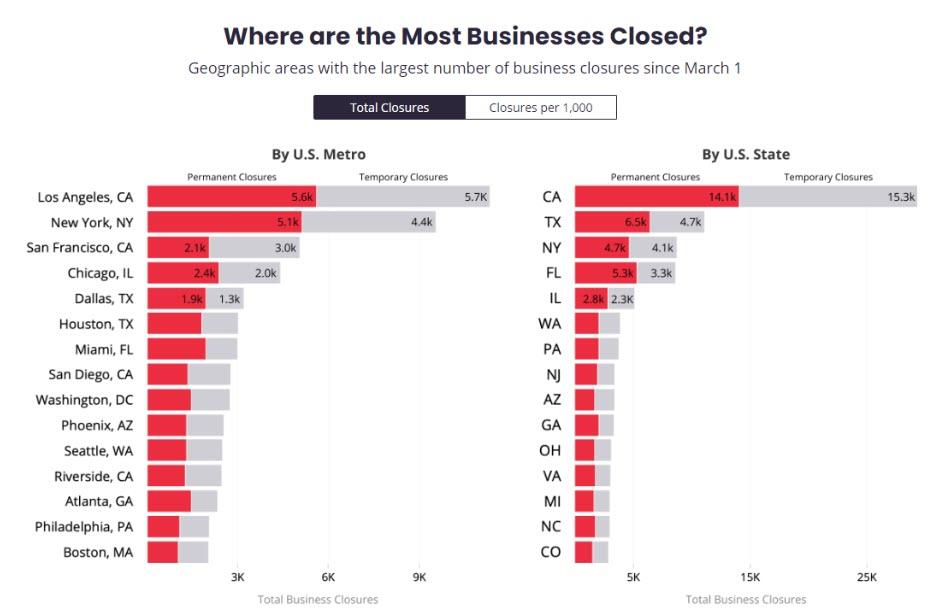
Permanent business closures are rising as the economic impacts of the coronavirus-induced government shutdowns continue to ripple through the economy.
This is yet another sign that the promised “v-shaped” economic recovery will likely never materialize.
Business closures on Yelp peaked about 177,000 on April 19 and fell to 132,500 as of July 10 as states allowed their economies to open up. But even as the total number of closed businesses declined, the number of permanent shutdowns spiked. According to Yelp, of those 132,500 closed businesses, 72,842 were shut down permanently. That means as of July 10, permanent closures accounted for 55% of all closed businesses since March 1.
The data only reflects businesses listed on Yelp’s website, but it provides a snapshot of the broader US economy.
The restaurant industry is suffering the most closures. More than 15,000 restaurants have permanently closed. Bars and nightclubs have also accounted for a significant number of closures, with 44% of the shutdowns being permanent. Shopping and retail businesses have endured 26,119 total business closures, with 12,454 permanent shutdowns.
The number of permanent business closures will almost certainly increase as stimulus money runs out. And as we reported back in April, cashflow issues will likely sink more businesses.
The forced shutdown put tremendous stress on businesses – particularly small businesses that operate on thin margins. Many of them were forced to take on more debt due to the pandemic and the ensuing lockdown. As a small-business owner in Kentucky put it, we’re going to see a massive dead spot and lurch in the cashflow pipeline.
Except for cash transactions, there will likely be a 60 to 120-day dead spot in business revenue flow. And that’s on top of the shutdown induced revenue stoppage.”
We live in a credit-based economy. Most transactions are on at least 30-day payment terms. Depending on the number of transactions in a product’s supply chain, it could take months to refill the cash flow pipeline. Meanwhile, the business owner still has to make payroll and pay all of her reoccurring monthly bills such as rent and utilities.
Many businesses simply won’t make it.
In fact, many small business owners don’t think they’ll make it. As we reported at the end of May, a survey conducted by financial services company Azlo found that nearly half of small business owners think they will eventually have to close their businesses for good. Forty-seven percent of the small business owners surveyed said they anticipate shutting down, and 41% said they are looking for full-time work elsewhere.
Chinese Researcher ‘Hiding Out’ At San Francisco Consulate Arrested, DOJ Says Tyler Durden
Fri, 07/24/2020 – 10:44
Update (1120ET): During a regular press briefing, Chinese Foreign Ministry Spokesman Wang Wenbin accused Washington of “political persecution” on Thursday after being asked about the arrest by a reporter.
But Wang stopped short of saying whether Tang was being deliberately sheltered by diplomats.
“We urge the US to stop using any excuse to limit, harass and crackdown on Chinese scholars and Chinese students in the US,” he said.
In addition to Tang, 3 other Chinese nationals have also reportedly been charged.
* * *
As the US and China engage in unprecedented tit-for-tat closures of diplomatic missions, destabilizing financial markets and sending a chill through the international community, a DOJ official has confirmed that a Chinese researcher who was reportedly “hiding out” at the Chinese consulate in San Francisco has been taken into custody.
The Chinese researcher, Juan Tang, had been affiliated with the University of California at Davis, and was to be charged with lying about her military service, when she sought shelter at the Chinese consulate in San Francisco.
FBI agents interviewed her last month, and prosecutors had filed a criminal complaint with a federal court seeking a warrant to arrest Tang for visa fraud. Tang was charged along with three other Chinese researchers suspected of lying about their affiliation with the PLA on visa applications. Officials who briefed reporters on Friday declined to discuss the circumstances of the arrest in detail.
It’s still not exactly clear how the researcher/student was apprehended, but the headlines are rolling in:
CHINESE RESEARCHER AT SAN FRANCISCO CONSULATE IN CUSTODY: U.S.
SENIOR U.S. JUSTICE DEPARTMENT OFFICIAL SAYS CHINA’S HOUSTON CONSULATE ACTIVITY WENT WELL OVER THE LINE OF WHAT WE CAN ACCEPT
SENIOR U.S. JUSTICE DEPARTMENT OFFICIAL SAYS ACTIVITY AT HOUSTON CONSULATE, WHILE ILLEGAL, NOT NECESSARILY AMENABLE TO CRIMINAL CHARGES, GIVEN DIPLOMATIC IMMUNITY
SENIOR U.S JUSTICE DEPARTMENT OFFICIAL SAYS CHINESE STUDENT WHO TOOK REFUGE IN CHINA’S SAN FRANCISCO CONSULATE IS IN U.S. CUSTODY AND IS EXPECTED TO MAKE FIRST COURT APPEARANCE ON FRIDAY
SENIOR US JUSTICE DEPT. OFFICIAL: MALIGN ACTIVITIES BY CHINESE CONSULATES ARE NOT SPECIFIC TO HOUSTON, BUT IT WAS ONE OF THE WORST OFFENDERS
The news sent the market lower during a session that has already been plagued by fears about the deteriorating bilateral relationship between the world’s two largest economies.
via ZeroHedge News https://ift.tt/2WUVbMR Tyler Durden
Eviction Moratorium Expires Today, Putting Millions Of Renters At Risk Tyler Durden
Fri, 07/24/2020 – 10:35
The Federal Housing Administration (FHA) was able to stop evictions of renters during the coronavirus pandemic. The Coronavirus Aid, Relief, and Economic Security Act (CARES) also made it unlawful for landlords to evict tenants in federally subsidized or federally backed housing. However, those protections are set to expire today (Friday, July 24).
Washington D.C.-based think tank Urban Institute estimates the eviction moratorium, expiring today, could put more than 12.3 million renters at risk of losing their home.
This protection can help stabilize renters during an economically precarious time, but it doesn’t cover everyone. We estimate that eviction moratoria covering federally financed properties will apply to roughly 12.3 million (28 percent) of the 43.8 million US rental units. – Urban Institute wrote
What this means is that landlords will begin filing eviction paperwork for tenants who haven’t paid rent for 30 days, and or, as we’ve noted, some folks haven’t paid rent in months. While it’s customary renters get 30 days’ notice, an eviction wave is ahead.
The end of eviction protection comes as households are being hit with a fiscal cliff. The $600 in weekly federal unemployment assistance for tens of millions of folks is set to expire next week. We’ve called it an “income cliff,” as it would mean consumption would crater, and the recovery would quickly reverse.
The Trump administration is attempting to pass another round of the stimulus. So far, there are no proposals to extend the moratorium.
Sharon Parrott, senior vice president for federal policy and program development at the Center on Budget and Policy Priorities, said earlier this week that at least 20% of renters are behind in payments.
Advocacy group COVID-19 Eviction warns the actual number could be between 19 million and 23 million families face evictions this fall.
The Washington Post noted the House had passed legislation to create a rental assistance fund, which would support low-income renters for two years. The Senate has yet to review the bill.
As everyone focuses on eroding US-China relations, the start of baseball and the fiscal shenanigans in Washington, a crisis begins today. It’s called the eviction crisis as the 4-mth moratorium ends and the nation’s landlords unite! Over 12m renters/mortgage borrowers at risk.
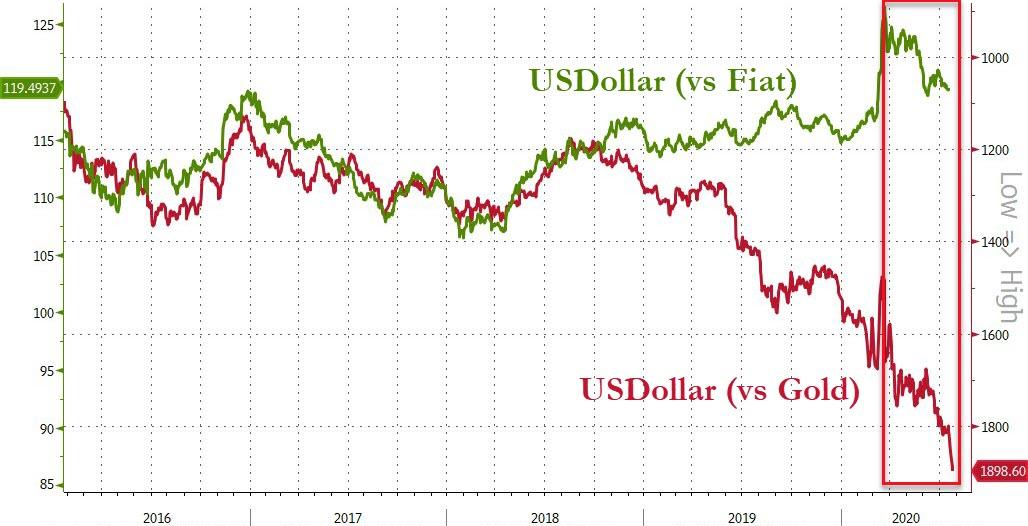
“The reason that governments don’t like gold is probably for the same reason that kids don’t like chaperones at the senior prom. Because the chaperones are there to keep the kids in line and prevent them from doing things they really shouldn’t be doing. And that’s really what gold does. It’s kind of like a chaperone for government politicians because it keeps them honest. Because if you have real money, and government wants to spend money on programs, it needs to collect that money in taxes. And that generally puts a brake on a lot of programs because the public doesn’t want to pay.
…
Gold stands in the way, because you can print paper out of thin air. But gold can’t be printed into existence; it needs to be mined. And if we’re on a gold standard, and gold is money, then the government needs real money. And since it doesn’t have the ability to make it, it has to collect it in taxes before it can spend it back into circulation.”
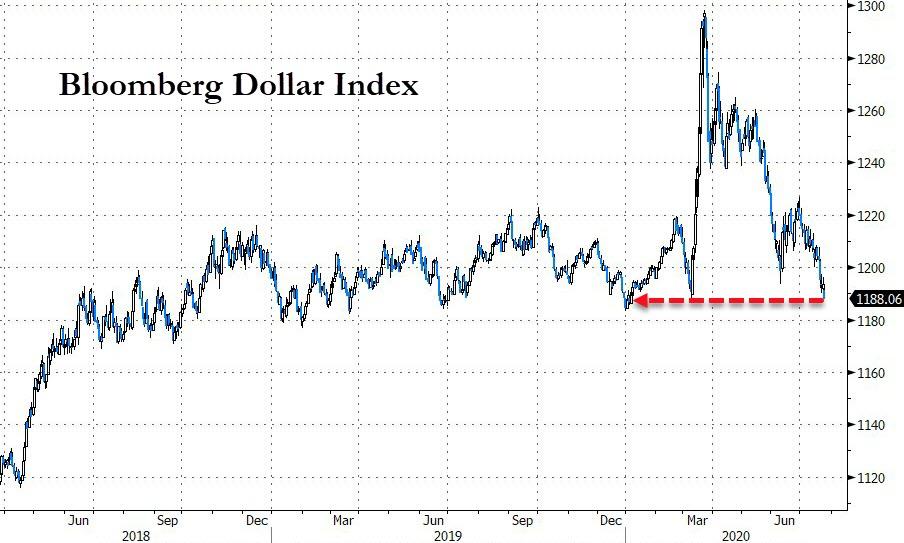
Is the world losing faith in fiat?
via ZeroHedge News https://ift.tt/3jEUpNx Tyler Durden
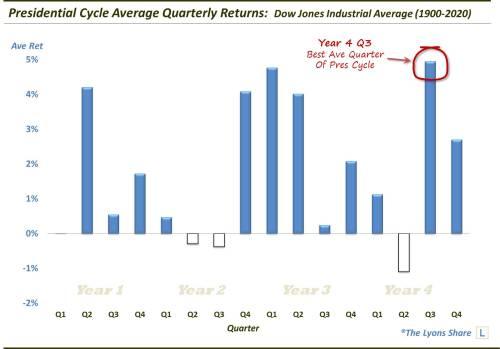
The 3rd quarter of election years has been the best performing quarter of the entire Presidential Cycle – though, there are some caveats.
While it is typically well down on our list of investing inputs, seasonality can have a meaningful influence on markets. In fact, in the long-run, there have been few trading systems that would have kept pace with even a rather simple seasonality system. And one of the seasonal patterns with a respectable track record is the Presidential Cycle. The Presidential Cycle refers to the behavior of the stock market vis-a-vis a 4-year Presidential term. Throughout time, stocks have tended to do very well during some periods of the Cycle, and not-so-well during other parts. It is not a fool-proof system, but it has behaved consistently enough to seriously consider its statistical merit.
Given its track record, we are in a particularly interesting period of the Cycle. Specifically, since 1900, the best performing quarter of the Presidential Cycle, using the Dow Jones Industrial Average, has been the 3rd quarter of election years (i.e., the quarter that started July 1). During the 30 cycles since 1900, the 3rd quarter of election years has averaged nearly 5%. Thus, we should not be surprised to see stocks off to a strong start to the quarter thus far.
Before we get too carried away, however, there are a few caveats that may prevent one from becoming too blindly bullish.
First, seasonality does not work every time. There are periods of out-performance and periods of under-performance — that’s how you come up with an average! One need only look at the prior quarter to see that the pattern does not always work. While the 2nd quarter of election years is, on average, the worst performer of the entire Cycle, stocks put up their best quarter in over 30 years, coming off of the March crash.
Secondly, the election year 3rd quarter average return benefits, in part, from one very large quarter back in 1932. That quarter saw the DJIA gain 67%, the second largest of any quarter since 1900. Without that one quarter, the election year’s average 3rd quarter return would drop all the way to +2.7.
Lastly, and speaking of 1933, some folks would take exception to including results back to 1900. They would instead advocate for beginning the study in 1934, following passage of the 20th Amendment which pulled forward the inauguration date and Congressional start date to the January following the election. So while we would still default to the “more data is better” philosophy, perhaps they are onto something. If we do start in 1934, the average return for the 3rd quarter of an election year drops to +0.9% and to the back half of all returns. Furthermore, just half of the quarter’s returns over the time frame were positive, placing it with the 1st quarters of Year 1 and Year 2 as the least consistent gainer.
So while seasonality in general, and the Presidential Cycle specifically have respectable track records, there are plenty of other factors that we would focus on first as inputs into our investment decision-making process. To the extent that the Cycle is a gentle influence on prices, we consider it a positive one for the duration of this quarter given the quarter’s status as the best-performing quarter of the Cycle. However, based on more recent performance, we would have to temper that enthusiasm a bit.
* * *
How much “stock” are we putting into this data point? How is it impacting out investment posture? If you’re interested in an “all-access” pass to all of our charts, research — and investment moves — please check out our site, The Lyons Share. You can follow our investment process and posture every day — including insights into what we’re looking to buy and sell and when. Thanks for reading!
via ZeroHedge News https://ift.tt/2OPY8Kd Tyler Durden
New Home Sales Smash Expectations In June Despite Surge In Prices Tyler Durden
Fri, 07/24/2020 – 10:08
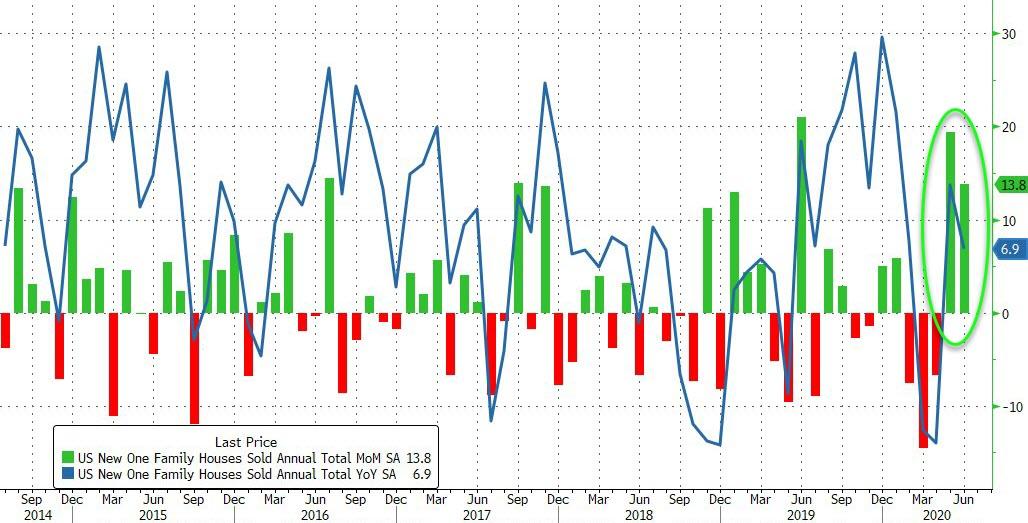
Following existing home sales (admittedly lagging) rebound in June, new home sales were expected to continue their recovery, but at a much slower pace than May’s 16.6% surge. However, it massively outperformed, rising 13.8% MoM (vs 3.6% MoM exp) and an upwardly revised 19.4% MoM surge in May (from +16.6%).
This leaves new home sales up 6.9% YoY…
Source: Bloomberg
On a year-over-year basis, new homes sold by region is shocking…
Northeast: +111.5%
Midwest: +33.3%
South: -1.8%
West: 4.1%
New Home Sales in the Northeast hit 13 year high as exodus from big cities soars on mass protests.
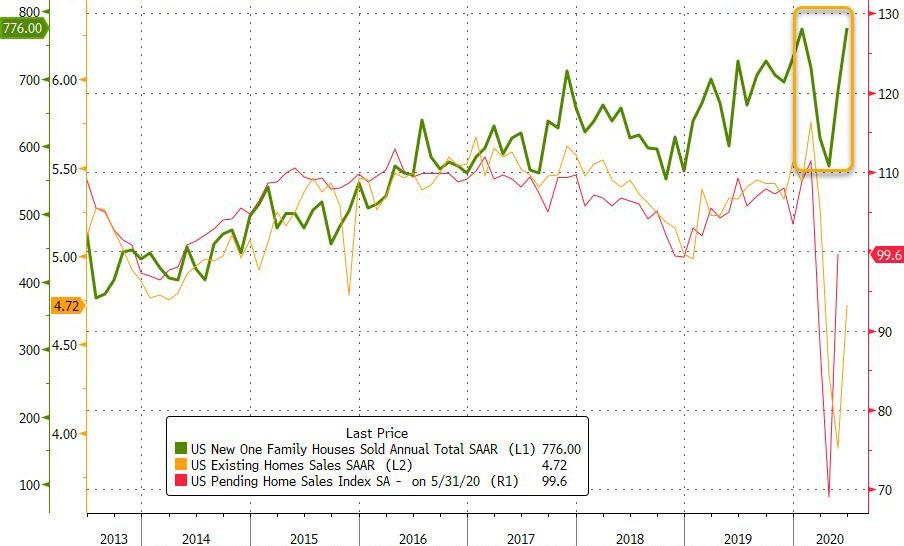
The V-shaped recovery in new home sales is complete…
Source: Bloomberg
The natural question, as we asked previously, is why the housing market was able to bounce so quickly in the face of an historic shock which left 22 million people unemployed? Here BofA offers five explanations:
An uneven recession: the shock disproportionally impacted the lower income population who are less likely to be homeowners. Consider that 55% of households earning less than $35K a year lost employment income vs. only 40% of those earning $75K and above. According to the NAR, the median household income of recent homebuyers is $93k.
Record low interest rates: mortgage rates reached a new historic low last week. Average monthly mortgage payments have declined by $80/month relative to this time last year due to lower mortgage rates.
Running lean pre-crisis: inventory was low, home equity was high and debt levels manageable. The homeowner vacancy rate reached the lows of the mid-1990s.
Supportive fiscal and monetary policy: forbearance programs reduced potential stress from delinquencies – according to the MBA, 7.8% of all mortgages were in forbearance as of July 12, which amounts to 3.9mn homeowners.
Pandemic-related relocations: moving to the ‘burbs is a real phenomenon. Take NYC – according to data from USPS, the number of mail forwarding requests from NYC spiked to more than 80,000 in April, 4X the pre-COVID-19 monthly pace.
And to cap it all off, the median home price surged from 307K in April and $310K in May, the lowest in one year, to 329.2K in June, highest since Feb …
Which of course is offset by the collapse to record lows of mortgage rates.
via ZeroHedge News https://ift.tt/3f427O0 Tyler Durden