As part of the Fed’s broad review its monetary policy framework, strategy, tools, and communication practices that the US central bank is undertaking this year, one of the most controversial aspects under consideration is the implementation of “symmetric” inflation targeting, i.e., allowing the economy to run hot without hiking rates in hopes of stimulating growth, well, that’s the stated purpose. The real purpose is the Fed’s burning desire to inflate away the record US debt however that has so far proven virtually impossible as the current stock of debt makes any rate hikes impossible. There is another problem: as BofA writes in an analysis published today, as inflation accelerates, it is the lowest income cohort, i.e. America’s poorest, that experiences higher inflation than the highest income group. In other words, the Fed is explicitly creating even more inequality.
Unfortunately, this – as BofA’s strategists find – “is one of the unintended costs of allowing inflation to run above target.” But, as she concludes, impairing America’s poor even further, “is unlikely to deter the Fed.”
First, the background details:
Official inflation has persisted below the 2% target this cycle, coinciding with a drift lower in inflation expectations. Throughout this year, Fed officials have mused about “makeup strategies,” allowing inflation to overshoot the target to compensate for past undershooting. At the Fed’s June policy framework conference in Chicago, Fed Chair Powell noted that the models suggest this strategy would be effective, but in reality there are major credibility questions as it requires buy-in from households and businesses. In order to become credible, a make-up strategy would need to be communicated in advance of a downturn, and be followed by years of consistent policy. To BofA, Powell’s comments spray cold water all over a strict inflation averaging regime.
However, an even more important dynamic that the Fed should consider when pushing inflation above target-inflation: gains are felt unevenly by income cohort. Empirical observations find that when inflation picks up, the lowest income cohort generally experiences higher inflation than the highest income group, because they spend more income share on rent, food at home, and other inflationary items. This can be shown by comparing the inflation rate of the bottom 20% and the top 20% income distribution, reweighted by their spending shares. As shown below, inflation runs above for lower income households given their spending composition.
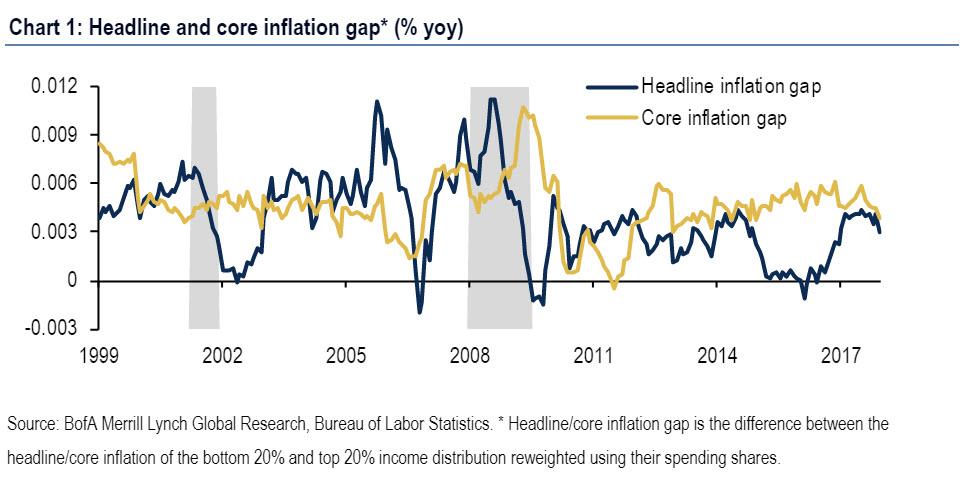
There is a persistently positive headline and core-excludes food and energy-inflation gap between the bottom 20% of the income distribution and the top 20%. Since 1999, the consumer in the bottom quintile has experienced 10% more cumulative headline inflation (0.39% on average) than the consumer in the top quintile income group. They have also experienced 15% more core inflation (0.47% on average), and the core inflation gap has been more stable compared with the headline inflation gap. The headline inflation gap is highly correlated with headline inflation-the correlation is around 0.8 based on the data from 1999-2017-suggesting that inflation gap is likely to widen when headline inflation picks up. As one can imagine, the inflation gap originates in spending differences in both core items and non-core items (i.e. food and energy) for people at top and bottom of income spectrum.
To understand these gaps, BofA compares the shopping carts of these two groups (Chart 2). The largest difference within core lies in shelter. The lowest income consumer is much more likely to be a renter than a homeowner, while the opposite is true for the highest income consumer. Thus, rent of primary residence has a much larger share in the former’s spending basket, while owners’ equivalent rent (OER) is bigger in the latter. Rent of primary residence inflation is persistently higher than OER inflation (Chart 3), thus a higher weight in the former at the expense of latter would bias up aggregate inflation. Also, taking into account the share differences of rent of primary residence (+12.8%), OER (-9.8%), and lodging away from home (-1.5%) indicates that shelter share broadly is a larger share of spending at the low-end (net share difference around 1.5%, Chart 2 again). This provides additional upside bias given that shelter inflation generally runs hotter than broader core inflation, and is therefore a “high inflation” category (Chart 3).
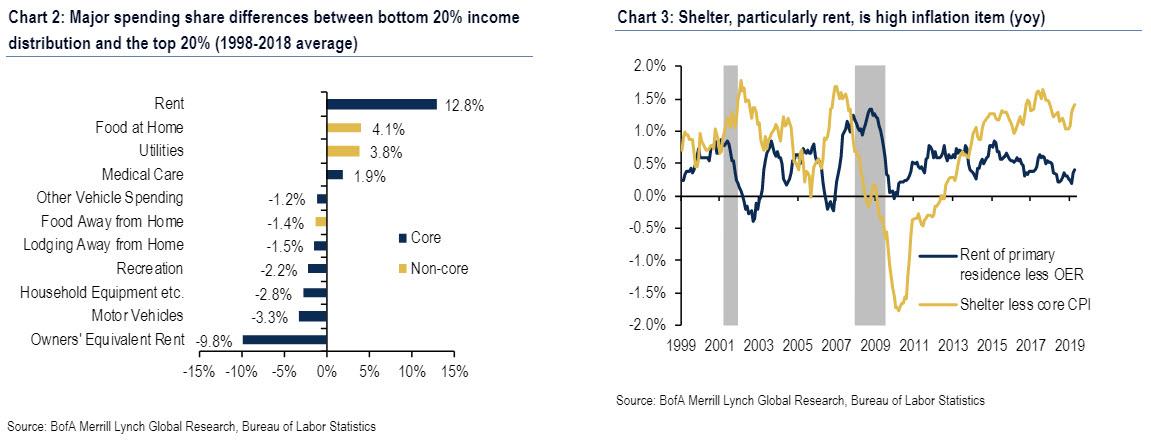
While shelter, or rather rent, is the most important spending category, there are also other categories that contribute to the core inflation gap between the top and bottom income brackets, if on a smaller magnitude. The lowest income consumers tend to spend more on medical care services and less on things like motor vehicles, household equipment, recreation, and other vehicle spending. Like shelter, medical care inflation typically runs hotter than broader core inflation, averaging 3.8% since 1999 versus 2% for core CPI (Chart 4).
With the exception of other vehicle spending, the other major core categories where the lowest income consumer spent less than the highest income consumer generally experienced more subdued inflation relative to core. Thus, the bottom bracket loses out relative to the top bracket by allocating more of their spending to a high inflation category and less of their spending to lower inflation categories.
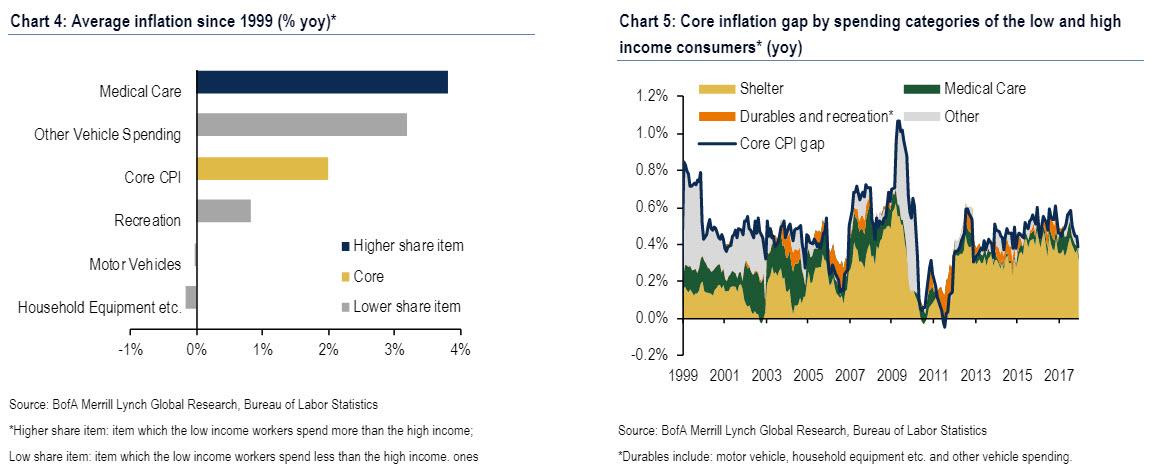
Breaking down the core inflation gap, shelter and medical care explained 91% of the inflation gap on average from 1999-2017 (Chart 5). That said, since the financial crisis the contribution from healthcare has declined while shelter has picked up and now explains most of the inflation gap. The rent is, indeed, too damn high… and it is hurting the poor first and foremost.
The remaining 9% of the inflation gap was explained by categories where the lowest income bracket spent less and other categories with minor shopping cart differences from the top income bracket. The dominance of shelter explains why the core inflation gap tends to widen during periods of high inflation, as shelter is the largest cyclical component of inflation. This creates a problem for the Fed trying to overshoot inflation. In their ideal scenario, above-target inflation will be underpinned by core cyclical inflation, which is largely comprised of shelter.
Looking at the broader, headline inflation, food and energy spending differences further widen the cyclical inflation gap between income groups for headline inflation. As shown in Chart 2, the lowest income consumers tend to eat at home, whereas the highest income consumers often eat outside. Food at home inflation is more volatile than food away from home inflation, and as both move with the cycle the former will reach lower troughs and higher peaks which contributes to the cyclical nature of the inflation gap (Chart 6). Energy is also a cyclical category and lower income consumers tend to spend a greater share of their budget on utilities (Chart 7). As such, higher food and energy costs also contribute to greater cyclicality in the headline inflation gap.

So are the poor always doomed to get the short end of the stick from the Fed? Well… yes, especially since as BofA ominously warns, “inequality is not the first-order consideration for Fed policy.“
And her an amusing aside from BofA which asks rhetorically, it “the fact that higher inflation hurts the lowest income workers disproportionally might lead people to question if monetary policy contributes to greater inequality.” Well, of course – in fact, former Fed Chair Bernanke pointed out in 2015 that that was one of the major critiques of quantitative easing. Two effects are often mentioned.
- The “income composition channel”: People in lower income buckets primarily rely on wages for income, while people in higher income buckets will also be compensated with corporate equities. If expansionary monetary policies boost corporate profits more than they do wages, those with claims to ownership of firms will tend to benefit disproportionately, worsening income inequality.
- The “portfolio channel“: Low-income workers tend to hold relatively more currency than high-income workers. Therefore, higher inflation would hurt the purchasing power of low-income consumers more than high-income, increasing consumption inequality
In short, not only is the Fed screwing the poor… it is doubly screwing the poor!
What is the Fed’s defense to this argument that it has been the primary driver behind wealth and income inequality? As BofA tactfully puts it, “monetary policy is a blunt instrument and the Fed’s goal is to focus on the macro, not the micro.”
In other words, in the grand scheme of things the Fed’s job is to focus on those pathways that make the rich richer, even if in the process the poor become even poorer, and the US middle class erodes.
Or, as BofA puts, “the goal of price stability and full employment is to ensure that the business cycle evolves as smoothly as possible. If successful, this will underpin economic prosperity for the broad population, particularly for the lower income cohorts which tends to be most affected by business cycle fluctuations. Carpenter and Rogers (2004)corroborate this view and find that during a downturn and early stages of the recovery, elevated unemployment tends to disproportionately impact low income groups.”
This justification that “the poor will be worse off thanks to the Fed’s policy, but will be even more worse off without it”, continues:
Even for people who keep their jobs during recessions, wage growth generally worsens the most for low skilled workers. Using the Atlanta Fed’s wage tracker, we can calculate the difference in median wage growth between the bottom 25% of wage earners and the top 25% of wage earners, which we call the wage gap. We find that the wage gap is highly cyclical and tends to lag the output gap (Chart 9). Thus, bottom wage earners benefit more from a strong economy and this serves to offset the wider inflation gap discussed earlier. It is worth noting that the wage gap turned positive in 2014 and is now at the highest level since 1999.
Bottom line, the Fed’s apologists will say, “by stabilizing the business cycle and thereby promoting job and wage growth, the Fed produces a positive outcome for the lowest income cohort.”
Yes… but there is major collateral damage which is also cumulative. The most powerful counterpoint by far, is that most (poor) people refuse to accept such a unfalsifiable statement – that life would be even worse if they stood up to the actor who is making lives bad – and the outcome are soaring populist movements, events such as Brexit and “Trump”, and central banks that are increasingly the target of popular and populist ire. In fact, such grassroot anger at inflationary Fed policies taken to an extreme, as under the proposed policy frameworks of far-left Democrats such as AOC and Elizabeth Warren both of which are promoting MMT, or “helicopter money”, would eventually result in the disintegration of the central bank model as once the government is allowed to print its own money, as MMT suggests, that’s when the central bank becomes obsolete.
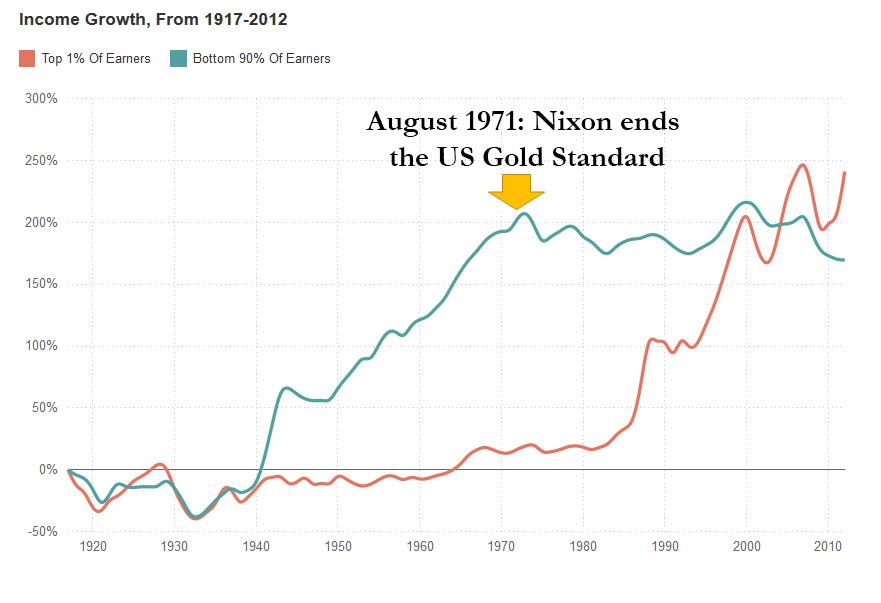
Incidentally, for those curious just what event catalyzed the unprecedented divergence between America’s haves and have nots, we provided the answer over 4 years ago: the dramatic ascent of the “Top 1%” of earners at the expense of the “Bottom 90%” started in the early 1970s… when Nixon ended the gold standard. It is this monetary framework, more than anything, that the current iteration of the Fed will do everything in its power to protect.
Should it be successful, one thing is certain: the implementation of more “bubble” policies that create even greater social inequality, one which – as the French discovered in the late 18th century – inevitably culminates in revolution.
Which is, no matter how one gets there, the end of the Fed couldn’t come fast enough.
via ZeroHedge News http://bit.ly/2Xuv2mg Tyler Durden