Long the subject of guesswork and speculation, Saudi Aramco, the state-controlled oil giant that’s responsible for roughly 10% of the world’s oil production, has for the first time ever opened its book to investors as it prepares to launch a $10 billion bond offering.
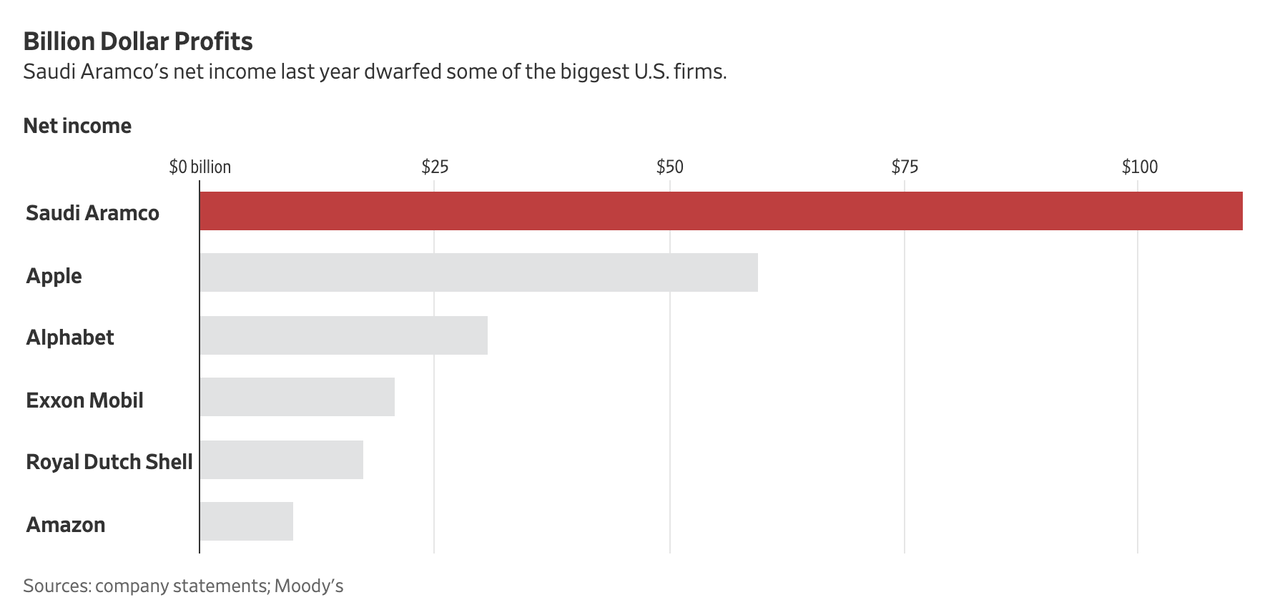
And the three years’ of financials confirmed what many have long suspected: Aramco’s profits beat out tech giants like Apple and publicly-traded rivals in the energy space like Exxon-Mobil and Royal Dutch Shell, establishing the energy behemoth as by far the world’s most profitable company. In 2018 alone, Aramco’s profits exceeded $110 billion on $360 billion in revenue. That’s nearly double Apple’s $60 billion profit, and five times Shell’s ($23.9 billion). Thanks to the surge in oil prices last year, Aramco’s net income climbed by 50% from $75.9 billion in 2017.
Last year, the company earned more than Alphabet, Apple and Exxon combined.
The revelations come courtesy of Moody’s Investors Service and other ratings firms, which released the results as part of its credit rating analysis for the upcoming bond offering. Moody’s attributed Aramco’s profitability to its sheer size and access to some of the world’s largest oil and gas reserves, per WSJ. Furthermore, the prospectus for the bond offering, which included three years’ worth of financials, showed the company’s operating profit, before interest and tax, was $212 billion.
“Aramco’s scale of production in combination with its vast hydrocarbon resources is a very strong competitive advantage,” Moody’s said.
Aramco produced, on average, 13.6 million barrels a day in 2018, three times Exxon Mobil’s 3.8 million barrels.
One key takeaway from the prospectus is just how dependent Aramco’s profits are on oil price swings (though that shouldn’t come as much of a surprise). It’s net profit in 2016, when oil prices were mired near their lowest levels in more than a decade, was just $13.6 billion.
Aramco has hired JPMorgan and Morgan Stanley to manage its first debt offering, with its pre-offering roadshow beginning n Monday in at least eight cities across the US, Europe and Asia, according to WSJ. Investment bank Lazard has also been hired as an independent adviser on the bond sale.
Despite the company’s immense profitability, ratings agencies were reluctant to give it one of the top two ratings because of the control of the Saudi state, which heavily taxes the company. As the Financial Times pointed out, Aramco doesn’t generate as much cash per barrel as its publicly traded rivals.
Rating agencies Moody’s and Fitch assigned the state oil company ratings of A1 and A+ respectively in line with the Saudi state, reflecting its close ties to the kingdom that has long relied on the world’s largest oil producer to fuel its public funds. But Saudi Aramco’s finances also show the state’s reliance on the company means it does not generate as much cash per barrel as non-state peers, with the tax take from the kingdom meaning it generated approximately $26 a barrel last year compared to $38 a barrel for Royal Dutch Shell and $31 a barrel for France’s Total. In 2018 Saudi Aramco generated $224bn of earnings before interest, tax, depreciation and amortisation.
Fitch noted its “high production, vast reserves, low production costs and very conservative financial profile” would give it a standalone rating of AA+, but said it would cap its rating at A+ due to the links between the company and the sovereign and the influence the state has on the company through regulating the level of production, taxation and dividend. Similarly, Moody’s said that while Saudi Aramco has many characteristics of a Aaa-rated corporate – such as minimal debt relative to cash flows, large scale of production, market leadership and access in Saudi Arabia to one of the world’s largest hydrocarbon reserves – its final rating was restrained to A1 “because of the close interlinkages between the sovereign and the company.”
The proceeds from Aramco’s first bond offering in international markets will be used to finance its planned acquisition of Sabic, the Saudi state-held industrial chemicals giant. Incidentally, the publication of Aramco’s financials could help whet investors’ appetite for shelved stock offering, where the kingdom had planned to float 5% – or some $100 billion, depending on the exact valuation – of the company’s shares
A new sort of sex scare is taking hold. This time—after decades of folks freaking out over the opposite—it’s young people abstaining from sex that has the youth-panic pundits and other chattering-class types fretting.
An article and accompanying chart in The Washington Post sparked off the latest flurry of concerned commentary. The latest General Social Survey (GSS) found that the number of 18- to 30-year-olds who hadn’t had sex in the last year rose for both men and women between 2008 and 2018:
Currently celibate young men rose from around 10 percent in 2008 to around 28 percent last year.
Currently celibate young women rose from a little below 10 percent to 18 percent.
The GSS simply asked about sexual frequency and didn’t pry into the causes, leaving assumptions to run wild and letting people project whatever political spin they wanted (#MeToo! the financial crisis! video games!).
Folks also speculated about the trend’s potential consequences, ranging from the election of Donald Trump to the decriminalization of prostitution. Most of the concern came for the sex-free young men, whom no one seems to suspect are celibate by choice and/or content in their current arrangement. Rather, the assumption seems to be that this additional segment of sex-free young men is a sign and portender of any number of catastrophic things.
There are plenty of possible positive or neutral explanations for the increases, including people getting married at later ages and more people choosing to reject casual sexual encounters. (Keep in mind that the past few decades have also seen decreases in teen pregnancies, untended pregnancies overall, abortions, and HIV infections.) But the Post article—which relies heavily on commentary from perennial generation doomsayer Jean Twenge—and social media commentators leapt right to imagining a new lost generation of young men, jobless and living in their parents’ basements, unable to land dates or find love.
From there, it was a quick jump to talking about MAGA hats and hate crimes. Others blamed technology, social media, and porn.
Samuel Perry, a sociologist at Oklahoma University, corrected the record with regard to higher consumption of porn equating to less sex in real life. “Folks have been asking whether the decline in people (mostly men) having sex is due to #porn. Not likely,” Perry tweeted.
Rather it seems the decline is among men NOT watching porn….Men who watch porn tend to have MORE sex, not less….
And of course people gotta remember that women are more likely to watch porn within the context of sexual relationships, as part of sexual activity. So it shouldn’t be surprising that the women who view more porn also have more sex on average (i.e., cuz they watch w/a partner).
Economist Gray Kimbrough also suggested a reason to be skeptical of the data overall. The GSS sample is only “a couple of thousand people every two years. And the questions aren’t exactly constant across years,” Kimbrough tweeted:
A lot of people have been passing around this “stunning chart,” and it looks pretty dramatic. But I’d like to once again strongly warn anyone not to draw strong conclusions using only GSS data. https://t.co/I3LZtRd5ZJ
School choice in court in Wisconsin. “Once again, the state Department of Public Instruction is violating the law to harm private schools in the choice programs,” says Libby Sobic, a Wisconsin Institute for Law & Liberty attorney suing the Department of Public Instruction over its decision not to allow “virtual instruction” to count toward classroom instruction hours. “Public schools all over the state are using online learning to expand student access to curriculum and as a way to avoid cancelling classes due to Wisconsin’s winter weather. But [the department] will not give students at choice schools those same opportunities. It’s unfair, wrong, and illegal.”
FREE MARKETS
New Jersey piano tuner can keep his home. The Institute for Justice helped secure a win for Charlie Birnbaum, a piano turner whose home was being threatened by eminent domain in New Jersey. A “state agency called the Casino Reinvestment Development Authority has been trying to take the home Charlie’s parents first purchased in 1969 and replace it with…nothing. Literally nothing,” writes IJ attorney Dan Alban.
Luckily, an appeals court sided with Birnbaum. “In a unanimous opinion, the court affirmed IJ’s initial victory in this case, which followed a trial held back in 2016,” explains Ablan. “The trial court found that the government’s attempt to take Charlie’s property without any credible plan for doing anything with it was a ‘manifest abuse of the eminent domain power.'”
FOLLOWUP
Will Robert Kraft be suspended over sex-solicitation charge? The Patriots owner has plead not guilty and is currently challenging the charge. If Kraft “wins in court, [NFL] Commissioner Roger Goodell will be faced with a major dilemma,” writes Mike Florio at NBC Sports. “If a player were charged with solicitation of prostitution and cleared (whether on a technicality or on the merits), he’d likely face no punishment from the NFL….But that nuance will be lost when considering the league’s common refrain that owners are held to a higher standard, and when realizing that multiple players who were never arrested or charged with anything have received significant suspensions.”
QUICK HITS
Mark Zuckerberg said the internet needs more regulation. Translation:
“I have an army of lawyers and compliance people. Please make life hell for my competition.”
In a new episode of the podcast Doublrshift, hosts “talk to moms, madams and experts to explore the perks and pitfalls of being a working mom when your office is a legal brothel.” The Nevada Brothel Association called it “an extremely well-done program that tells the honest truth about the women who work safely and lawfully in Nevada’s legal brothels.”
Russia is blocking the encrypted email provider ProtonMail. “Russian federal authorities have directed internet service providers across the country to block access to ProtonMail,” writes Tamer Sameeh, “as confirmed by the company’s CEO. The block order came directly from the Russian Federal Security Service, which was formerly known as the KGB.”
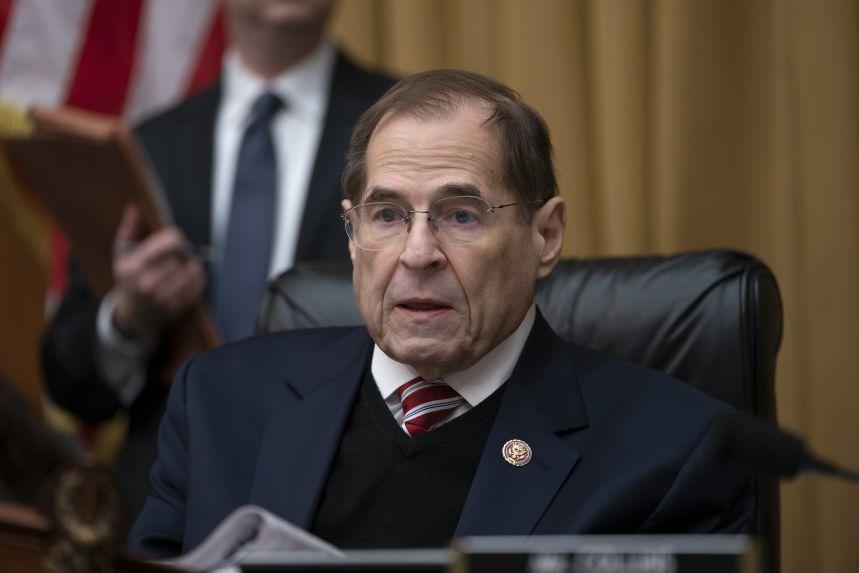
The House Judiciary Committee led by Chairman Jerry Nadler (D-NY) will vote on Wednesday to authorize subpoenas for a full, unredacted copy of the nearly 400 page Mueller report, according to CNN and the Wall Street Journal.
House Judiciary Committee Chairman Jerry Nadler, (D-N.Y.), on March 26 PHOTO: J. SCOTT APPLEWHITE/ASSOCIATED PRESS
Nadler said Monday that he had scheduled a markup on Wednesday to authorize a subpoena for the Mueller report, as well as the special counsel’s underlying evidence. The markup would give the New York Democrat the green light to subpoena the report, though Nadler has not said whether he would do so before Attorney General William Barr releases a redacted version publicly, which he is expected to do later this month. –CNN
Nadler’s committee will also vote on whether to issue subpoenas for five former White House staffers; Steve Bannon, Hope Hicks, Reince Priebus, Don McGahn and Ann Donaldson – who Nadler claims may have received documents from the White House connected to the Mueller probe that would waive executive privilege.
On Friday, Barr sent Nadler and Senate Judiciary Chairman Lindsey Graham a letter notifying them that he was working with Mueller to redact sensitive information which could affect ongoing matters – including grand jury material, information that would infringe on someone’s personal privacy or information which could compromise the DOJ’s sources and methods of investigation, and that the redacted report would be ready by mid-April “if not sooner.”
This wasn’t good enough for Nadler, who responded “As I informed the Attorney General..Congress requires the full and complete Mueller report, without redactions, as well as access to the underlying evidence, by April 2. That deadline still stands.”
Nadler also said Barr should work with Congress through the court system to allow the grand jury material to be made public – which one Democratic aide called the “primary obstacle” to its full release.
“We have an obligation to read the full report, and the Department of Justice has an obligation to provide it, in its entirely, without delay. If the department is unwilling to produce the full report voluntarily, then we will do everything in our power to secure it for ourselves,” wrote Nadler in a New York Times op-ed published Monday. “We require the report, first, because Congress, not the attorney general, has a duty under the Constitution to determine whether wrongdoing has occurred. The special counsel declined to make a ‘traditional prosecutorial judgment’ on the question of obstruction, but it is not the attorney general’s job to step in and substitute his judgment for the special counsel’s.”
Top House Judiciary Republican Georgia Rep. Doug Collins has accused Nadler of trying to force Barr to “break the law by releasing the report without redactions.”
Democrats argue that there’s ample precedent for Barr to release the full report to Congress, including grand jury material, pointing to the investigations into Watergate and former President Bill Clinton. They’re also citing the Republican-led investigation in the last Congress into the FBI and Justice Department’s handling of the Clinton and Trump-Russia investigations, in which Republicans demanded sensitive law-enforcement documents from the department. –CNN
Last month Barr released a four-page summary of Mueller’s nearly two-year investigation into Russian matters surrounding the 2016 US election – which concluded that President Trump and his campaign did not collude with Russia. Mueller let Barr and Deputy AG Rod Rosenstein decide whether Trump obstructed Justice, which they ruled he did not.
via ZeroHedge News https://ift.tt/2uBT7L0 Tyler Durden
In previewing the “green shoots” catalysts to watch for the second quarter after a dismal for the economy first quarter, BofA’s Michael Hartnett listed five key data points which he thought would set the quarterly mood early, and which included US retail sales and manufacturing ISM, South Korean export orders, February German factory orders and, last but not least, China’s manufacturing new orders PMI
And, as we reported over the weekend, late on Saturday we got arguably the most important one when China confirmed prior speculation of a rebound in its economy, when the National Bureau of Statistics reported that China’s manufacturing PMI jumped from a contractionary 49.2, printing at 50.5, its first expansion since September 2018, and beating estimates of a 49.6 reading.
This set the euphoric mood as early as the first day of the quarter with stocks around the globe soaring, and even this morning big miss in retail sales, which printed at -0.2%, well below the 0.2% expected and deep in the “bearish” column in the table above, failed to dent the market’s optimism.
But can this bullish sentiment continue?
That’s the topic of Charlie McElligott’s latest “talking points” note, ahead of what the Nomura strategist calls a massive week of global data which can “make or break” this latest “end-of-cycle” spasm in start “growth scare” fashion. Here are the main highlights:
China PMIs get the joy going, although as Nomura’s China expert Ting Lu pushes back — while “Rest of World” data continues lower in the meantime.
The “Fed Rate Cut Panic of March 2019” sees the overshoot now mean-reverting (as negative convexity crowd now looks appropriately “adjusted”), with front-end curves steepening to reverse part of the “stop-ins” seen early last week, while Reds / Greens see profit-taking / downside bets layered-in over the past few sessions.
Watch for a period of very bullish seasonality- and hedge fund underpositioning, a set-up for strong S&P performance at the start of April
* * *
Below we present the full list of McElligott’s “hot takes” covering everything from this weekend’s key Chinese data (which Nomura is far more cautious on than the rest of the market), as well as his preview of the main catalysts – both fundamental and technical – that will shape market optimism over the first days of the second quarter.
Equities are ”foaming at the mouth” to start the week (SZCOMP +3.6%, SHCOMP +2.6%, NKY +1.4%, DAX +1.4%, Spooz +0.8%–while yields on Chinese 10Y bonds rose the most since Oct 2017) following the weekend release of Chinese Manu PMIs, with both “official”- and Caixin- kind reaccelerating into “expansionary” territory (“official” PMI saw the largest increase since 2012)—indicating that policy easing begun last year is now beginning to positively impact growth again
However, Ting Lu has had the best China call on the Street and remains cautious despite the PMI rebound:
“The rise in the March PMI and incoming activity data could be partly the result of the lunar new year (LNY) holiday distortion and the anti-pollution campaign. Final demand exports, new home sales and passenger cars remain weak, and could limit the upward momentum of the PMI. Though we believe sentiment has improved and Beijing’s stimulus has been gradually kicking in, we remain cautious in interpreting the 50.5 PMI reading for two reasons.
First, the official PMI has occasionally been poor gauge of growth momentum over the past five years, especially in spring. For example, in spring of 2014 and 2015, amid slowing growth, the manufacturing PMIs actually rebounded in March. One factor behind these false signals from the manufacturing PMI in spring is the LNY holiday distortion, which make applying an appropriate seasonal adjustments challenging.
Second, the jump in new credit in January this year could indicate some restocking activity, as evidenced by the jump in the raw material inventory sub-index (up to 48.4 in March from 46.3 in February). However, real final demand could remain weak as growth in exports, new homes and passenger cars remain in negative territory.”
The net / net for Ting—this PMI print does nothing to change his long-held view on the sequencing of the Chinese recovery (bottoming in 2Q), which will only ultimately recover if / when Chinese authorities ease their prior tightening measures in the Property sector:
“We believe there is limited room for a further rise in the manufacturing PMI and see a substantial likelihood that the PMI could dip again. We maintain our view that a stabilization could take place in mid-year followed by a moderate recovery in H2, and that the key factor is a property market recovery in Tier 1 and Tier 2 cities driven by an easing of property tightening measures.”
The positive reception to Chinese data overwhelmed the broad negatives from Japan (Tankan “misses” across the board) to Europe, where PMIs bombed (German data particularly ugly, slipping to 44.1 from the flash 44.7 and 47.6 for Feb) AND another “miss” in Euro Area HICP (with “Core” down to 0.8% YoY in March from 1.0% YoY in Feb)—whereas despite the further slowing / disinflationary signs, EU stocks see leadership this morning from “High Beta Cyclicals”—Autos, Miners & Materials and Banks all ripping higher to start the week
The “Fed Rate Cut Panic of March 2019” seems but a memory now, further mean-reverting today with the Eurodollar strip again pounded (Reds and Greens again—part profit-taking with some blocks sold in past two overnights / part being ‘faded’ with downside bets i.e. the large EDZ9 97.375 / 97.25 PS bot in size last wk, along with long-end downside bets via USM9 144 Puts trading overnight) and with front-end spreads extending the end of last week’s steepening (for context, EDM9EDM0 Jun19-Jun20 went from -42bps on March 27th to today’s earlier -29bps steeps)
As outlined in both Thursday’s note and the profiled in-depth in Friday afternoon’s piece (“APRIL SETS-UP FOR A BULL RUN IN SPX…BUT WITH A CAVEAT”), April seasonality for US Equities is a powerful phenomenon: April has posted the best avg monthly return for the S&P over the past 30 years (+1.64%) and actually posts the second-highest % hit-rate of “positive return instances” of any month over the past 90 years
More granularly, the first two weeks of April (dating back to 1994) have shown to be particularly “pro-cyclical” / “reflationary” in nature across seasonal US Equities sectors- and factor- behavior (Sectors: Materials +1.4% on the median over the first 2w of April; Fins +1.2%; Energy +0.8%; Discretionary +0.7%; Factors: Beta L/S +0.5%, Size L/S +0.5%; Cross-Asset: Crude +1.7%)
Perhaps the largest tailwind now for Equities is under-positioning from within the Leveraged Fund universe:
Long-Short Hedge Fund “Beta to SPX” remains just 15th %ile, while “Beta to Beta Factor” too is just 14th %ile
When L/S “Beta to SPX” is this low as “trigger,” SPX returns are 1m +3.3% 82% hit rate, 3m +3.4% 84% hit rate, 6m +7.8% with a 84% hit rate
Macro Funds incrementally adding broad Global Equities exposure last week, but still tilted “low” by historical standards—S&P 21st %ile, Nikkei 43rd %ile, Eurostoxx 41st %ile and EEM 25th %ile
Futures positioning data shows Leveraged Funds still “net short” -$20.1B of SPX and net short -$2.6B NDX (despite covering +$8.7B SPX and +$800mm NDX on the week)
The Nomura QIS CTA model shows systematic trend followers having sold futures across Russell, Nikkei, DAX, Hang Seng CH and KOSPI last week—and while still “Max Long” SPX and NDX futures, the actual $allocation is just 1/3 the “size” of the position “highs” made into Feb 2018
The Nomura QIS Risk-Parity model estimates that funds remain holding their lowest $allocation to US Equities since Mar / Apr 2017 (across S&P 500, S&P Midcap and Russell)
Additional catalysts for “higher SPX” over the month of April:
Current “negative revisions” into EPS tends to mean a lower bar to beat–which investors then tend to reward: per Anthony Antonucci, SPX is +2.7% over the six weeks after the commencement of corporate earnings when earnings revisions are negative with a 76% hit-rate since 2005
The oft-mentioned “Extreme Quarter-End Pension Rebalancing OUT-trade” analog, where last quarter’s 90th %ile Stock vs Bond outperformance as a trigger posts VERY positive short-term returns following the end-of-quarter “turn”—the 4d median return is +3.1%; 5d +3.4%; 6d +2.8%
Mid-month we see further “demand flows” pick-up again from the Corporate side as companies begin to emerge from their blackouts (Banks first), with 75% of S&P 500 corporates having emerged from their “Buyback Blackouts” by 4/30/19
via ZeroHedge News https://ift.tt/2CKazkY Tyler Durden
“Investors have long used where we are in the economic cycle to decide which stocks to buy and sell. New research from Nomura’s Joseph Mezrich flips that on its head by showing how investors can use stock performance to help determine where we are in the cycle. Too bad the market is sending mixed messages right now.”
But let’s be clear here; no one wants the party to end. So, despite a struggling stock market over the last year, slowing economic growth, and a collapsing yield curve, there are still plenty of articles suggesting you should just ignore it all and remain invested.
“Economist Ryan Sweet of Moody’s Analytics has a message for his fellow economists who are predicting a recession in the next year: ‘The Fed isn’t going to kill this expansion.’” – Ryan Sweet of Moody’s Analytics
But then he goes on to make an interesting statement:
“Recessions are typically caused by one of two things, he says: Imbalances develop in the economy or financial system (like a bubble in the stock market or in housing), or the Federal Reserve panics and raises interest rates too much in response to unexpected inflation caused by an overheating economy. Neither of those triggers is present.”
Uhm….okay…maybe Ryan just doesn’t get out of the house much but saying there isn’t a bubble in the stock market is like saying Mount Everest is just a mountain.
Also, with respect to his point that the Fed isn’t going to kill this expansion, well that too may also be a bit myopic. As shown, the Fed has been hiking rates to offset the specter of inflation which doesn’t exist to any great degree and have likely gone too far. We suspect this, because the recent reversal in policy is akin to what we have see repeatedly in the past. The Fed tends to stop hiking interest rates when they realize they have caused problems within the economy, like a sudden downward shift in housing, autos, and asset prices.
Sound familiar?
The problem with all of the mainstream claims that there is “no recession in sight” is those claims are based on analysis of unrevised and lagging economic data.
This is an incredibly important point.
The problem with making an assessment about the state of the economy today, based on current data points, is that these numbers are “best guesses” about the economy. However, economic data is subject to substantial negative revisions in the future as actual data is collected and adjusted over the next 12-months and 3-years. Consider for a minute that in January 2008 Chairman Bernanke stated:
“The Federal Reserve is not currently forecasting a recession.”
In hindsight, the NBER, eleven months later, announced that the official recession began in December of 2007.
“But if the Federal Reserve can’t predict a recession, no one can.”
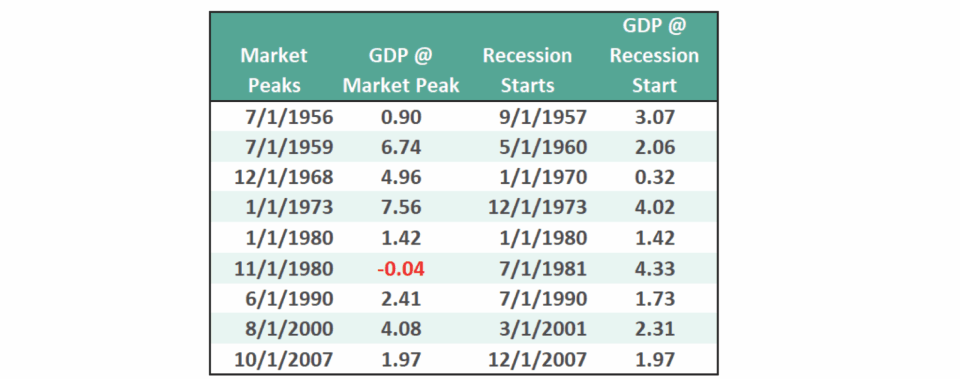
Well, that isn’t necessarily correct. For example, let’s take a look at the data below of real (inflation-adjusted)economic growth rates:
September 1957: 3.07%
May 1960: 2.06%
January 1970: 0.32%
December 1973: 4.02%
January 1980: 1.42%
July 1981: 4.33%
July 1990: 1.73%
March 2001: 2.31%
December 2007: 1.97%
Each of the dates above shows the growth rate of the economy immediately prior to the onset of a recession (this is historically revised data). If Ryan had been making his comments about the economy in 1957, it would have sounded much the same way.
“The recent decline from the peak in the market, is just that, a simple correction. With the economy growing at 3.07% on an inflation-adjusted basis, there is no recession in sight.”
You will note in the table above that in 6 of the last 9 recessions, real GDP growth was running at 2% or above.
At those points in history, there was NO indication of a recession “anywhere in sight.”
But the next month one began.
So, is the market really sending mixed messages?”
The Market Isn’t Confused
This is also likely a mistaken assumption. In reality, it may just be the unwillingness of “eternally optimistic”individuals to pay attention.
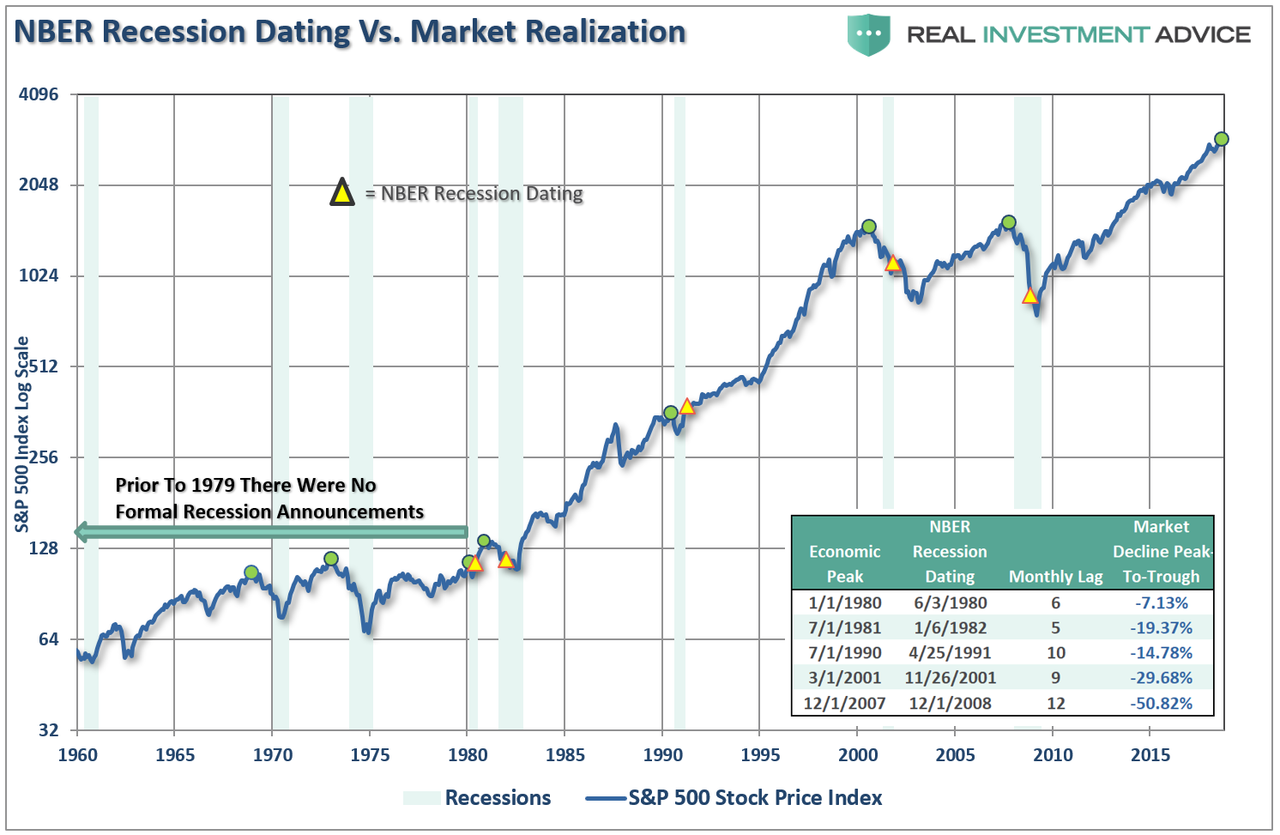
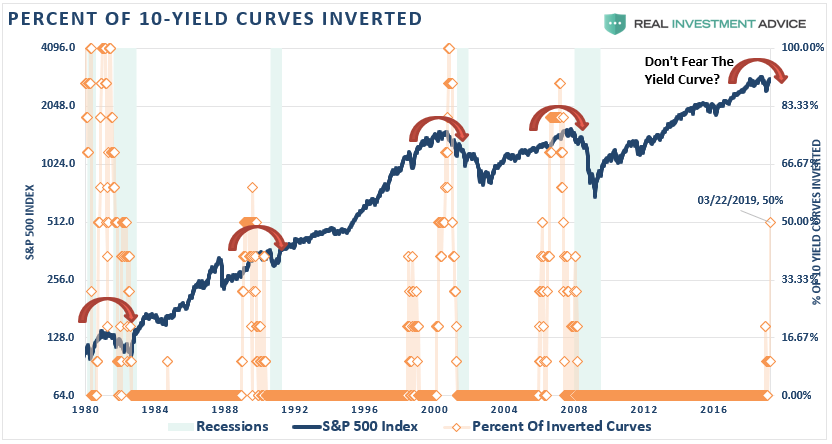
Take a look at the chart below. The green dots mark the peak of the market PRIOR to the onset of a recession. In 8 of 9 instances the S&P 500 peaked and turned lower prior to the recognition of a recession.
In other words, the decline from the peak was “just a correction” as economic growth was still strong.
In reality, however, the market was signaling a coming recession in the months ahead. The economic data just didn’t reflect it as of yet. (The only exception was 1980 where they coincided in the same month.) The chart below shows the date of the market peak and real GDP versus the start of the recession and GDP growth at that time.
The problem is in the waiting for the data to catch up.
So, if you really can’t count on economic data to “alert” you to the onset of a recession, what can you use.
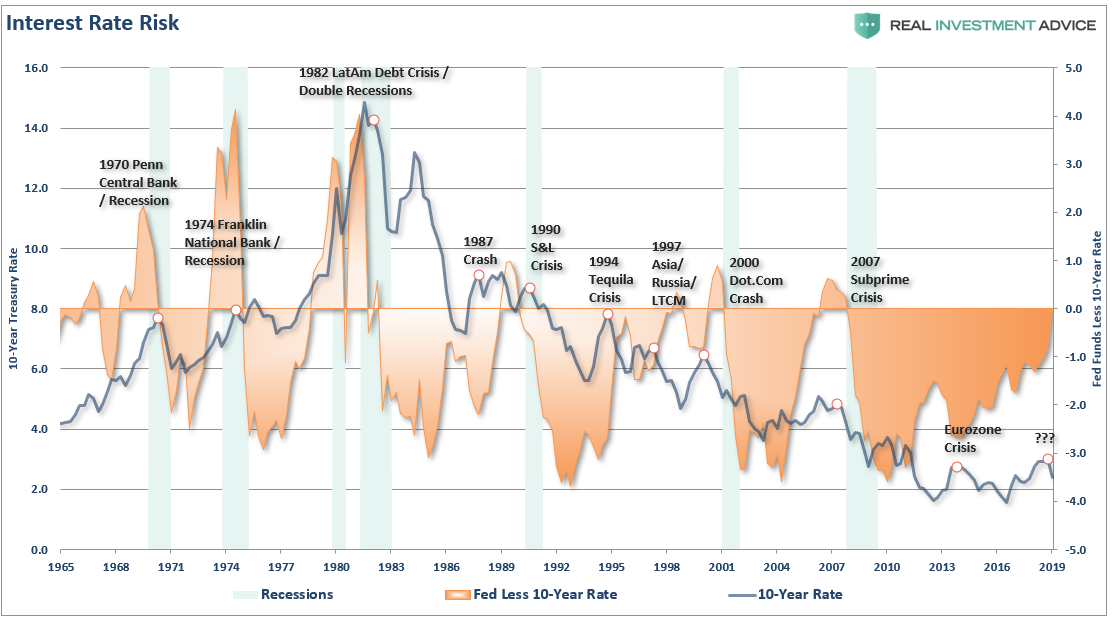
Well, by looking at the chart above, it is clear the stock market leads economic downturns. Also, as we have written about previously, so do yield curve inversions. The chart below combines both which shows this is indeed the case. In every prior instance going back to 1980, the stock market began to peak as the yield curve began to invert.
Also, when the Fed Funds rate exceeds the 10-year Treasury, that too has been a pretty strong indication of both market problems and the onset of a recession. Currently, the spread between those two particular rates (at the time of this writing) is +0.0%.
But even this warning has been met with criticism. Just recently, Dallas Fed President Robert Kaplan stated, with respect to the potential for the Fed to lower interest rates:
“I’d need to see an inversion of some magnitude and/or some duration, and right now we don’t have either. If you see an inversion that goes on for several months…that’s a different kettle of fish, but we’re not there yet.”
The problem for the Fed is in the waiting. A look back at the charts above show there are only two occasions going back to the 1970’s where the yield curve inverted and it didn’t lead to a recession. The problem with “patience” is that by the time the Fed does act, it will likely be too late which has historically always been the Fed’s problem.
Furthermore, the “yield curve inversion” is NOT the illness of the market, rather it is the symptom of virus infecting the economic environment. David Rosenberg just recently penned a rather exhaustive list.
The Fed turned TOO dovish, taking out not one, but both pledged rate hikes for this year and trimming its GDP forecasts.
The stock market didn’t mind the futures market pricing out future tightening, but discounting rate cuts means the Fed DOES see something nefarious around the corner. Market-based odds of the next move being a policy easing have jumped to 58% from 30% a week ago and 5% a month ago! Remember, the best time to “buy” the market is on the last rate cut, not the first one.
The 10-year/3-month yield curve finally inverted, albeit fractionally, for the first time since August 2007. This is not an infallible indicator, but predicts recessions with 85% accuracy.
Not only has the yield curve inverted, but the composition of the drop in bond yields should be a worry sign to equity investors. While inflation expectations have receded to 1.9% (for 10-year break-evens,) fully 85% of the slide in Treasury yields has come from the “real rate,” which has collapsed to a mere 0.55%. The bond market is thus looking the stock market straight in the eye and saying “this rough patch in the economy and recession in corporate profits ain’t no one-quarter wonder.”
The President has sought to pick a fight with Jay Powell by nominating his long-time supporter Stephen Moore to the Fed as Governor. If this happens, one can expect dissension to rise at the Central Bank. Moore is such a hypocrite that he penned a paper in 2014 criticizing the Fed for its QE largesse and for not raising rates – and now he’s been openly insulting to Jay Powell (going so far as to call for his resignation) for doing what Moore was clamoring for a half-decade ago. One more step towards trying to politicize the institution. (A strong case here for gold.)
In addition to the uncertainty now at the Fed – Neel Kashkari is not being shy that a policy misstep has been made as he second-guesses even his 2.5% estimate of the “neutral” funds rate. We have a fiscal situation in the USA that also is destabilizing and clearly crowding out private investment. In Feburary, the budget deficit hit a record $234 billion, which is pure insanity (up 9% from a year ago). In all of 2006, the gap was $248 billion. In 2007, the peak of growth in the last cycle, the annual deficit was $161 billion – lower than the past month. When I started in the business in 1987, the annual deficit that year was $150 billion. Now, we do more than that in just one month. And, this level of debt-laden government intervention in the economy is really worth of a forward P/E mulitple that up until recently was pressing against 16x?
The flat-to-inverted yield curve is killing the banks. The S&P 500 Financials were crushed 5% last week; the regional banks were down 9.4%. The KBW Nasdaq Bank Index suffered its biggest one-week loss since 2016.
The Atlanta Fed is down close to zero percent on Q1 growth and the NY Fed sees the first half of the year at 1.4%, or half of the 2018 pace.
He had multiple more points in his “must read” daily missive, but you get the idea.
Nonetheless, we are still told to disregard the warnings because this “time is different.”
“‘Historically the inversion of the yield curve has been a good [sign] of economic downturns [but] this time it may not,’ because the normal market signals have been distorted by, ‘regulatory changes and quantitative easing in other jurisdictions…everything we see in terms of the near-term outlook for the economy is quite strong.’” – Former U.S. Fed Chair Ben Bernanke, July 2018
“I think that there are good reasons to think that the relationship between the slope of the yield curve and the business cycle may have changed…the fact the term premium is so low and the yield curve is generally flatter is an important factor to consider.” – Former U.S. Fed Chair Janet Yellen’s final press conference, December 2017
Of course, given the track record of the Fed, maybe you should think differently.
With valuations at 30x trailing 10-year earnings, the risk to capital is quite substantial. As Larry Berman recently discussed for BNN Bloomberg:
“The P\E in a recession trough is probably between 11-13 times earnings. Earnings tend to fall about 15-20 per cent in an average recession. This one is probably worse than average largely due to the massive increase in leverage over the cycle suggest the downturn would be longer and deeper. If earnings fall by 30 per cent and the multiple is 11x, the S&P trough value is around 1,300. The optimistic scenario is a 15 per cent decline in earnings and a 13X multiple puts the S&P 500 around 1850. As an FYI, earnings fell by about 50 per cent in 2008-09 recession. Bottom line is a BIG Bear market for equities is likely and passive ETF portfolios will tend to disappoint.”
He is right. During “average” recessions stocks reprice forward expectations by 30% on average. However, given the massive extensions in markets over the last decade, Larry’s targets above suggest a 50% decline is possible.
Don’t Ignore The Warning
During the entirety of 2007, the trend of the data was deteriorating and the market had begun to struggle to advance. The signs were all there that “something had broken” but the “always bullish” mainstream media encouraged investors to simply ignore it as it “was different this time.” Unfortunately, by the time the annual data revisions had been released by the Bureau of Economic Analysis (BEA), it was far too late to matter.
Today, we are once again seeing many of the same early warnings. If you have been paying attention to the trend of the economic data, the stock market, and the yield curve, the warnings are becoming more pronounced.
In 2007, the market warned of a recession 14-months in advance of the recognition.
Today, you may not have as long as the economy is running at one-half the rate of growth.
However, there are three lessons to be learned from this analysis:
The economic “number” reported today will not be the samewhen it is revised in the future.
The trend and deviation of the data are far more important than the number itself.
“Record” highs and lowsare records for a reason as they denote historical turning points in the data.
We do know, with absolute certainty, this cycle will end.
“Economic cycles are only sustainable for as long as excesses are being built. The natural law of reversions, while they can be suspended by artificial interventions, cannot be repealed.”
Being optimistic about the economy and the markets currently is far more entertaining than doom and gloom. However, it is the honest assessment of the data, along with the underlying trends, which are useful in protecting one’s wealth longer-term.
The market, and the yield curve, are trying to tell you something very important.
via ZeroHedge News https://ift.tt/2JXwY4g Tyler Durden
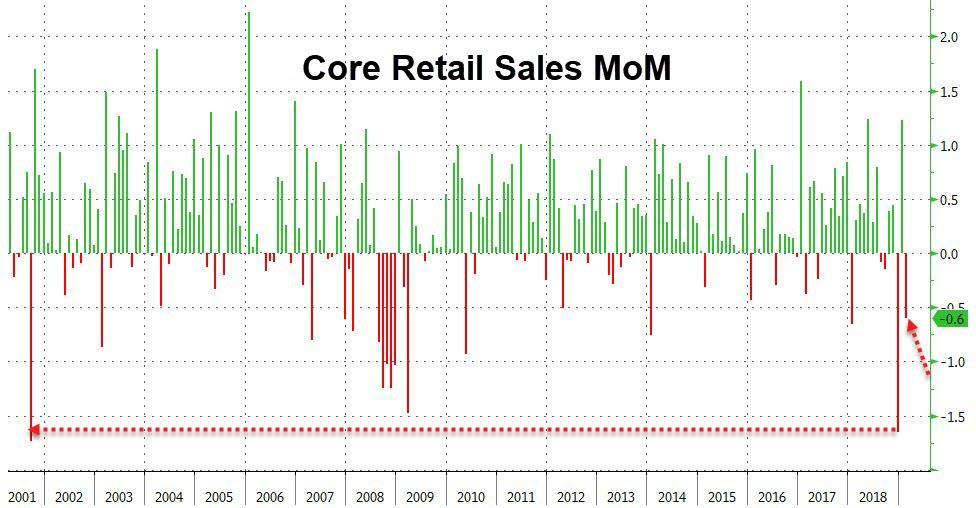
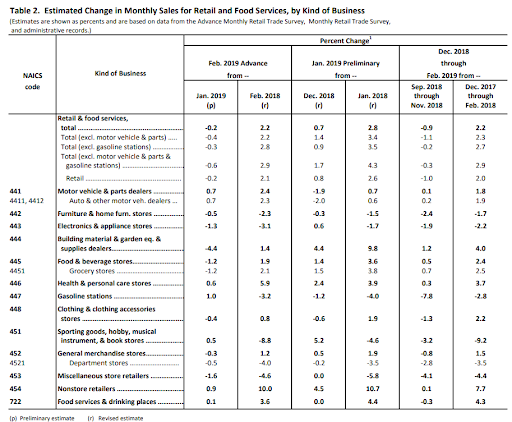
After January’s much-heralded rebounded from December’s “well it can’t be real” plunge, retail sales were expected to continue the rebound in February (albeit at a slower pace) but they did not – disappointing gravely.
Against expectations of a 0.2% rise, headline retail sales dropped 0.2% MoM in February (exaggerated by strong upward revisions) and core retail sales (ex-auto and gas) tumbled 0.6% MoM…
Sales in the “control group” subset, which some analysts view as a cleaner gauge of underlying consumer demand, also fell 0.2%, missing estimates for a gain, after an upwardly revised 1.7% increase in the prior month. The measure excludes food services, car dealers, building-materials stores and gasoline stations.
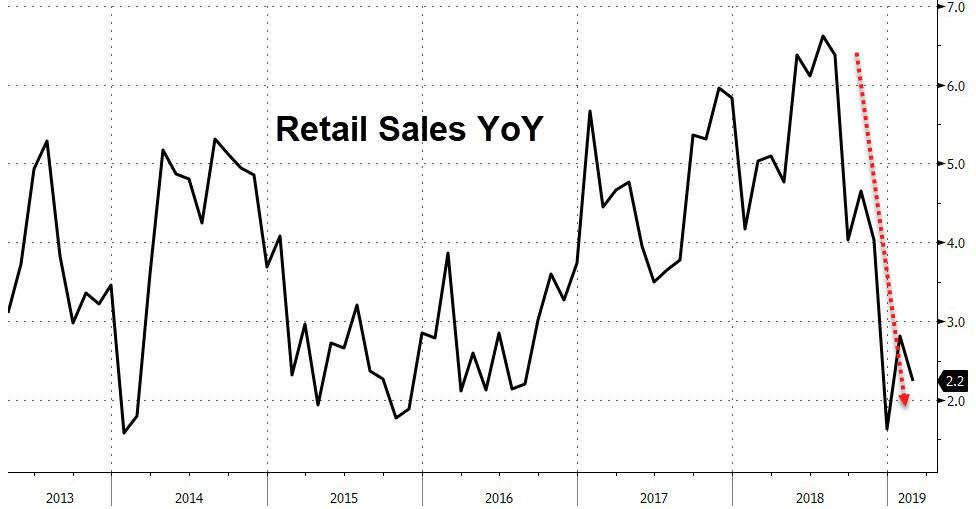
On a year-over-year basis, retail sales growth slowed to +2.2%…
Seven of 13 major retail categories showed declines…
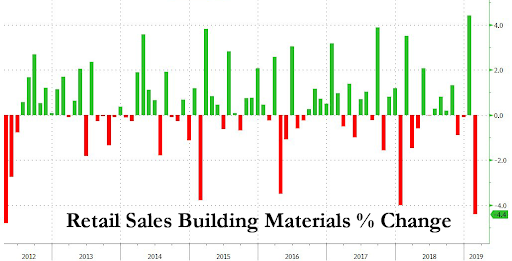
Led by Building Materials & Garden Equipment plunging 4.4% – the biggest drop since 2012… (additionally, receipts at electronics and appliance stores fell 1.3 percent, the most since May 2017).
As Bloomberg notes, the report suggests consumer spending will be limited as a growth driver in the first quarter, with pressure points also including smaller-than-expected tax refunds and global economic weakness that may be weighing on jobs. At the same time, rising wages, a stock-market rally and steady interest rates are likely to be pillars for consumption in coming months.
But, but, but… White House chief economic adviser Larry Kudlow said Friday that the “underlying economy” isn’t slowing.
via ZeroHedge News https://ift.tt/2FRusJ3 Tyler Durden
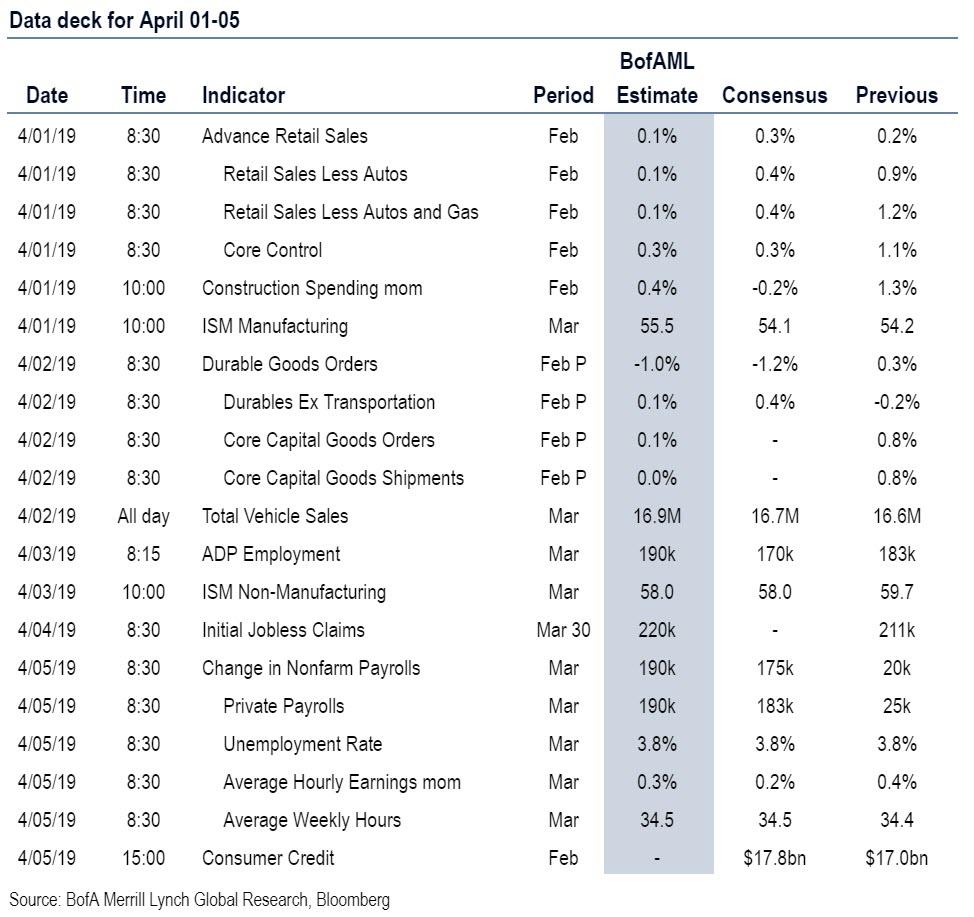
As we start Q2, this week will contain a barrage of key events for markets.
As DB’s Craig Nicol writes in his weekly preview, politics will remain on the agenda, both with the latest trade talks between the US and China, as well as any further Brexit developments. Looking at upcoming data releases, PMIs at the start of the week are already setting the agenda, while March’s US jobs report will also be a highlight, along with the Eurozone’s CPI inflation reading. From central banks, there’ll be decisions from the Reserve Bank of Australia and the Reserve Bank of India, while we’ll also get the minutes from March’s ECB meeting.
Aside from the interminable Brexit fiasco, there are a number of critical data highlights this week. Monday’s manufacturing PMIs for March can be expected to set the agenda, with readings from the UK, Italy, South Korea, Indonesia, China, and Canada all coming out, along with final readings from Japan, the Eurozone, France, Germany and the US. On Wednesday, we’ll then get the services and composite PMIs from a number of countries as well, including China, Japan, Italy and the UK and the final readings for the Eurozone, France, Germany and the US.
The other main highlight will be Friday’s US jobs report. In February, nonfarm payrolls rose by just 20k, the smallest increase since September 2017, but the consensus expectation is that employment growth will bounce back in March to show a 175k increase. Another reading to watch will be average hourly earnings, which last month reached 3.4% yoy, the highest since April 2009.
Looking at other US data of note, Monday will see February’s retail sales figures, where consensus expectations are for a 0.3% mom increase, as well as the ISM Manufacturing PMI, which in February recorded its lowest reading since November 2016. We’ll also get durable goods orders on Tuesday, while on Wednesday the ADP Employment reading will be released.
From Europe, there are a number of releases on Monday, with March’s CPI inflation and core CPI readings for the Eurozone out (HICP 1.4%, below the 1.5% expected), along with February’s Eurozone unemployment rate (in line with expectations at 7.8%). The consensus expectation is for the unemployment rate to remain at 7.8%, which is the joint lowest reading since October 2008. We’ll also get the Eurozone’s February retail sales data on Wednesday, where the consensus expectation is for a 0.1% mom increase, and on Friday we’ll get German industrial production figures for February, where the consensus expectation is for a 0.5% mom increase.
Turning to central banks, we’ll get the latest decision from the Reserve Bank of Australia on Tuesday, where the consensus expectation is that interest rates will remain unchanged, while on Thursday, the Reserve Bank of India will be announcing their latest decision, where the consensus is anticipating a 25bp reduction in the repurchase rate. On Thursday, we’ll also get the ECB’s account of their March meeting. In terms of speakers, from the Federal Reserve we have Bostic and Kashkari speaking on Wednesday, Mester on Thursday, and Bostic again on Friday. Elsewhere, on Monday the Bank of Canada’s Governor Poloz will be speaking.
In terms of other political developments, following this week’s trade talks in Beijing, Chinese Vice Premier Liu He will be visiting Washington on Wednesday for further discussions. Looking at other events, besides this weekend’s Turkish muni election and Ukraine’s presidential election, an Arab League summit will be taking place in Tunis, while New Zealand’s Prime Minister, Jacinda Ardern, will be visiting Beijing for talks with Chinese President Xi Jinping. In addition, NATO foreign ministers will gather for meetings in Washington on Wednesday and Thursday, and on Thursday the Kenyan President, Uhuru Kenyatta, will be delivering his State of the Nation address to Parliament.
Summary of key events in the week ahead courtesy of DB:
Monday: It’s a busy start to the week with the key highlight being the release of March manufacturing PMIs in Japan, China, Spain, Italy, France, Germany, Euro-area, the UK and the US. Other important data highlights are the release of the Q1 Tankan quarterly manufacturing survey results in Japan, the February unemployment rate and March CPI reading in the Eurozone, along with the release of January business inventories, February retail sales and construction spending, and March’s ISM manufacturing all in the US. Bank of Canada Governor Poloz will also be speaking.
Tuesday: It’s a light day for data with releases of note being February’s construction PMI in the UK and February PPI in the Eurozone, along with the release of preliminary February capital goods and durable goods data, and March vehicle sales in the US. The Reserve Bank of Australia will also announce their latest rate decision.
Wednesday: Again it’s a busy day for data with the key highlight being the release of the services and composite PMIs in Japan, China, Spain, Italy, France, Germany, Euro-area, the UK and the US. Beside that, we will be also getting March’s BRC shop price index and official reserves data in the UK, Q4’s budget deficit to GDP in Italy and February retail sales in the Eurozone. In the US, we will get the latest weekly MBA mortgage applications, March’s ADP employment change and March’s ISM non-manufacturing index. Aside from the data, the Fed’s Bostic and Kashkari are due to speak, while Chinese Vice Premier Liu He will be visiting Washington for further trade discussions.
Thursday: The only data releases of note for the day are Germany’s February factory orders and March’s construction PMI along with the release of March’s Challenger job cuts and the latest weekly initial and continuing claims in the US. Turning to central banks, we’ll get the latest decision from the Reserve Bank of India, the ECB minutes from their March meeting will be released, and the Fed’s Mester is due to speak.
Friday: It’s a payrolls Friday with the key release being the March non-farm payrolls data in the US. In terms of other data releases, we will get Japan’s February household spending and real cash earnings data, Germany’s February industrial production, the UK’s Q4 unit labour costs and February consumer credit data in the US. In terms of central bank speakers, the Fed’s Bostic is due to speak.
Looking at the US alone, Goldman notes that the key economic data release this week are the retail sales and ISM manufacturing reports on Monday and the employment report on Friday. There are several scheduled speaking engagements by Fed officials this week.
Monday, April 1
08:30 AM Retail sales, February (GS +0.1%, consensus +0.3%, last +0.2%); Retail sales ex-auto, February (GS +0.2%, consensus +0.3%, last +0.9%); Retail sales ex-auto & gas, February (GS +0.1%, consensus +0.3%, +1.2%); Core retail sales, February (GS +0.1%, consensus +0.3%, last +1.1%): We estimate that core retail sales (ex-autos, gasoline, and building materials) rose at a modest pace in February (+0.1% mom sa), reflecting delays in tax refunds. We estimate a 0.1% increase in the headline measure, reflecting a modest decline in auto sales but a rebound in gasoline prices.
09:45 AM Markit Flash US manufacturing PMI, March final (consensus 52.5, last 52.5)
10:00 AM ISM manufacturing index, March (GS 54.0, consensus 54.4, last 54.2): Our manufacturing survey tracker — which is scaled to the ISM index — remained unchanged at 54.9, reflecting mixed manufacturing surveys in March. Following a 2.4pt decline in February, we expect the ISM manufacturing index to edge down by 0.2pt to 54.0 in March.
10:00 AM Construction spending, February (GS +0.1%, consensus -0.2%, last +1.3%): We estimate construction spending moderated in February following the previous month’s gain, with scope for a modest rise in private residential construction but a decline in public construction.
10:00 AM Business inventories, January (consensus +0.4%, last +0.6%)
Tuesday, April 2
08:30 AM Durable goods orders, February preliminary (GS -1.5%, consensus -1.2%, last +0.3%); Durable goods orders ex-transportation, February preliminary (GS +0.1%, consensus +0.3%, last -0.2%); Core capital goods orders, February preliminary (GS -0.1%, consensus +0.3%, last +0.8%); Core capital goods shipments, February preliminary (GS -0.1%, consensus flat, last +0.8%): We expect durable goods orders to decrease by 1.5% in the preliminary February report. We estimate core capex orders (-0.1%) and shipments (-0.1%) both declined due to weak global manufacturing trends and possible drag from timing of Chinese New Year.
5:00 PM Lightweight Motor Vehicle Sales, March (GS 16.7m, consensus 16.7m, last 16.6m)
Wednesday, April 3
08:15 AM ADP employment report, March (GS +175k, consensus +180k, last +183k): We expect ADP payroll employment growth slowed to 175k, as weak prior month payrolls likely offset the stronger recent jobless claims data. While we believe the ADP employment report holds limited value for forecasting the BLS nonfarm payrolls report, we find that large ADP surprises vs. consensus forecasts are directionally correlated with nonfarm payroll surprises.
08:30 AM Atlanta Fed President Bostic (FOMC non-voter) speaks: Atlanta Fed President Raphael Bostic will speak on an American Banker Association panel.
10:00 AM ISM non-manufacturing index, March (GS 58.5, consensus 58.0, last 59.7): Our non-manufacturing survey tracker declined by 1.2pt to 55.5 in March, following mixed-to-weaker regional service sector surveys. We expect the ISM non-manufacturing index to lower by 1.2pt to 58.5 in the March report.
05:00 PM Minneapolis Fed President Kashkari (FOMC non-voter) speaks: Minneapolis Fed President Neel Kashkari will speak in North Dakota. Audience Q&A is expected.
Thursday, April 4
08:30 AM Initial jobless claims, week ended March 30 (GS 215k, consensus 216k, last 211k); Continuing jobless claims, week ended March 23 (last 1,756k): We estimate jobless claims declined by 4k to 215k in the week ended March 30. The claims reports of recent weeks suggest that the pace of layoffs remains low, though it probably remains somewhat higher than in early fall.
01:00 PM Cleveland Fed President Mester (FOMC non-voter) speaks: Cleveland Fed President Loretta Mester will speak in Ohio. Prepared text and audience Q&A are expected.
01:00 PM 6:00 AM Philadelphia Fed President Harker (FOMC non-voter) speaks: Philadelphia Fed President Patrick Harker will discuss the economic outlook in Philadelphia. Prepared text and audience Q&A are expected.
Friday, April 5
08:30 AM Nonfarm payroll employment, March (GS +190k, consensus +175k, last +20k); Private payroll employment, March (GS +185k, consensus +178k, last +25k); Average hourly earnings (mom), March (GS +0.3%, consensus +0.3%, last +0.4%); Average hourly earnings (yoy), March (GS +3.3%, consensus +3.4%, last +3.4%); Unemployment rate, March (GS 3.8%, consensus 3.8%, last 3.8%): We estimate nonfarm payrolls increased 190k in March, which would represent a sharp pickup following the 20k rise in February. Our forecast reflects a boost from weather of around 20k, reflecting a swing from above-average to below-average snowfall during the payroll reference weeks. While we believe trend job growth has slowed from its +223k average monthly pace in 2018, renewed declines in jobless claims and the resilience in employment components of business surveys suggest that the underlying pace remains above-potential. We estimate the unemployment rate was unchanged at 3.8%. While continuing claims have declined somewhat, we believe this in part reflects the reversal of residual seasonality effects that boosted claims in the first two months of the year. Finally, we estimate average hourly earnings increased at a firm pace of 0.3% month-over-month that nonetheless takes the year-over-year rate down a tenth to +3.3%.
03:30 PM Atlanta Fed President Bostic (FOMC non-voter) speaks: Atlanta Fed President Raphael Bostic will speak on disruption and opportunity in Atlanta. Audience Q&A is expected.
Source: Deutsche Bank, BofA, Goldman
via ZeroHedge News https://ift.tt/2FNA99k Tyler Durden
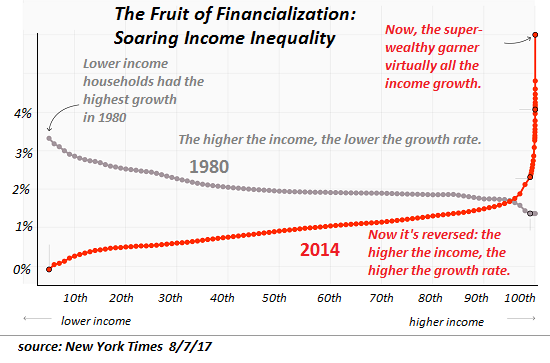
Those who own stocks and housing now will continue getting richer, those who don’t will be priced out of these markets.
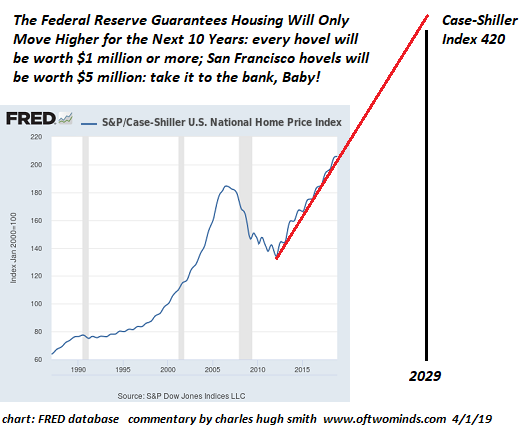
A classified Federal Reserve memo sheds new light on the Fed’s confidence in its control of the economy and the stock and housing markets. In effect, the Fed is guaranteeing that there will be no recession for another 10 years, and that stocks and housing will remain in a permanent uptrend.
Paraphrasing the memo, we have the tools to insure that stocks and housing do not just remain at a permanently high plateau but continue to move higher in a permanent uptrend.
I’ve marked up a chart of the S&P 500 and the Case-Shiller Housing Index to illustrate the Fed guarantee. As you can see, stocks and housing will at a minimum double in the 2019-2029 period, and could do much better.
The Fed memo refers to the enormous success of the Fed’s dovish about-face since December: (again, paraphrasing the memo): The Federal Reserve’s management of policies and market expectations since December prove that we can reverse any downturn and reignite expansion of stock and housing valuations at will. We can thus guarantee a permanent expansion of stock and housing valuations into the indefinite future.
The memo also notes that there are many policy extremes such as negative interest rate policy (NIRP) that the Fed holds in reserve. In other words, the toolbox is full of shiny new tools the Fed hasn’t even used yet. This is one reason for the memo’s supreme confidence: there is no slowdown or downturn that the Fed can’t reverse within a few weeks via policy tweaks and perception management via public pronouncements and PR campaigns.
So as the charts illustrate, owners of stocks and houses can take the Fed guarantee to the bank: huge permanent gains in collateral and capital are in the bag, Baby, because “the Fed has our back big-time”:
There is one fly in the ointment the memo mentions: the Fed is powerless to push wages and earned income higher along with stocks and housing. So while stocks and housing soar to the moon, wages will continue stagnating or losing ground as rising prices for healthcare, rent, childcare, college tuition, etc., continue chipping away at the purchasing power of earned income.
Those who own stocks and housing now will continue getting richer, those who don’t will be priced out of these markets. In other words, the Fed’s policy of making the rich richer and the Devil take the hindmost is permanent…
Until a political and social Cultural Revolution sweeps away the Fed and the rest of the parasitic ruling elites.
This is an April Fool’s Day whimsy. But how far it is from what the Fed elites actually believe is unknown.
Ethiopian Airlines is holding a media event Monday to share the preliminary findings of its investigation into what caused ET302 to plunge out of the sky and crash in a field outside Addis Ababa just minutes after takeoff, killing all 157 people on board. Leaked details from the investigation, and comments from the airline’s CEO, suggest that widely held suspicions appear to have been confirmed: Boeing’s MCAS anti-stall software, which was designed to stop the Boeing 737 MAX 8 from stalling during its post-takeoff ascent, had been accidentally triggered, forcing the plane’s nose to dip uncontrollably.
Since the March 10 crash, which triggered airlines and governments around the world to ground the planes pending the results of the investigation, details about what appear to be shortcuts taken by Boeing to win approval for the planes from the FAA have emerged. Boeing has been accused of “regulatory capture”, Boeing has submitted a revision of MCAS to the FAA, which is pending approval. The aerospace company had started redesigning the software after the Oct. 29 crash of a 737 owned by Indonesia’s Lion Air, which happened under similar circumstances to ET302, triggering speculation that they both might have been caused by MCAS. An investigation into the Lion Air crash appeared to show the software had malfunctioned.
Boeing is also suspected of not doing enough to familiarize pilots at non-US airlines with the workings of MCAS, specifically how to disable it if it should automatically trigger.
According to the latest round of leaks, investigators had determined that the software had accidentally activated, and were searching for a piece of equipment that might explain why. Data from the flight’s “black box” determined that the software had been pushing the plane’s nose down at the time of the crash.
Regardless of the preliminary findings, Boeing is facing the difficult task of convincing regulators and airlines around the world, who, in an unprecedented move, broke with the FAA and grounded the planes after the American regulator declared that they were “safe.” Boeing must also convince a wary public, which likely won’t grasp complex software updates.
Meanwhile, following the first multibillion-dollar order cancellation last month, Boeing is scrambling to convince airlines not to back out of their orders for the 737, Boeing’s “workhorse” jet that’s expected to be its best-selling plane yet.
via ZeroHedge News https://ift.tt/2Umoisb Tyler Durden


 A new sort of sex scare is taking hold. This time—after decades of folks freaking out over the opposite—it’s young people abstaining from sex that has the youth-panic pundits and other chattering-class types fretting.


