Submitted by Eric Peters of One River Asset Management
“How would you like a new 4 Sharpe strategy?” asked the salesman. “Tell me more,” replied the portfolio manager. “You buy a swap from us that will continually sell weekly S&P 500 variance, but instead of that variance being measured based on the daily price change, it measures volatility multiple times each day.” Well that’s new. “Who’s buying this stuff?” asked the portfolio manager. “Everyone’s buying,” said the salesman. Just when you think we’d run out of innovative ways to profit from nothing happening, along comes something else.
“If everyone is selling intraday variance, I think I’d rather buy it,” said the portfolio manager. “Oh, well, that’s great! With so many people selling, our trading desk is way too long. So we’re looking for ways to recycle this risk,” said the salesman. As people buy these variance swaps, and therefore sell intraday volatility, the issuing banks get long volatility. To hedge the risk, they sell intraday rallies, buy dips. Which dampens volatility. And their clients are all happy, unless of course there’s a flash crash. Or through an act of god, an overnight gap.
Math Nerds:
“The consensus was to be long dispersion,” said the trader, returning from an idea dinner. “It’s the trade that has profited from idiosyncratic stock movements for the past year even if the S&P 500 index has been flattish.” Long dispersion is a bet that the difference between the best and worst performing stocks will be wide. That’s the opposite of short correlation. Long correlation is a bet that all stocks move up and down in unison. “And the classic is that people now talk about long dispersion (short correlation) as a hedge against a flattish S&P 500.”
When Tides Turn:
“They are punishing our country for the neoliberal policies applied in the last 36yrs, which were a complete failure, especially in the last few years,” said Mexico’s President AMLO, the rating agencies cutting their outlooks to negative. “We had nothing to do with the government then, but we have to pay the consequences,” he continued, vowing to hold a referendum on whether past presidents should be put on trial for the neoliberal policies he says hollowed out state companies, allowed corruption to spiral and provoked deep social inequality.
Wait, What?
British insurer Legal & General profits jumped as annuity sales soared and changes to life expectancy boosted its bottom line. The rate of improvement in life expectancy slowed dramatically, as people die earlier than expected, allowing insurers to release reserves they hold to pay future pensions.
The CEO hinted there could be more to come as the company continues to adjust assumptions about how long customers might live. “There’s been a long discussion about whether this is a blip or a trend, and sadly it’s looking like a trend,” he said.
via ZeroHedge News https://ift.tt/2JlxkkU Tyler Durden
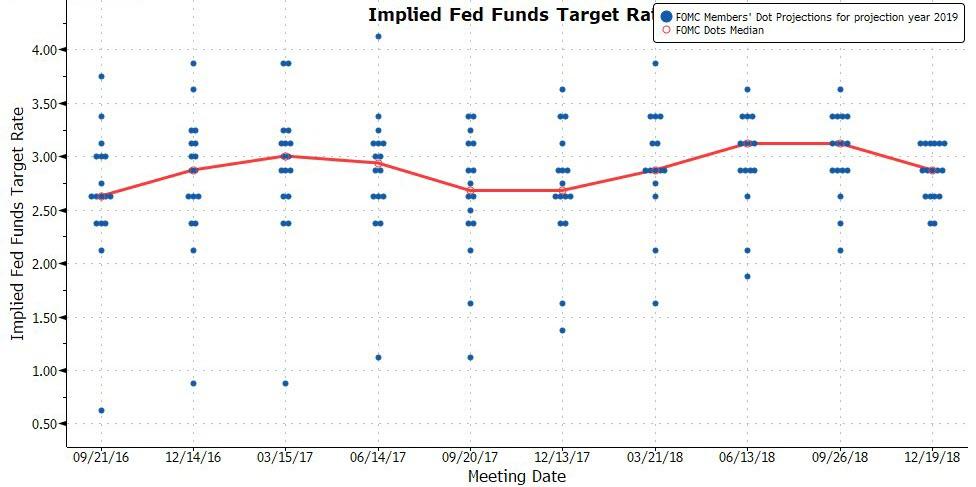
The Fed’s March 19-20 two day meeting will be to most FOMC member a crash course in humility.
Back in December, when Powell infamously stated that the Fed’s balance sheet unwind is on “autopilot”, a statement the Fed Chair promptly came to regret just a few days later when the S&P briefly tripped into a bear market before staging a historic rebound after Powell reversed dovishly on every possibly occasion, the Fed indicated in its Summary of Economic Projections that the US economy is growing at a solid pace, with GDP expected to reach 2.3% in 2019 as the unemployment rate tumbled to 3.5% even as 2019 Core inflation remained subdued at just 2.0%, a drop from the 2.1% projected at the prior, September, SEP forecast.
But more importantly, the Fed also revealed that it expects at least 2 more rate hikes in 2019 (down from 3 in September), which would see the Fed Funds rise to 3.1% in Dec. 2019, and another rate hike in 2020 bringing the US rate to 3.1% at which point it would peak before drifting lower to its longer-run rate of 2.8%.
Needless to say, within the SEP – which a recent study found had been more often wrong than right – it is the Fed’s dot plot that is under the microscope. As Bank of America says, “the dots are loved by some but are hated by many.” As the latest FOMC minutes showed, there are even some Fed officials on the Committee who would like to see an overhaul of the exercise, noting that they were “concerned that, although the individual participants’ projections for the federal funds rate in the SEP reflect their individual views of the appropriate path for the policy rate conditional on the evolution of the economic outlook, at times the public had misinterpreted the median or central tendency of those projections as representing the consensus view of the Committee or as suggesting that policy was on a preset course.“
In a February Bloomberg op-ed, Mohamed El-Erian made the case to eliminate the dots, when Bill Gross’ former partner suggested the Fed could consider following the template of the Bank of England’s “Inflation Report,” which releases a complete staff assessment of monetary policy conditions with fan charts rather than point estimates. This gives more detail about the Fed’s reaction function and takes out the perceived precision of the dots.
In retrospect, following the huge hit to the Fed’s credibility that Powell’s 180 degree reversal in the past three months created, it would certainly be convenient to make the dots more conditional and scenario-based at this point in the cycle. As Mester noted, the Fed has returned to “normal” monetary policymaking, which means the outlook will be more conditional on the outlook and less programmatic.
However, as BofA warns, removing the dots at this point would be helpful in the near term, but hurtful in the long run. When the time comes to cut rates again, the Fed is likely to return the ZLB quickly. The dots will then become a critical tool for the Fed who will otherwise have limited ammunition. It is possible the Fed could stash the dots away during good times and reintroduce them in downturns, but that only adds to the Fed’s credibility challenges. Moreover, such a move would need consensus within the FOMC and many still see benefits in releasing the dots.
Whatever the ultimate fate of the “dots”, they will be with us for a while, and they will present a major challenge at the upcoming 19-20 March FOMC meeting for one reason: Fed officials have been communicating that they will be on hold for some time and are largely unwilling to send a signal about the timing of the next hike. This makes the dots – as they currently stand, predicting 3 more rate hikes by the end of 2020 – quite problematic, especially if as JPMorgan recently suggested, the Fed may go so far as to eliminate all hints of rate hikes in 2019.
Which brins us to the topic of this post: the humiliation of the “smartest people in the room” they had no idea what was going on as recently as 3 months ago. Worse, the “smartest people in the room” will now have to drastically revise their projections lower to justify the drop in the dots, without spooking the market that i) a rate cut is imminent and ii) the US economy is far weaker than most expected.
How will this happen?
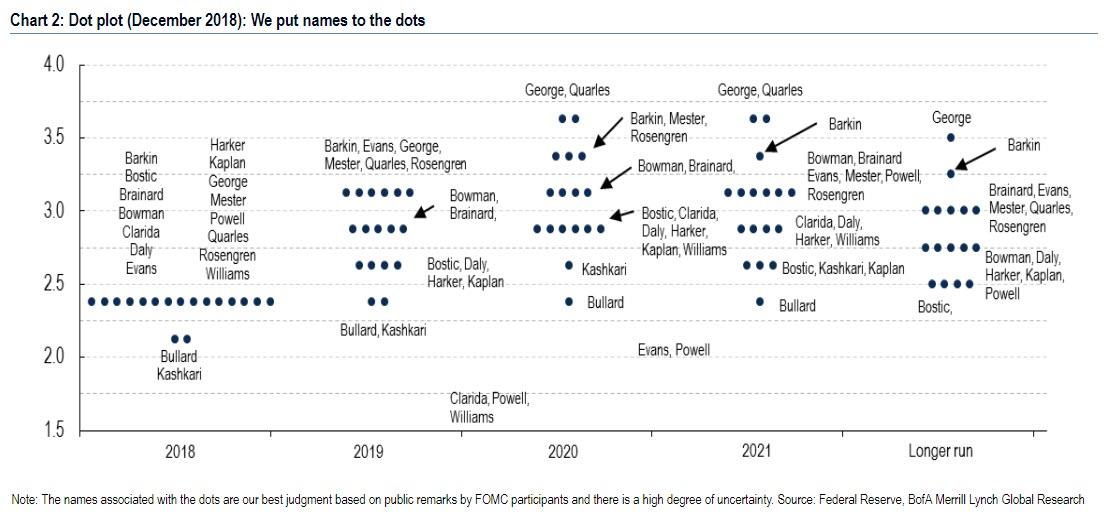
Looking at the distribution of the dots, only three FOMC officials would need to shift from two hikes this year to one hike to move the median to one hike for 2019. That’s the easy part; the difficult part is that no less than seven officials would need to move to get the median to zero for this year which – as BofA concedes – is a “much harder case to make”, especially without sparking fresh recession fears. According to BofA’s “dot exercise” the “core” members of the FOMC were likely forecasting two hikes for this year in December (Bowman, Brainard, Clarida, Powell, and Williams). Based on speeches since then, it appears these Fed officials are all at risk of revising down their outlook for the path of policy. Other Fed officials we pegged at three hikes in 2019 (eg, Evans) could also make the move down to one hike.
As to how the Fed’s adjust to telegraph no rate hikes at all in 2019 by dragging the median dot not one but two notches lower, all bets are off how the various FOMC members will do that without the Fed suffering dramatic “reputational” damage.
In summary, while it is important to pay attention to the wide range of voices on the FOMC, in Bank of America’s view the most important remains the trifecta of Powell, Clarida and Williams. Recent comments from Williams and Clarida suggest they both may be in the no hike camp. Recently, vice chair Clarida noted on Wednesday that the Committee is very close to their employment and inflation goals and there are scenarios where they might not hike this year. Also, Williams suggested that the current inflation outlook is not sufficient to raise rates again this year.
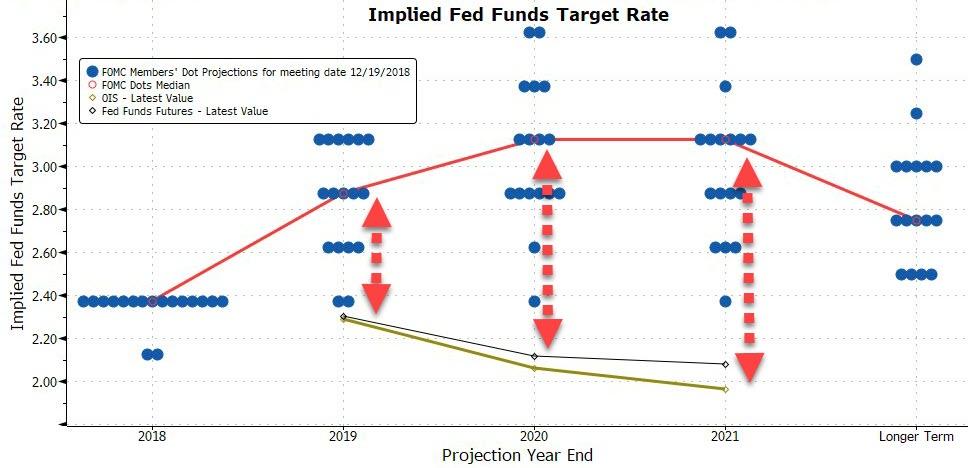
So once again the dots will be confusing.: while the median will likely still show hikes in the outlook (absent a shocking capitulation by most on the FOMC), the core of the committee, which holds the trifecta, will likely shift lower, perhaps removing all hikes for the year.
And just to make sure the humiliation is complete, keep in mind that the market now expects 1 rate cut in 2020 (whether that happens is a different matter as discussed earlier), so there is the distinct chance that the Fed’s capitulation may be even worse if, in order to give the market comfort, Powell & Co. somehow manage to hint at a rate cut in the coming year.
How will the market react, and whether all this dovishness (and more) has already been priced in, will be revealed at 2pm on Wednesday.
via ZeroHedge News https://ift.tt/2FiTQXC Tyler Durden
According to a recent Morgan Stanley report, linked HERE, the Millennials and Gen Z are about to provide a positive “youth jolt” to power the US economy higher, and “provide a rosier outlook for Social Security and Medicare“.
In Morgan Stanley’s own words;
“For the U.S. economy, the demographic tailwinds created by these high-population cohorts could be significant, delivering the kind of “youth jolt” that the Baby Boomers were famous for. However, according to a recent report from Morgan Stanley Research, the implications of these demographic shifts aren’t baked into current Congressional Budget Office forecasts, in particular, the projections for labor-force growth”.
“Work by the firm’s economic team, along with an in-depth survey of Generation Y and Z consumers, uncovered a significantly brighter outlook for the U.S. in the coming decades than previously thought. As Gens Y and Z combine in the workforce, these two outsized generations could power higher consumption, wages and housing demand, all pillars of GDP growth”.
“In addition, these new projections on labor-force growth could also mean a rosier outlook for Social Security and Medicare solvency, offering investors an overall bullish view for the U.S. between the 2020s and 2040s—and policymakers a different perspective on the road ahead.”
Before reading my rebuttal, I really encourage readers to read through Morgan Stanley’s Research.
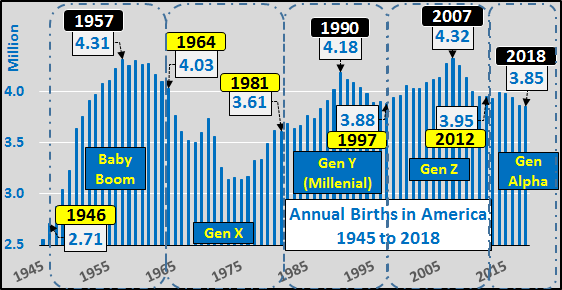
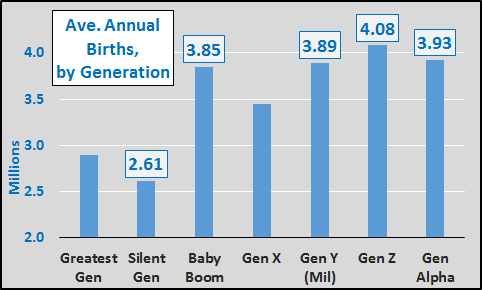
First, I really struggle with the whole generational labels as they represent uneven and ill-defined time periods. The chart below shows annual US births since 1945 plus generation callouts. Meh?!?
So, to put some sense to the generations, I simply summed the total births during each and divided them by the duration of each generation. Couple of big noteworthy points:
The Baby Boom represented a massive average increase of 1.6 million births annually over that of the previous Silent generation or a 66% uptick
Gen Y (Millennials) average annual births increased less than 42 thousand annually over the Baby Boom, a 1.1% increase
Gen Z average annual births were 230 thousand more than the Baby Boom, a 6% increase
Gen Alpha (now 6 years underway) average annual births have declined by 155 thousand (-4%) compared to Gen Z
Due to tanking fertility rates, a significantly larger total population (inclusive of rising numbers of legal/illegal immigrants) has essentially had no more children than during the Baby Boom.
Average annual births by decade seems a whole lot simpler (charted below). Far simpler to gauge the incoming population (those aged 20-29 born from 1990 to 1999) versus the outgoing population (those aged 60-69 born from 1950 to 1959). As the dashed boxes below highlight, on a decade by decade comp basis, the incoming ’90-’99 period represents fewer persons than did the outgoing ’50-’59 period. The days of easy population driven comps and rising population driven demand are behind us (aka, the demographic tailwind has ended).
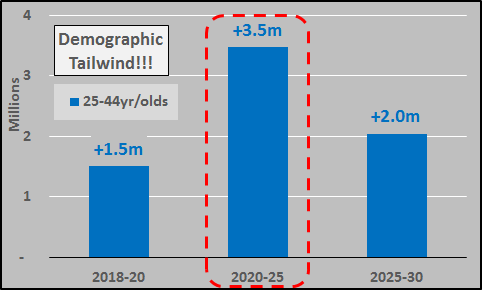
But looking at the total picture, the oft cited bright spot is the 25 to 44 year old population growth, according to the 2017 Census Projection. The chart below highlights that 25 to 44 year olds will jump in the coming five year period.
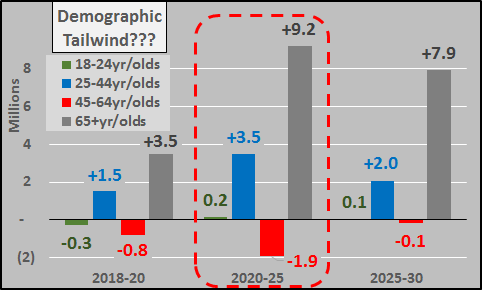
What if we widen the lens to see the entire adult population? The wider Census view details essentially zero growth among the 18 to 24 year olds (green columns), large declines among the 45-64 year olds (red columns), and a gargantuan and unprecedented rise in the 65+ year old population (grey columns).
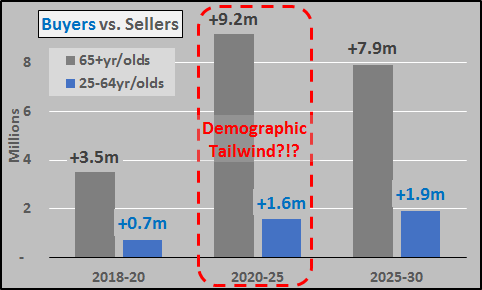
The chart below is a simple picture of the change per five year periods of potential buyers (25 to 64 year olds) versus potential sellers (65+ year olds). From 2020 to 2025, will see more than a 5 to 1 ratio of growth among the potential sellers versus potential buyers…a complete reversal of the 1 to 5 ratio of potential sellers to potential buyers of the previous 50 years.
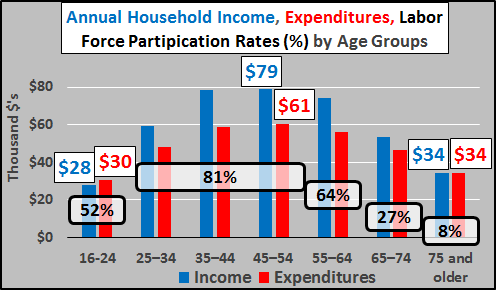
The chart below highlights the average earning, spending, and labor force participation differentials of the demographic segments. On average, 75+ year olds earn and spend half of what the peak age groups do…and have just an 8% labor force participation rate compared to the 80% of the peak age groups.
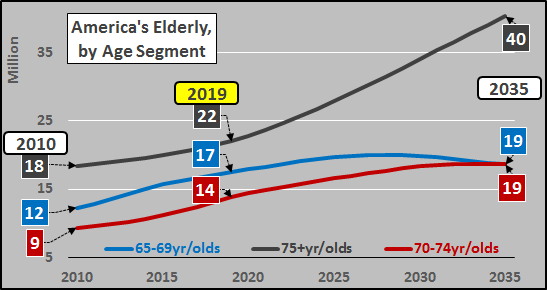
I mention this because the 75+ year old population will be the driver of US population growth for decades, as the chart below details.
There are an awful lot of analysts very well paid not to mention this mismatch.
What of Those Incoming Young Adults?
70% of college graduates, over 44 million Americans, hold significant student loan debt. In total, over $1.5 trillion is owed and the average graduate has $37 thousand in debt. Thanks to a recent report by Federal Reserve Bank of St. Louis (HERE), “in terms of wealth accumulation, college is not paying off for recent college graduates on average–at least, not yet”. In particular, “Disturbingly, the wealth benefits of college and post-graduate degrees was much lower among non-white family heads…born in and after the 1980’s”. This seems to imply and agree with my recent article (HERE) that wealth creation of the last decade via ZIRP, QE, etc. is a matter of asset inflation for the have’s (primarily white) rather than a meritocracy for the have-nots.
Thus the surging $166+ billion in record 90 day+ student loan delinquencies detail that recent graduate income levels are not high enough for debt repayment, let alone house hunting. Add to this marriages continuing to be delayed (median males now waiting to 30, females until 28) and record low total fertility rates (1.72 in 2018, down from 2.12 in 2007)…and annual household creation continues to undershoot expectations.
Concluding Thoughts:
Given mortgage rates still have little room to move lower, the mismatch of elderly potential sellers versus younger potential buyers, and the student loan hindered young adults choosing to delay marriage and have significantly fewer children…I’m of a mind housing (anywhere near current prices) is oversupplied and a variant of 2008’s housing crisis is more likely than not. The US economy is not about to be positively “jolted”. But then again, I’m just a blogger with no research team, nothing to sell, and no book to talk. This is America, so when in doubt, just pick the source with the happy story that suits you best.
via ZeroHedge News https://ift.tt/2UFyol1 Tyler Durden
Paris awoke on Sunday to smouldering fires, broken windows and looted stores following the 18th consecutive Saturday of Yellow Vest protests.
Around 200 people were arrested according to BFM TV, while about 80 shops near the iconic Champs Elysees had been damaged and/or looted according to AFP, citing Champs Elysees committee president Jean-Noel Reinhardt.
The 373-year-old Saint Sulpice Roman Catholic church was set on fire while people were inside, however nobody was injured. The cause of the fire remains unknown.
The riots were so severe that French President Emmanuel Macron cut short a vacation at the La Mongie ski resort in the Hautes-Pyrénées following a three-day tour of East Africa which took him to Djibouti, Ethiopia and Kenya.
Macron skied on Friday, telling La Depeche du Midi “I’m going to spend two-three days here to relax, to find landscapes and friendly faces,” adding “I’m happy to see the Pyrenees like that, radiant, although I know it was more difficult at Christmas” referring to the lack of snow in December.
In response to Saturday’s violence, Macron said over Twitter that “strong decisions” were coming to prevent more violence.
Macron said some individuals — dubbed “black blocs” by French police forces — were taking advantage of the protests by the Yellow Vest grassroots movement to “damage the Republic, to break, to destroy.” Prime Minister Edouard Philippe said on Twitter that those who excused or encouraged such violence were complicit in it. –Bloomberg
The French President has family ties in the Hautes-Pyrénées, including Bagnères de Bigorre where his grandmother lived. He is a regular visitor to the region.
Emmanuel Macron (2ndL), head of the political movement In Marche! (Onwards!) And candidate for the 2017 presidential election, and his wife Brigitte Trogneux (L) have lunch April 12, 2017 (Reuters)
via ZeroHedge News https://ift.tt/2HzM2T0 Tyler Durden
Myself, at the local chocolatier’s establishment yesternight: “I’d like half a dozen thingamajigs, please.”
Retarded Minion of Stupidity employed by said chocolatier: “How many thingamajigs would you like?”
Myself: “Half a dozen, please.”
Retarded Minion, now looking thoroughly bumflustercated: “Um…how many would that be?”
Myself, thankful that Retarded Minion is juuuuuust barely beyond range of a polite roundhouse slap to the side of the head sufficient to loosen fillings: “That would be six thingamajigs, please.”
Retarded Minion, flooded with obvious relief at being freed from further mathemagical distress and consternation: “Ah!…Yes, six, got it.”
Gobsmacked: Not only an actual thing, but frequently also the solution to the problem.
Warning: Smarter than actual sales help. Hole in head optional.
The bill for the thingamajigs was then announced as $6.96, whereupon I handed her a $5 bill and two singles, and I swear for a moment it looked as if she was going to have to take off her shoes to count, and failing that ploy, be forced to use her lifeline to call the engineers at NASA to correctly calculate that she owed me 4¢ in change thereof.
Which is by way of noting that she was old enough to vote, and English-fluent, but that clearly second grade mathematics had completely kicked her ass, and she should be beaten with a stout rod until she could master the fundamentals of basic math.
That the common phrase “half a dozen” baffled the blistering fuck out of her suggests that the manager there is similarly a lackwit in urgent need of a new job in either the custodial maintenance or street-level recycling industries.
Retarded Minion’s (undoubtedly Common Core public education) teachers, to the last one, should be horsewhipped until their flesh is ripped off and the bones show, and then put up against a wall and shot.
Slowly, starting at the toes, and working up to more important parts.
Put in charge of the firing party, I should make them each count the rounds as they were fired.
I swear to Buddha, I’m going back there tomorrow, and if she’s still employed there, I’m going to pay her with $2 bills and $1 coins, just to watch her head explode against the walls.
And these sorts of fucktards are going to get $15/hr in a couple of years?
The economy will collapse. Civilization is doomed. You read it here first.
Ron White was wrong: I can fix this kind of stupid, but you’ve got to allow me to use a big enough hammer.
At any rate, a couple of more of these incidents, and I’m going to abandon all civility, and start going full-on As Good As It Gets on these morons, to reduce them to tears as a policy, and sport.
via ZeroHedge News https://ift.tt/2OdNYly Tyler Durden
The 2019 U-turn in the Fed’s monetary policy tightening cycle has contributed to one of the strongest declines in cross-asset vol in recent years. According to Bank of America’s Cross-Asset Hedging model, there has been a coordinated decrease in volatilities and credit spreads for two consecutive months, a phenomenon not seen since 2014. Separately, the fall in cross-asset vol is also the largest since Draghi’s July 2012 “do whatever it takes” comments. Indeed, as Goldman observed last week, the fall in S&P500 realized vol has been one of the largest since 1928.
This, to Bank of America, but really to anyone else, “is further evidence of the power central banks have in managing volatility in financial markets.”
However, as BofA’s Gonzalo Asis writes last week, what type of vol regime follows from here remains far from certain. After all, while a Fed pause has clearly been supportive of equity markets, the conditions that would drive the Fed to cut rates could be less positive for stocks especially since as we discussed recently, the last three recessions were all preceded by a rate cut three months prior. In fact, bond markets are already predicting the Fed will lower rates next year, including a 33% probability of a 25bp cut in Jan-20.
Assuming that is indeed the case, what does history tell us about the behavior of equity vol in the lead-up to a cut”
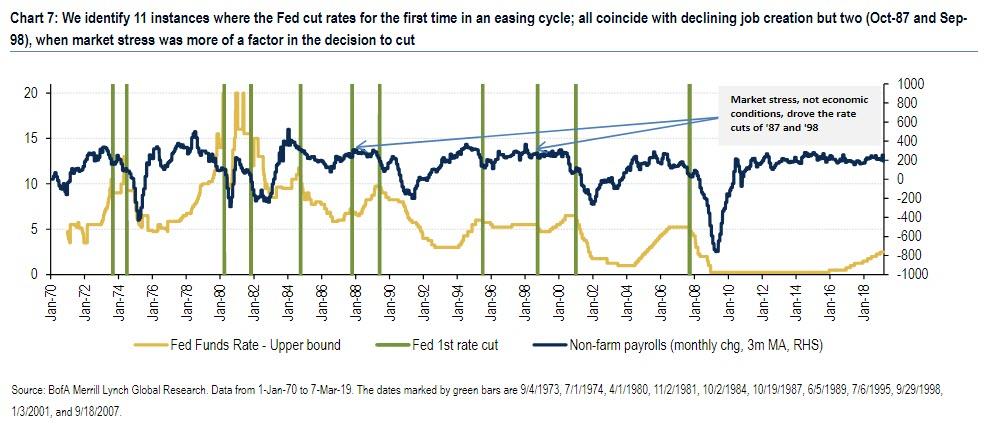
To answer this question, BofA looked at all major first cuts in Fed Funds since 1972. While changes in short-term rates serve as a good barometer of monetary policy, the means used by the Fed to pursue its mandate have varied over the years. For example, between 1979 and 1982, under Volcker’s leadership, the Fed used money supply as the main tool to tame inflation, letting short-term rates fluctuate more freely than in other periods. For those instances, BofA relied on historical archives to pinpoint dates of important changes in Fed policy. The chart below shows the resulting dates, which the bank used in its analysis of the relationship between Fed rate cuts and US equity vol.
The chart also shows the 3m moving average of the monthly change in non-farm payrolls, a measure of job creation in the US and a common gauge of overall economic health. Not surprisingly, the majority of first cuts happened in an environment of falling job creation, which often continued long into the Fed’s easing cycle. However, there are two cases in which economic conditions didn’t seem to be a big driver of the decision to lower rates – Oct-87 (Black Monday) and Sep-98 (LTCM).
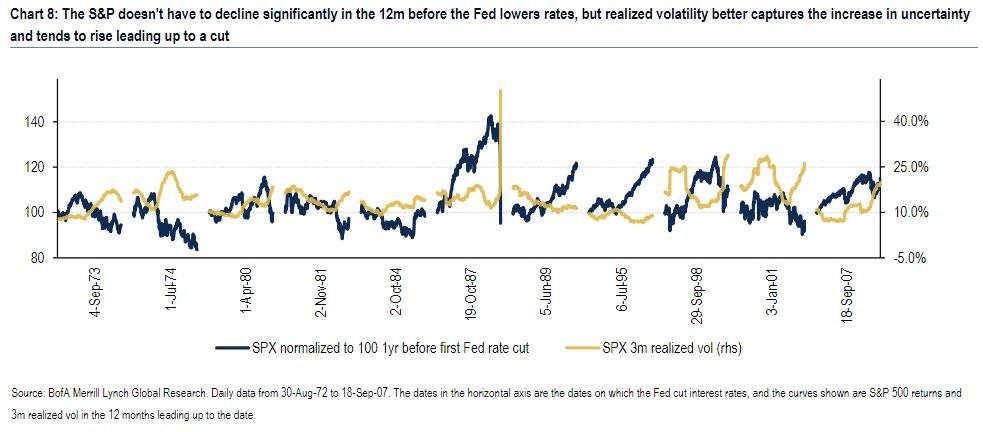
The next chart studies equity returns and volatility around all 11 episodes; in it BofA plots the S&P 500 and its 3-month realized volatility in the 12 months preceding each first rate cut. The first conclusion that stands out is that the S&P doesn’t have to decline severely before the Fed lowers interest rates. In fact, the index was flat or up 5 out of 11 times over the 12 months preceding the cut, and only in the first two periods were equities more than 5% down vs. a year prior. On the other hand, volatility does tend to capture the increase in uncertainty as the change in policy approaches, with 8 out of 11 periods experiencing an increase in vol. Interestingly, the two largest increases in vol occurred when a deteriorating US economy was not the main factor driving a rate cut – Oct-87 and Sep-98. Rather, a sharp spike in vol drove the decision to lower rates.
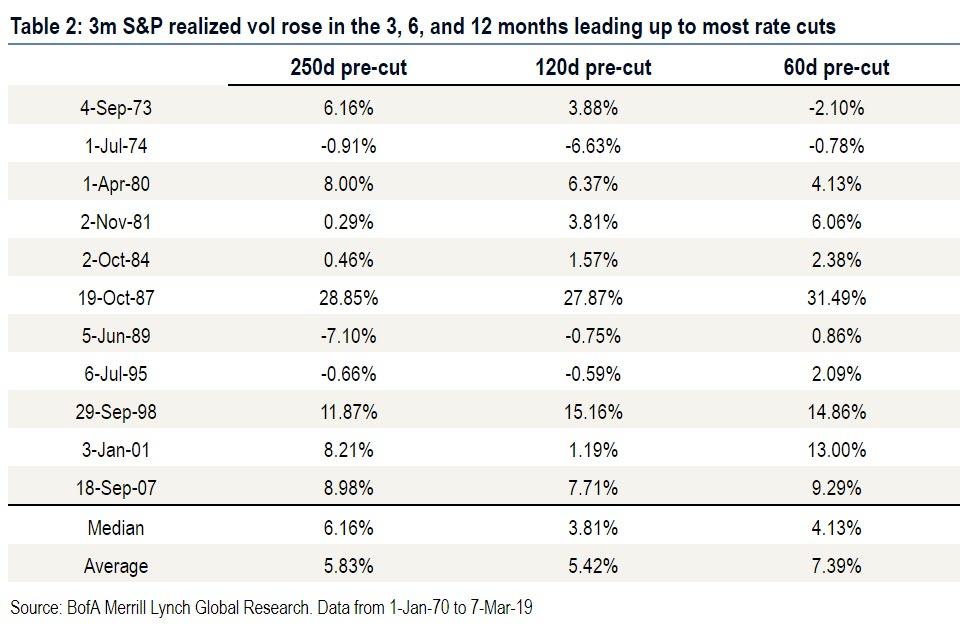
For all those who are blasting the Powell Fed for capitulation on hiking rates just because of the market swoon in the last quarter of 2018, it is worth noting that it was also market stress that triggered the ’87 and ’98 cuts, as well as the more reliable behavior of vol in anticipation of lower rates as the next two table show. Whether looking back 3, 6, or 12 months, the largest increases in 3m S&P realized vol across all 11 periods occurred in Oct-87 and Sep-98. But vol did rise consistently leading up to rate cuts, as only in 1974 did vol fall meaningfully in the 6 months prior (-6.63 vol pts), while in several cases it rose more than 5 vol pts. As a result, median and average vol increases were consistently positive when looking back 3, 6, and 12 months from the cut. This historical asymmetry in favor of higher vol suggests leaning long vol as a potential rate cut approaches, though one needs to be conscious of the cost of carry.
Here one can’t help but wonder if the inverse is also true: if the massive plunge in realized vol (as shown in the Goldman chart above), not only confirms that rate cuts are off the table, but that rate hikes may return soon (as Morgan Stanley suggested last week). If so, expect some fireworks from the Fed which will be forced to pull a second 180-degree U-turn within month.
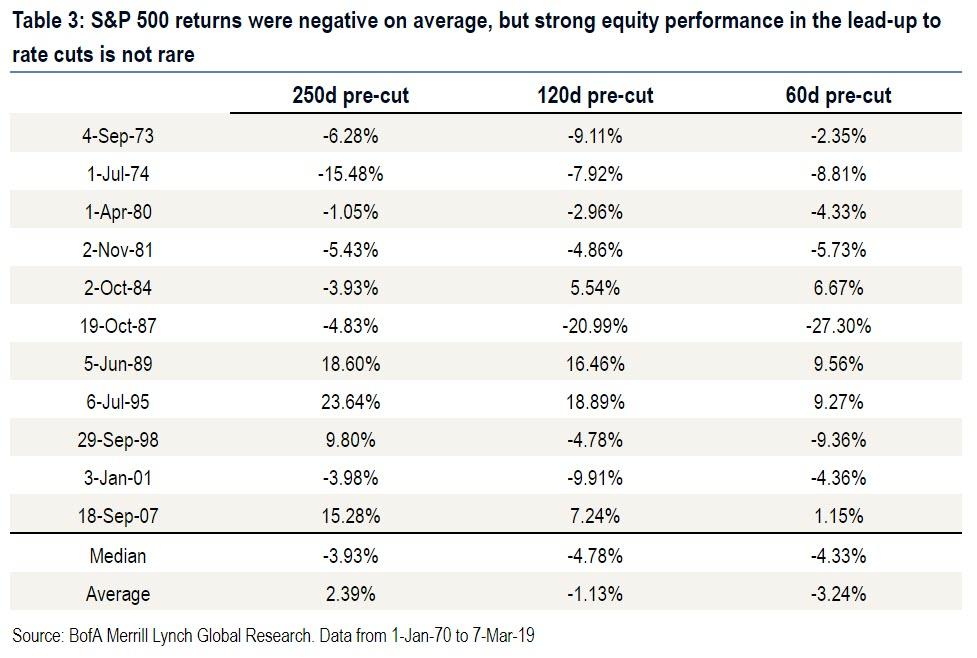
Volatility aside, there is a less clear trend in S&P returns around episodes where the Fed lowered rates for the first time in a cycle. While the median return was negative in all lookback periods, 4 out of 11 times the S&P was actually up on both a 3- and 6-month basis when the Fed cut rates. Again, the most extreme selloffs 60 days prior to the cut occurred in Oct-87 and Sep-98.
While aggregate summary stats point to higher vol as we move towards a potential rate cut, it is also worth considering whether one of the periods where vol fell would be a relevant analogue to today. Realized vol fell in the 6 months leading up to the cuts of Jul-74, Jun-89, and Jul-95, while it barely rose in Jan-01. However, according to BofA these periods in which vol fell are not appropriate analogues for today, as:
In 1974, this decrease in vol happened towards the end of an 18-month, 48% drawdown, where vol reached local highs prior to the Fed intervening. While we saw some market weakness in Q4-18, it doesn’t compare to the depth of that selloff.
In 1989, vol was still on the way down following the ’87 crash, also not comparable to today’s vol rising from record lows in 2017.
In 1995, the Fed began a mild easing cycle seemingly in response to slowing growth and significant volatility in bond markets. Equity markets showed little concern leading up to the cut and, in fact, rose 50% in the 18 subsequent months, far from most people’s outlook for markets today.
In Jan-01, the episode when vol rose the least in the preceding 6 months, realized vol was already in the mid-20s following the pop of the Tech bubble, limiting its response higher to the cut in rates.
Finally, looking at what the Fed Funds futures market was implying ahead of “first cuts” in interest rates since 1989, it seems that in most cases the rates market was in fact pricing in varying degrees of a hike, and was hence “surprised” by the cut. Even though this didn’t lead to a consistent response from volatility across episodes, one may still wonder whether a potential rise in volatility is less likely if markets accurately price the cut well in advance (as they may be doing today). and by extension, whether such market discounting may prevent the very event that is supposedly being priced in (i.e., not rate hikes until stocks slide again and vol surges).
As BofA concludes, while history doesn’t help us establish much precedent here, today’s low levels of recent S&P realized volatility (30-day is around 10 vol points) appear inconsistent with a rate-cutting environment, given that in only one instance out of 11 historically was realized volatility lower than it is today. All else equals, this suggests that all those who are convinced the Fed’s next act will be a rate cut in approximately 9 months may be in for a rude awakening.
via ZeroHedge News https://ift.tt/2u958Ye Tyler Durden
The launch of two rockets from the Gaza Strip prompted Israel to launch a massive airstrike in retaliation Thursday evening. The Israel Defense Forces seem to agree with the assessment, while the Palestinian Authority in the West Bank doubts the Israeli TV report. The two rockets that were fired from the Gaza Strip towards Tel Aviv and almost started a war late last week were launched by “accident,” Israel’s Channel 13 reported Friday, based on statements of IDF officials.
According to the report, the launch happened after low-level Hamas operatives “messed with” the rocket launcher, which was set up to fire at Tel Aviv in case of a future conflict. The Jerusalem Post reports that the rockets could have accidentally gone off during a routine maintenance operation.
The launch reportedly came as a total surprise to both Hamas leaders and the Egyptian delegation they were having a meeting with at the time of the event.
“You’re meeting with us at the same time as you’re firing on Tel Aviv?” the Egyptians reportedly asked Hamas leader Yahya Sinwar in fury.
After Sinwar checked out what happened, he reportedly explained the situation to the Egyptians, who immediately called Tel Aviv and relayed what they had been told to the Israelis.
Israeli officials apparently believed the explanation, as Channel 13 reported that “had the launch been deliberate, the Israeli response would have been five times heavier.”
Responding to the launches, which did hit residential areas but caused no direct injuries, Israeli warplanes hit over 100 Hamas targets in the Gaza Strip overnight from Thursday to Friday, The Times of Israel reported. The incident almost escalated to an all-out war after Hamas retaliated by launching several more rockets Thursday night.
An unnamed, low-level operative was arrested by Hamas authorities after the brief conflict, Channel 13 reported.
According to The Times of Israel, the West Bank’s Palestinian Authority doubted that the rockets were launched by mistake. The IDF, however, indicated that they consider the strike to be accidental, according to the Times.
Like ‘Monty Python’: TV details how Hamas ‘accidentally’ fired at Tel Aviv https://t.co/FAOYFDyOKu
Hamas officials said in an interview with the Times that the movement “has no interest in an escalation,” and that firing rockets is “outside the national consensus,” and they promised to take measures against the people behind it.
The farcical chain of events that almost led to the war was “like something out of Monty Python,” Channel 13 reported. This was the first rocket launch at Tel Aviv since 2014.
via ZeroHedge News https://ift.tt/2TQj9sh Tyler Durden
A 36-year-old Harvard university graduate implicated in the college admissions scandal is being described as a “test taking whiz who could get any score on demand” according to federal prosecutors. He has been revealed to be the “secret weapon” in the college admissions cheating scandal, according to a new Wall Street Journal article.
U.S. attorney for the District of Massachusetts, Andrew Lelling, said: “He did not have inside information about the correct answers. He was just smart enough to get a near-perfect score.” Prosecutors claim that Mark Riddell was central to the cheating scheme and he has agreed to plead guilty to mail fraud and money laundering, according to court documents.
He issued a statement after the charges, stating: “I understand how my actions contributed to a loss of trust in the college admissions process.”
Prosecutors have said that William Rick Singer’s admissions scheme happened over 30 times as far back as 2011 and of the 33 parents that were implicated in the scheme, at least 16 are linked to Riddell. He was described in court documents as “Cooperating Witness 2.” In hopes of leniency, he has been helping with the investigation since February.
In one case, when Riddell had a baby, one test need to be scheduled at a later date because he couldn’t make it. He had used false ID to pose as a student and he took tests on students’ behalf after asking for handwriting samples. He even took a test on one student’s behalf when the teen had tonsillitis and couldn’t meet him at the test site. He scored him a 35 out of a possible 36 on the ACT.
Riddell is an alumnus of a private Florida prep school and Harvard, where he studied biology and played tennis before graduating in 2004. As a result of the scandal he was suspended indefinitely from his job – wait for it – as director of a college entrance exam preparation at his alma mater prep school.
Singer said that Riddell could “nail a score” of any kind. In one case when he was told not to score too high, he scored 1670 out of 2400 on the SATs for one student. He was being paid approximately $10,000 per test that he took.
He reportedly “charmed” the students he was scheming for. One parent said of her daughter: “She loves the guy. She said he was so sweet.”
Late last week we reported on the tipster who gave the SEC the lead on the admissions scandal. He was in the midst of being investigated for a pump and dump scam at the time.
Earlier last week we reported that the universities involved were now facing class action lawsuits from their students. Additionally, we also reported on major tax implications that could be waiting for the parents involved – including potential civil tax fraud penalties and interest charges on any bribe amounts they wrote off.
Last week we unveiled that William Rick Singer was the man who brokered and facilitated many of the bribes.
Singer is called a “self described serial entrepreneur” who appeared to have found his niche in helping young people get into college. He was the founder of the Edge College & Career Network, the institution that helped broker bribes between the uber-wealthy and prestigious colleges. According to the company’s website, his goal was to “help alleviate the anxiety of getting into college” because he “has seen first hand the stress that the college admissions and athletics recruiting process can put on a family.”
Following charges, Singer pled guilty to racketeering, money laundering, conspiracy to defraud the United States and obstruction of justice. He is looking at between 15 and 19 1/2 years in prison for his crimes.
Our original take on the entire scandal can be read here.
via ZeroHedge News https://ift.tt/2FdCFpn Tyler Durden
We’re back in the phase of markets where bears look like idiots and bulls look like geniuses. In 2018, following the US tax cuts, a growing economy and expanding earnings had bears look the fools as markets moved on to record high after record high. By September and October bears had thrown in the towel so relentless was the constant drift higher amid shrinking volumes, dying volatility and uniform bullish consensus. It was a very deceptive environment as divergences and negative signals were ignored and markets ended up dropping 20% into December.
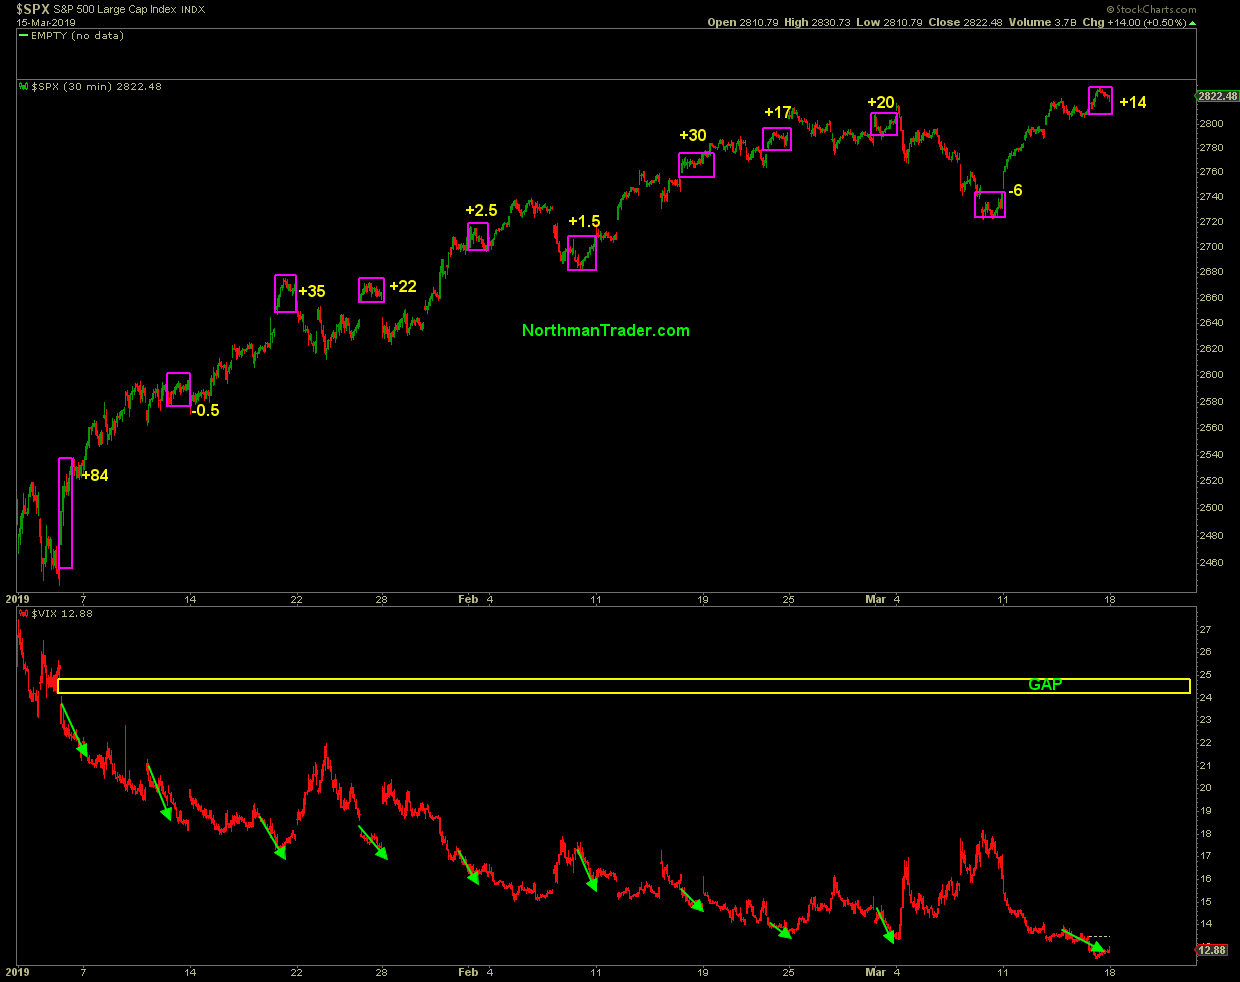
Now, ironically, it’s a slowing economy and slowing earnings, the very thing bears had predicted last year, that has bears on the ropes again. Why? Because it’s not the economy stupid. It’s liquidity. The oversold rally emerging from the depths of the December carnage has morphed into a liquidity bonanza as record buybacks are flushing relentlessly through the system and central banks have flip flopped on their previous policy stances. With algos latching onto any tweet or newsflash promising a coming recovery from the current slowing growth environment (think China deal) the liquidity machine has once again set markets on a relentless path of magic levitation accentuated by overnight gaps and market open ramps, tight intra-day ranges and magic risk free Fridays:
All the while volatility being relentlessly crushed. Bad economic data? No problem. No China deal? Not a bother, it’ll come someday. Brexit chaos? It’s just fun and giggles. All that matters is liquidity.
Indeed on Friday we saw the lowest volatility print of not only of 2019, but as I had outlined on twitter the lowest print since the $DJIA highs in early October of 2018:
$VIX 12.50
Lowest $VIX read since the beginning of October when markets were near all time highs and complacency ran rampant. pic.twitter.com/RxEvec1ovZ
And let’s be clear: This program is in full control and will remain so until something breaks.
$SPX may only be 4% off of its all time highs, but don’t think for a minute that the dovish parade will end any time soon. Next week central banks around the world will gather and keep touting their market supportive dovish tones, led by the US Fed which is now, according to Pimco, rumored to perhaps announce the end of their QT program for this year.
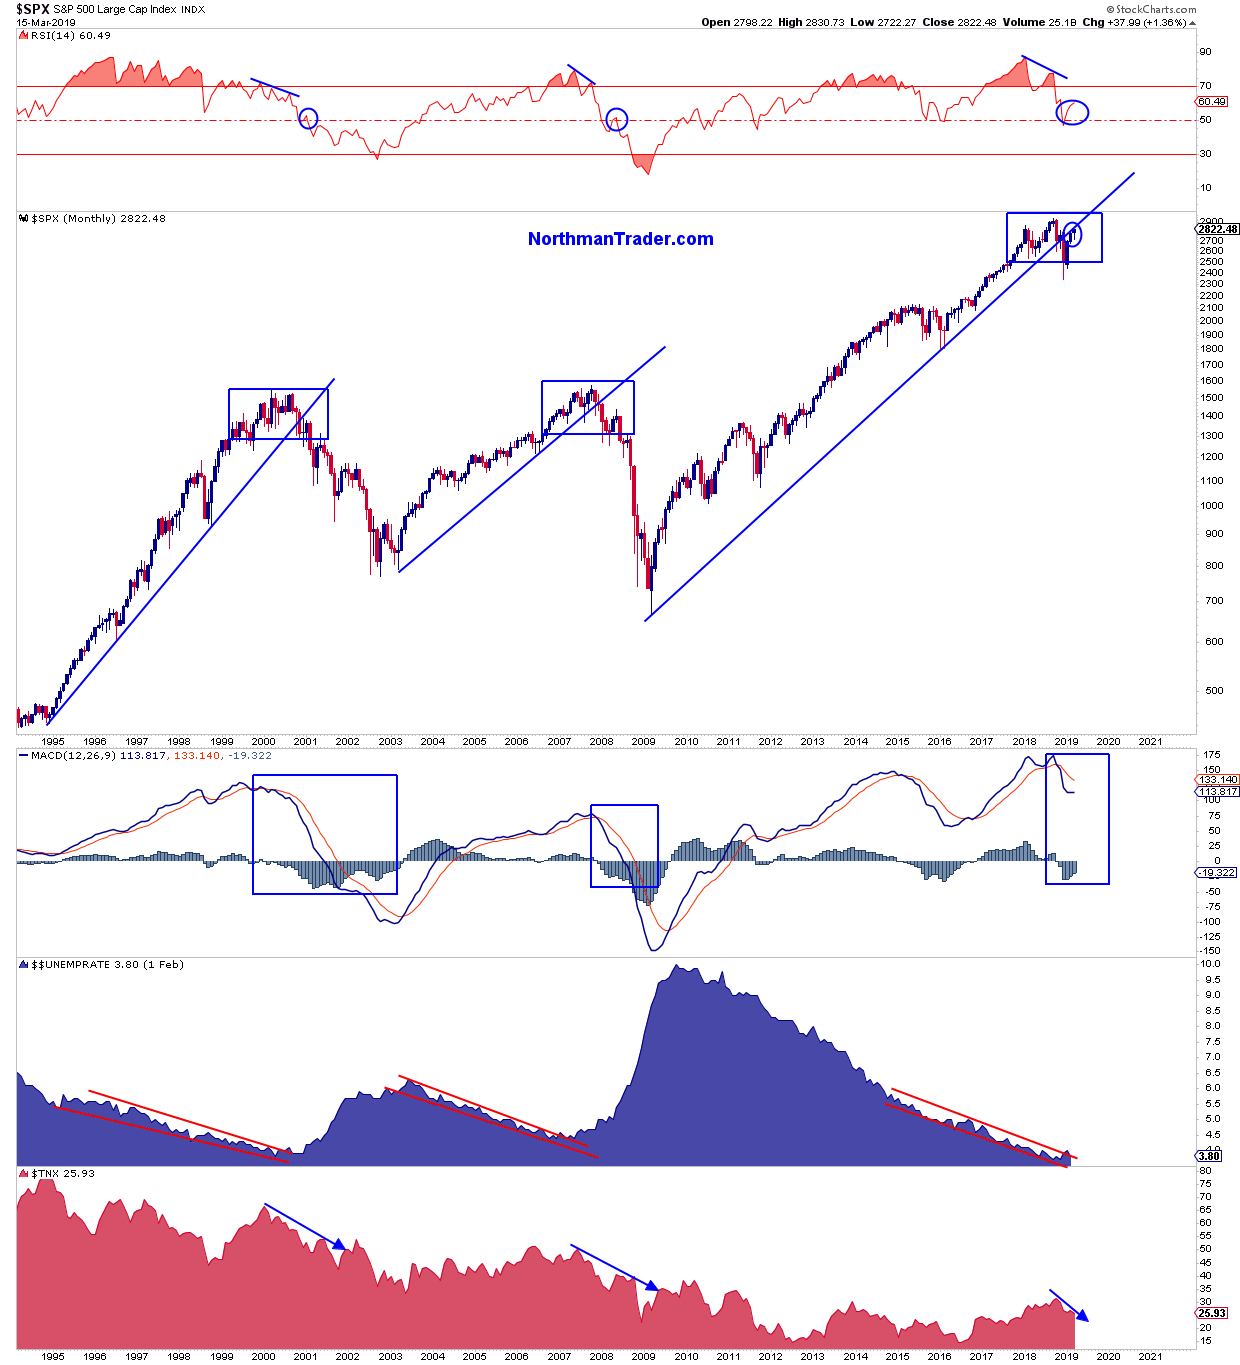
Why cling to dovishness now that markets have recovered most of their losses? Maybe, just maybe, central banks are looking at the bigger picture which suggests any renewed selling could prove disastrous:
Yet, amid all this bullishness and dovishness, the market action has also become overtly reminiscent of last year. Divergences that were ignored in September when I penned Lying Highs are once again making their presence felt, rendering this rally perhaps an exercise in deception as well. I said it last summer, and I say it again: Divergences don’t matter until they do, but when they do they matter greatly, hence bulls may be only one proper sell-off away from major trouble for a proper pullback would awaken the slumbering beasts of negative divergences.
In this week’s Weekly Market Brief I’m taking a closer look at these divergences and the structural weaknesses beneath this rally:
For now bulls remain in full control of the action and bears need to prove their case. Keep in mind that so far this year markets remain inside the trading range of 2018, making 2019 currently an inside year. It can’t be stated with integrity that $SPX would be currently trading anywhere near 2800 if the Fed had not turned dovish. For 10 years central banks have successfully levitated asset prices by being dovish. For 3 months in 2018 they weren’t dovish and it blew up in their faces. The big debate for 2019 will be if being dovish will once again succeed keeping the boogeyman at bay. So far the answer is a resounding yes. We’ll see what happens when the $VIX acts up for real. But don’t worry, Wall Street can’t even think of any catalyst for $VIX to rise. And so complacency was made great again and that, in itself, may be an act of deception.
* * *
For the latest public analysis please visit NorthmanTrader. To subscribe to our market products please visit Services.
via ZeroHedge News https://ift.tt/2CrecfE Tyler Durden
A Reuters journalist struck a deal to shelve a scoop that Democratic presidential candidate Beto O’Rourke once belonged to a notorious hacker collective “until after his Senate race against Ted Cruz in November 2018.”
On Friday morning, the day after O’Rourke announced his bid for the White House in 2020, Reuters’ Joseph Menn finally dropped his scoop revealing that O’Rourke belonged to the “Cult of the Dead Cow” (CDC) hacker group as a teenager, where it was revealed that he went under the handle “Psychedelic Warlord.”
YOUNGER DAYS: Beto O’Rourke, left, in a photo of his band, Foss. Texas Republicans also tweeted out what appears to be a police mug shot of the Texas Democrat. Handout via Texas GOP Twitter
In a “backstory” article late Friday, Menn explained that he struck a deal with the CDC to withhold O’Rourke’s involvement in the group “until after the November election” in 2018 – after which the group would confirm O’Rourke’s involvement, a secret they had kept for decades.
“While I was looking into the Cult of the Dead Cow, I found out that they had a member who was sitting in Congress, said Menn. “They wouldn’t confirm that it was this person unless I promised that I wouldn’t write about it until after the November election.”
Except O’Rourke admitted he was in CDC before the 2018 election.
“I met Beto O’Rourke. I said ‘I’m writing a book about Cult of the Dead Cow, I think it’s really interesting. I know you were in this group. This book is going to publish after November and your Senate race is over. And he said, ‘OK.’
“And he told me about his time in the Cult of the Dead Cow.” -Reuters
Defending the decision not to run the story, Menn tweeted on Saturday: “I offered @BetoORourke an embargo because it was for a book I was on leave to write, not for my day job, and because no one else who knew would confirm the facts before the election.”
Menn added “I had zero sources” – seemingly in direct conflict with his Friday admission that O’Rourke himself told him about his time in CDC before the election.
Not confirm what someone else said, confirm my guess. I had zero sources.
Once Reuters revealed that O’Rourke went under the handle “Psychedelic Warlord,” several creepy writings emerged that had written. In one, O’Rourke fantasized about murdering children with a car.
In another – a poem called “THE SONG OF THE COW,” O’Rourke worships a ball-buffing, butt-shining, ass-waxing cow that provides “milky wonder,” which the Daily Caller paid someone to perform.
Enjoy:
via ZeroHedge News https://ift.tt/2T8C25e Tyler Durden


