With December's "fat finger" in US Treasury Futures proved as nothing but an HFT algo gone wild, Nanex has turned its deep-thought to the recent halt in gold futures markets. Their conclusion, this was not the result of a fat finger, but rather the work of a high frequency trading algorithm that would pause, and (probably) test the market before continuing. A fat finger would not have had such distinguishing features.
December's bond melt-up was not a fat finger but an HFT algo gone wild..
Video replay of trading action in T-Bond Futures casts doubt that this was a "fat-finger" event
A fat-finger trade would send prices straight up, but video replay clearly shows pauses and ample back-and-forth trading.
And so was the recent gold smack down…
Via Nanex,
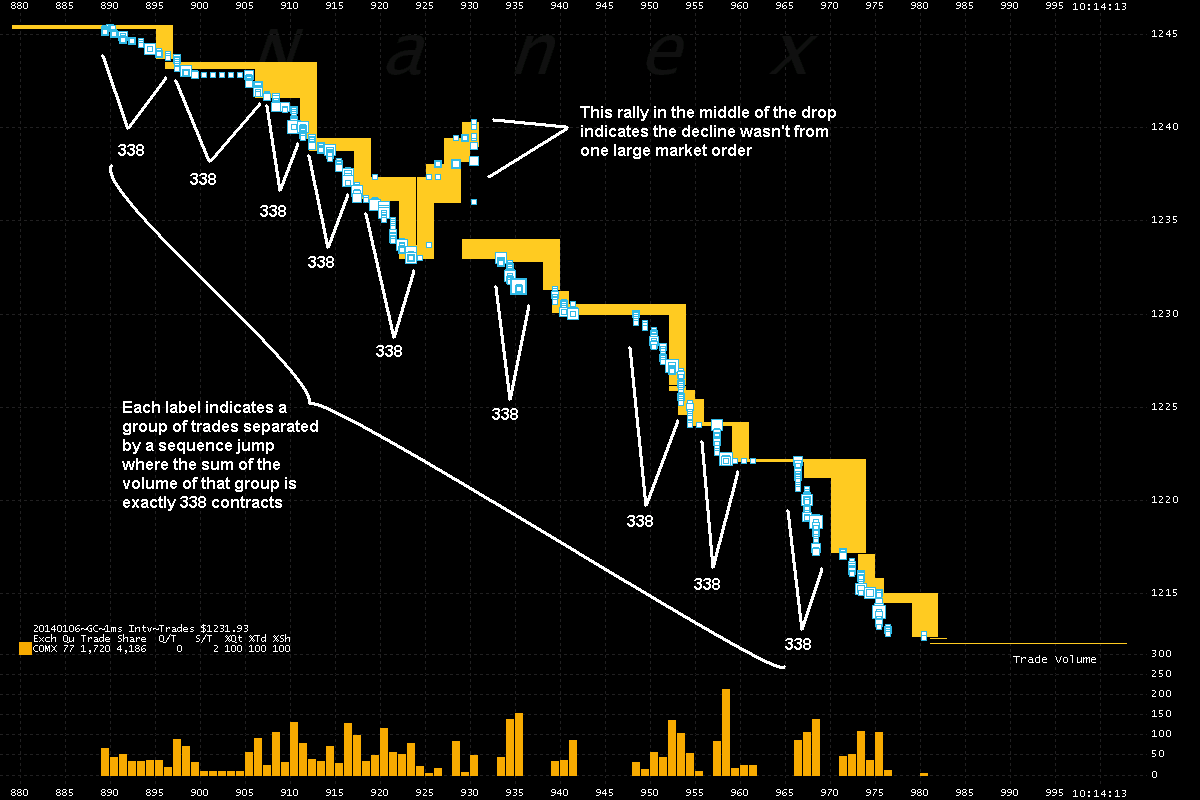
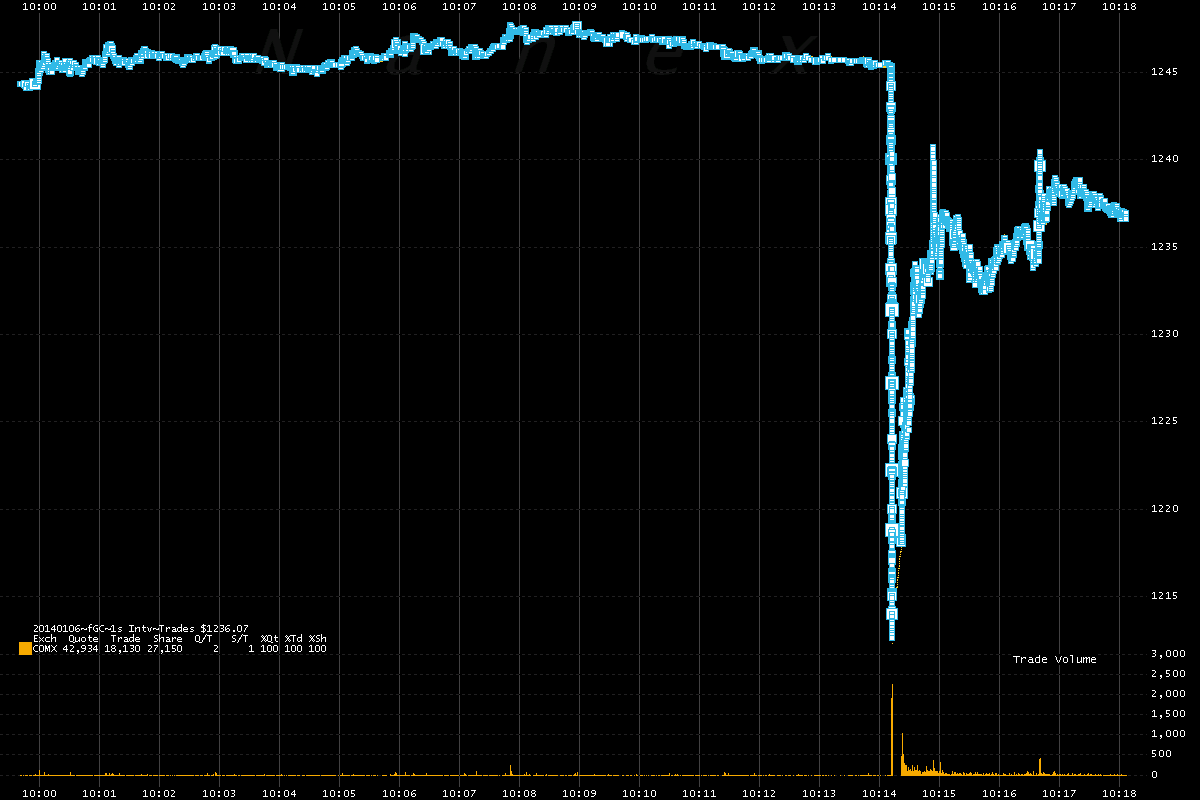
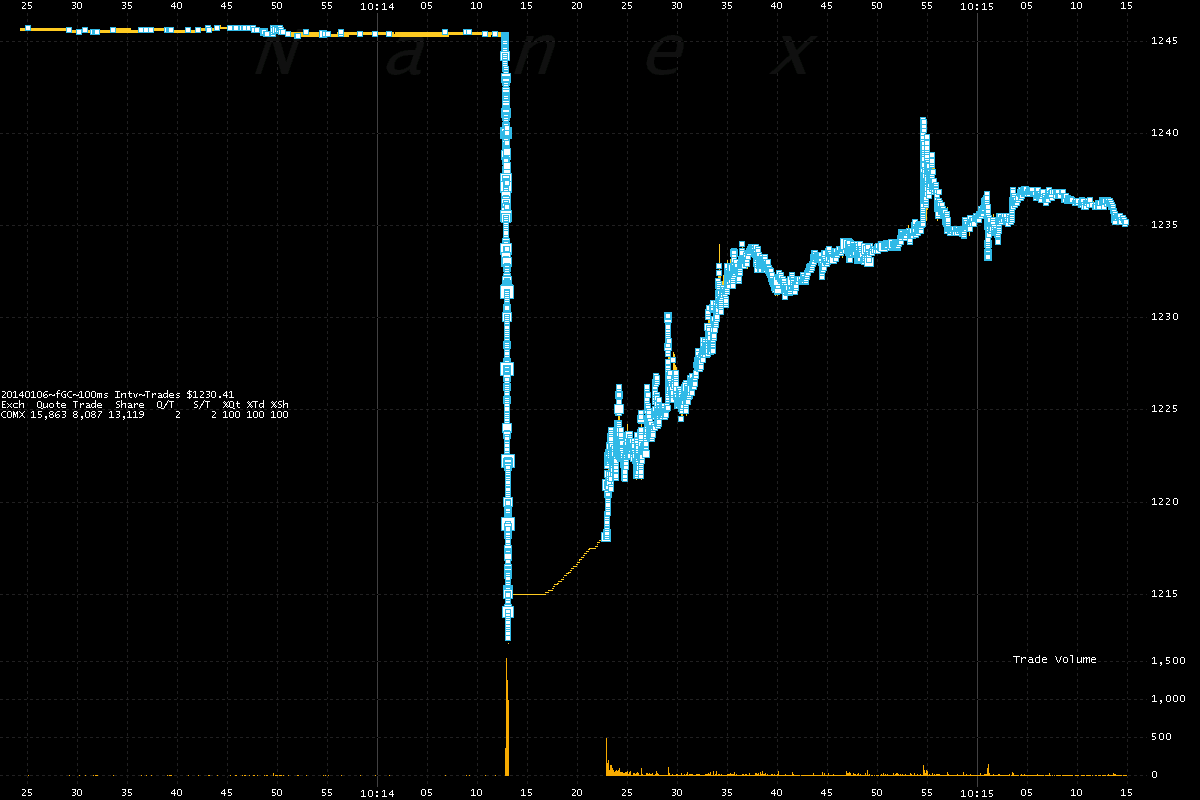
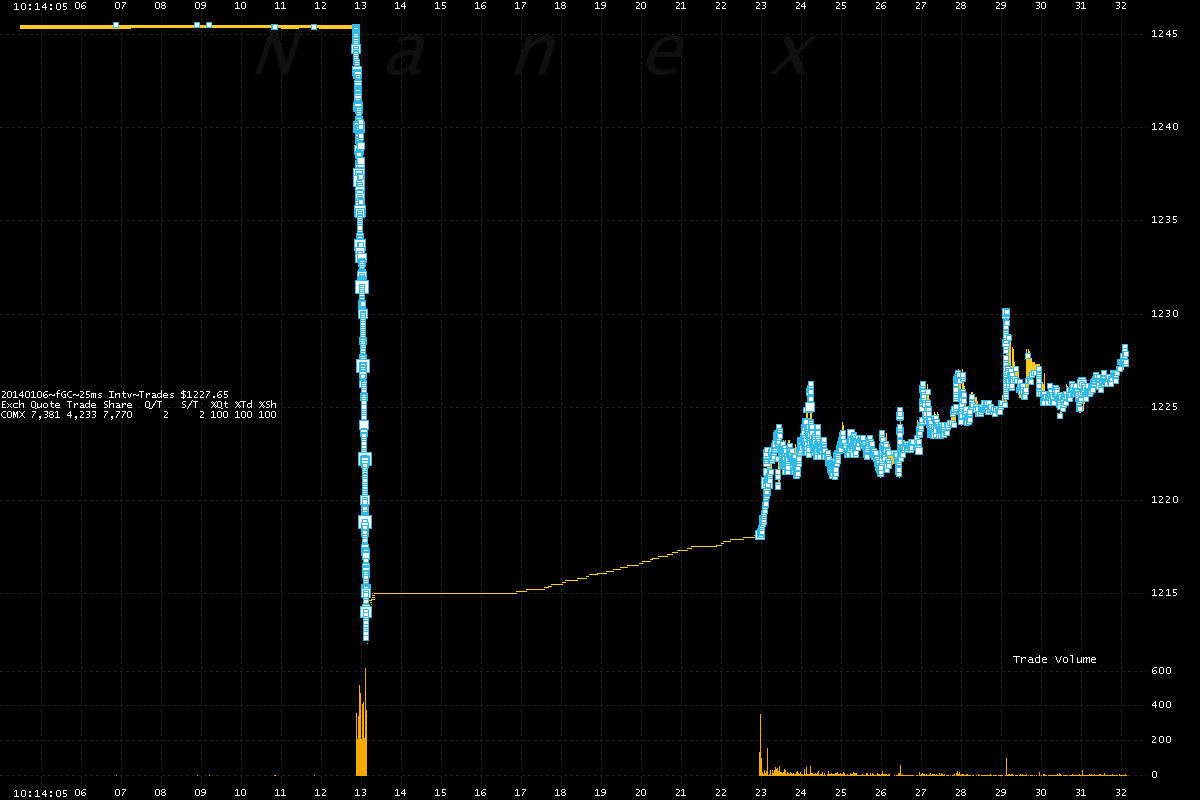
On January 6, 2014 at 10:14:13, Gold futures plummeted $30 on heavy volume. About 4,200 contracts send gold futures prices tumbling $30 and trigger a 10 second trading halt.
Update – 8-Jan-2014
The chart below shows the entire $30 drop in the price of Gold futures that occurred in just under 100 milliseconds (1/10th of a second). When we separated groups of trades by a jump in the exchange sequence number (a technique to determine the size of a larger order) we discovered there were 9 groups where the sum of the trade sizes was exactly 338 contracts! Each group is composed of widely different number of trades (211, 186, 120, 193, 97, 193, 137, 112 and 109 to be precise), yet the sum of the sizes of each group totals exactly 338. We show these 9 groups in the chart below. What's more, there are other trades occurring between these groups of 338 contracts.
What this tells us is that this was not the result of a fat finger, but rather the work of a high frequency trading algorithm that would pause, and (probably) test the market before continuing. A fat finger would not have had such distinguishing features.
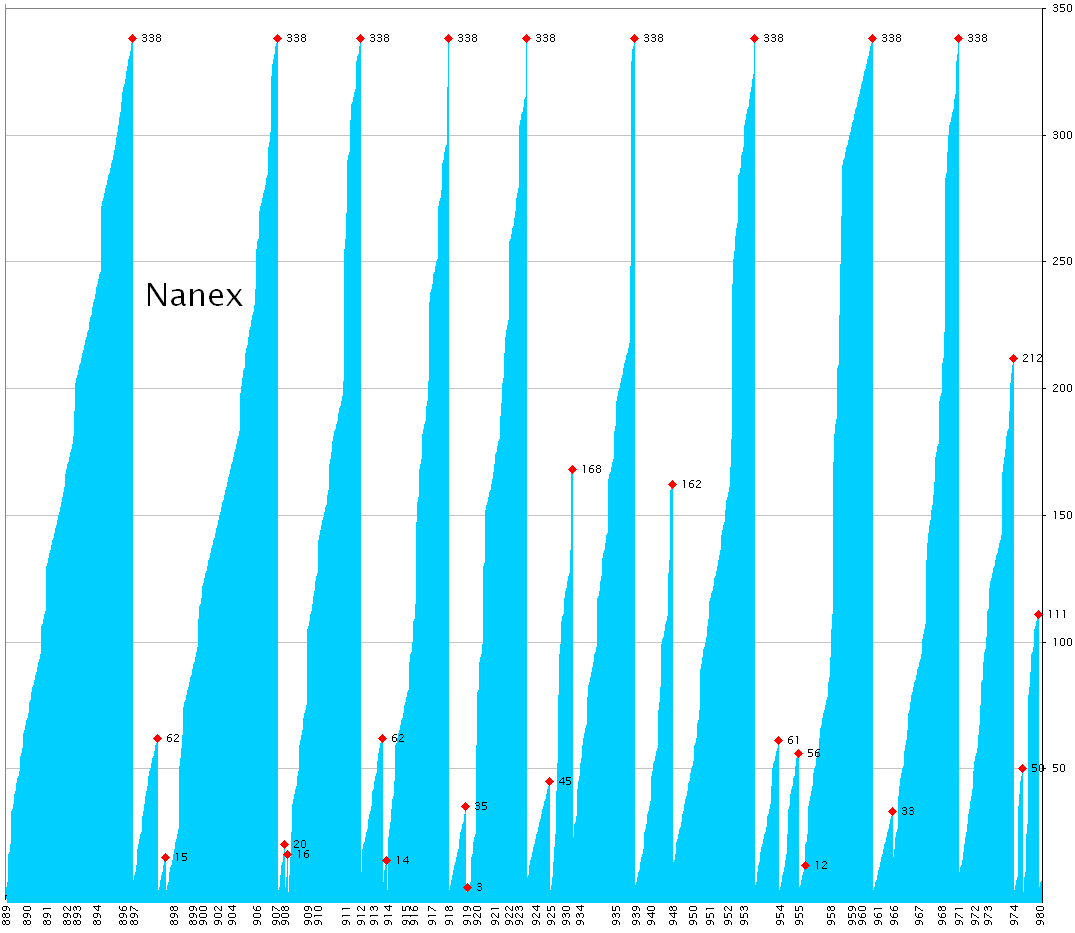
The next chart shows the cumulative sum of trade sizes for each group of trades where a group is distinguished by a jump in the exchange sequence number. Since exchanges use one sequence number for multiple products, you can usually tell if a group of trades is the result of a larger order by the lack of gaps in the sequence number. That means no other contracts traded during that time.
The time axis is the millisecond time component of the second 10:14:12, so that the value 889 corresponds to 10:14:12.889. The value axis is the cumulative number of contracts. The red diamond indicates the total size of a group when a sequence jump is detected.
Notice there are 9 groups that total exactly 338 contracts. Also note that each of these groups are separated by smaller groups of trades, and 3 of these smaller groups total 61 or 62.
1. February 2014 Gold (GC) Futures
2. February 2014 Gold (GC) Futures
3. February 2014 Gold (GC) Futures
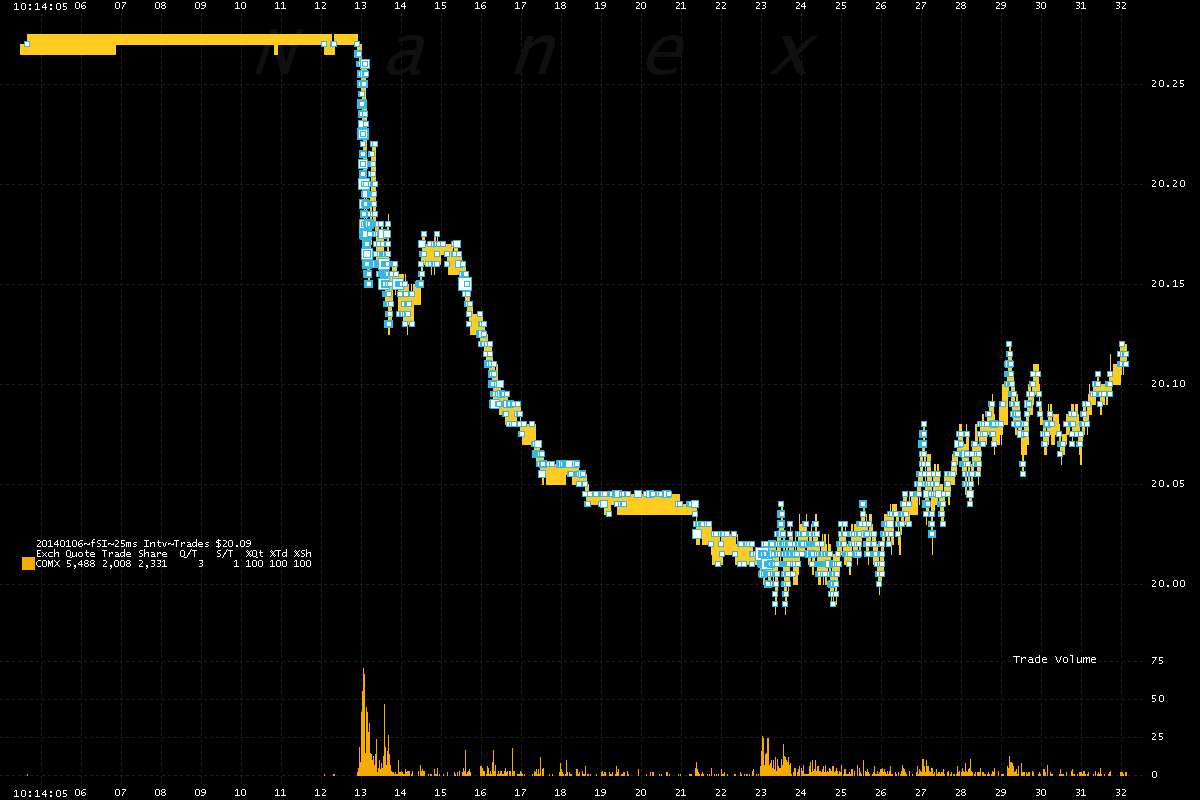
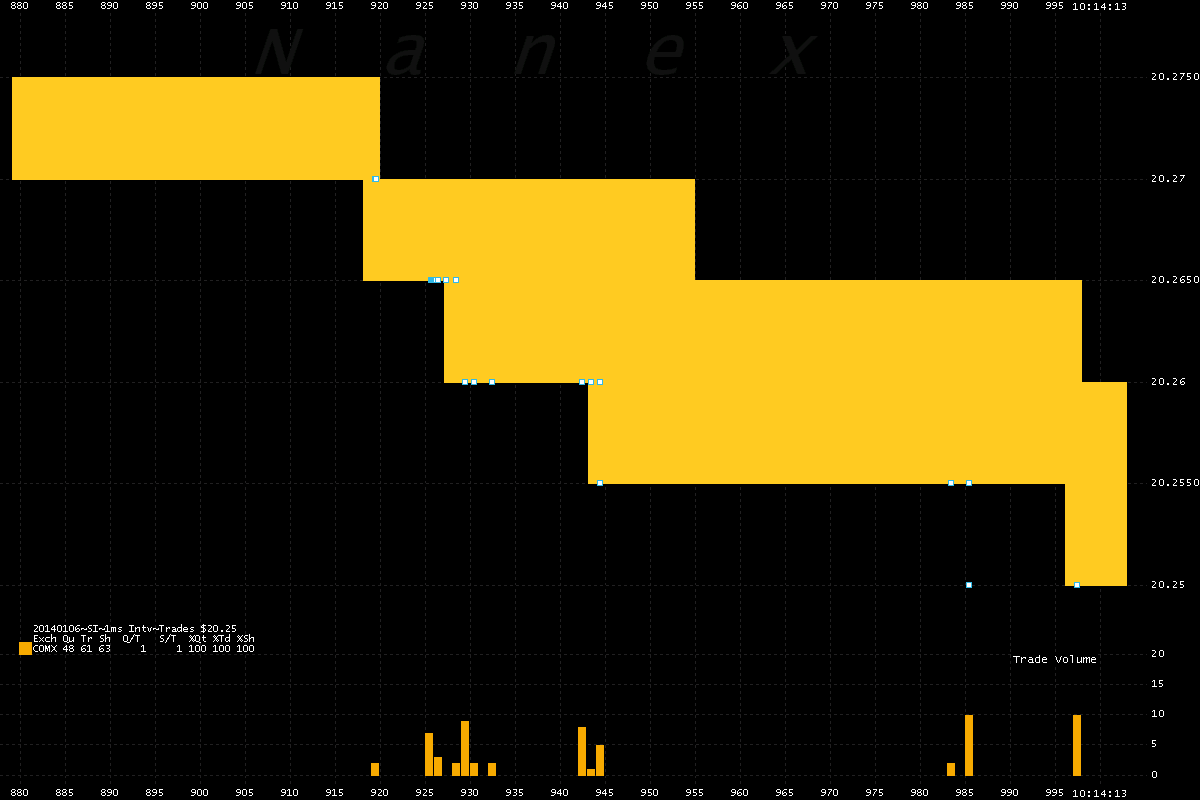
5. March 2014 Silver (SI) Futures
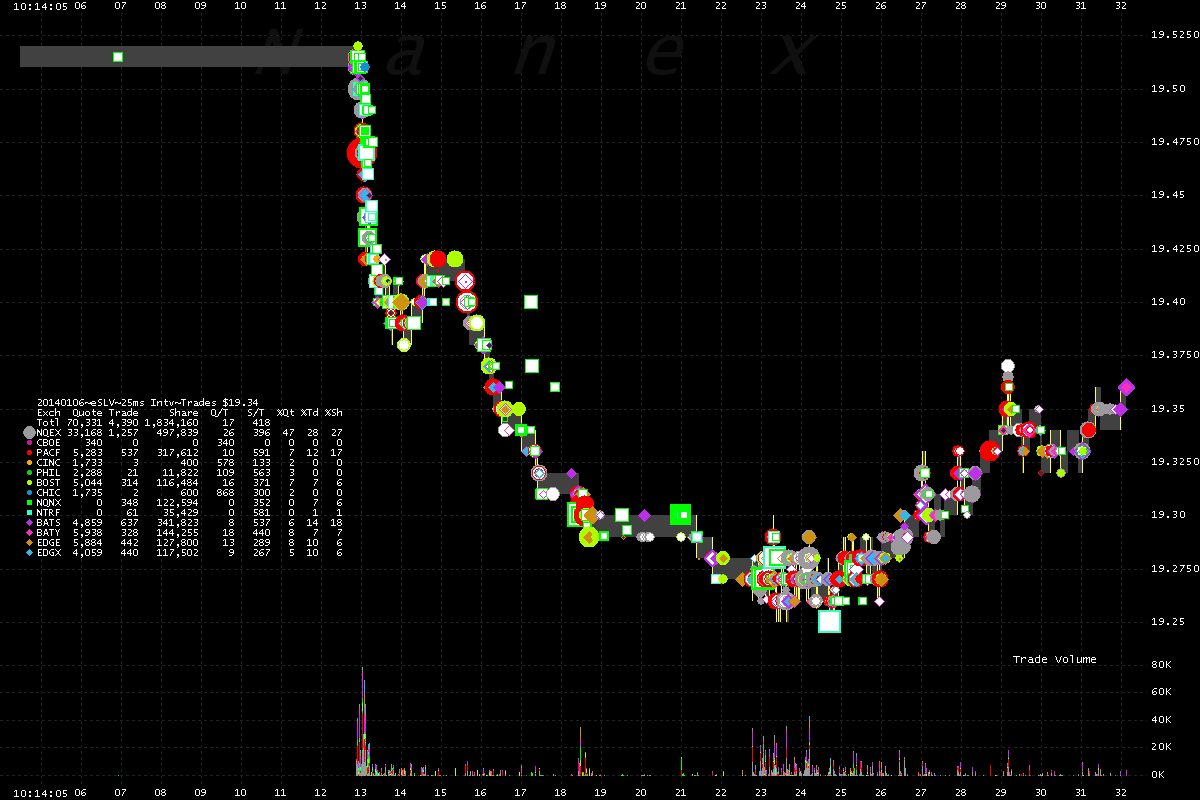
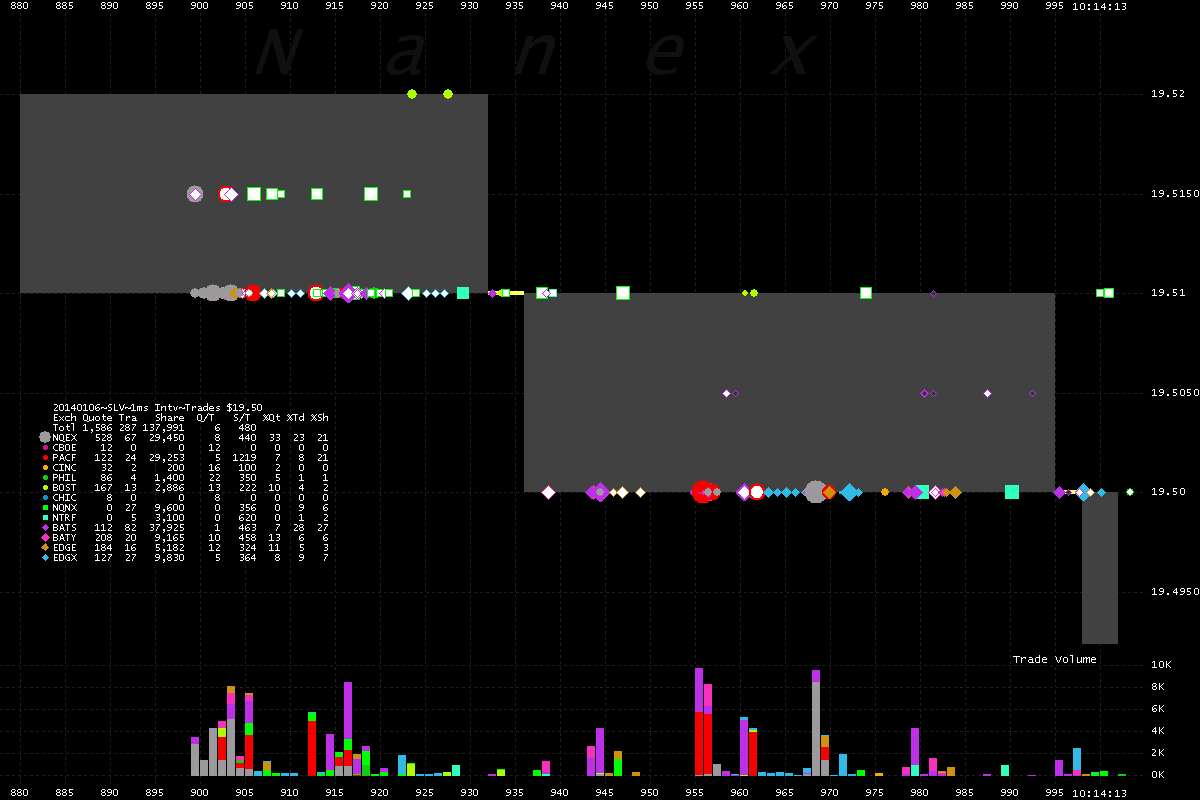
6. SLV ETF trades
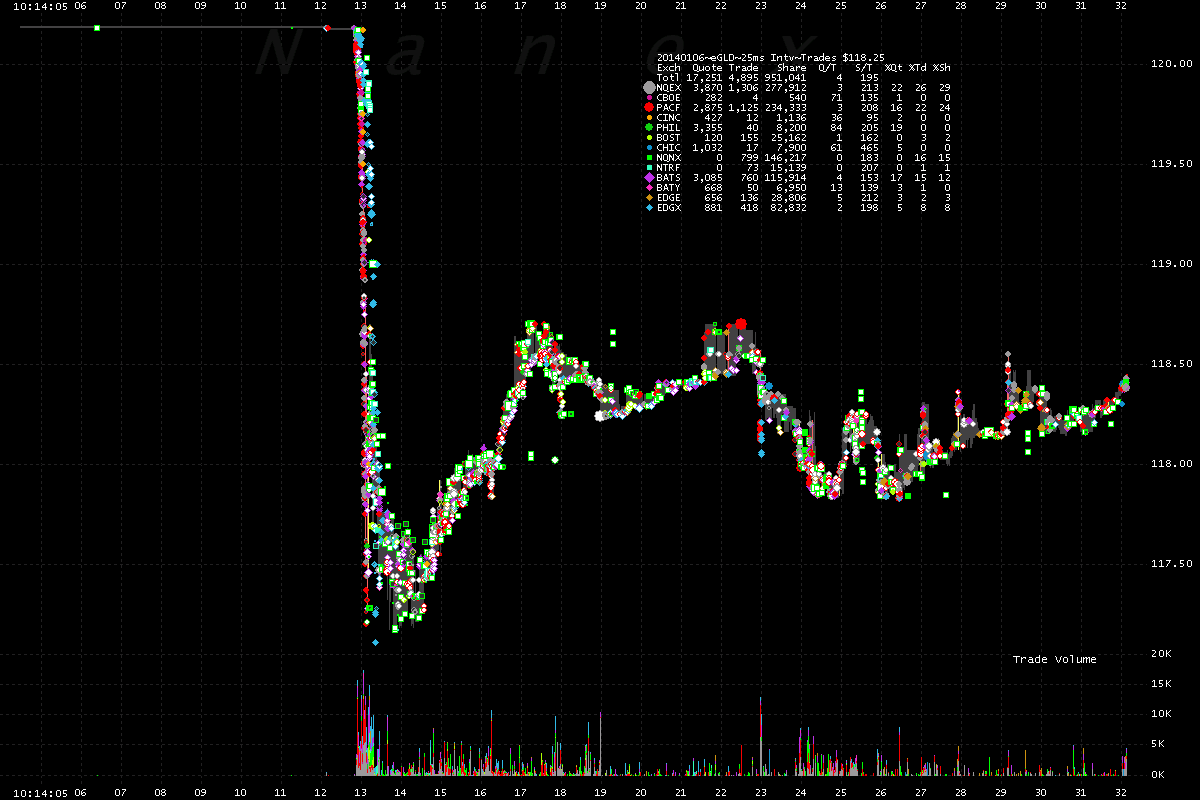
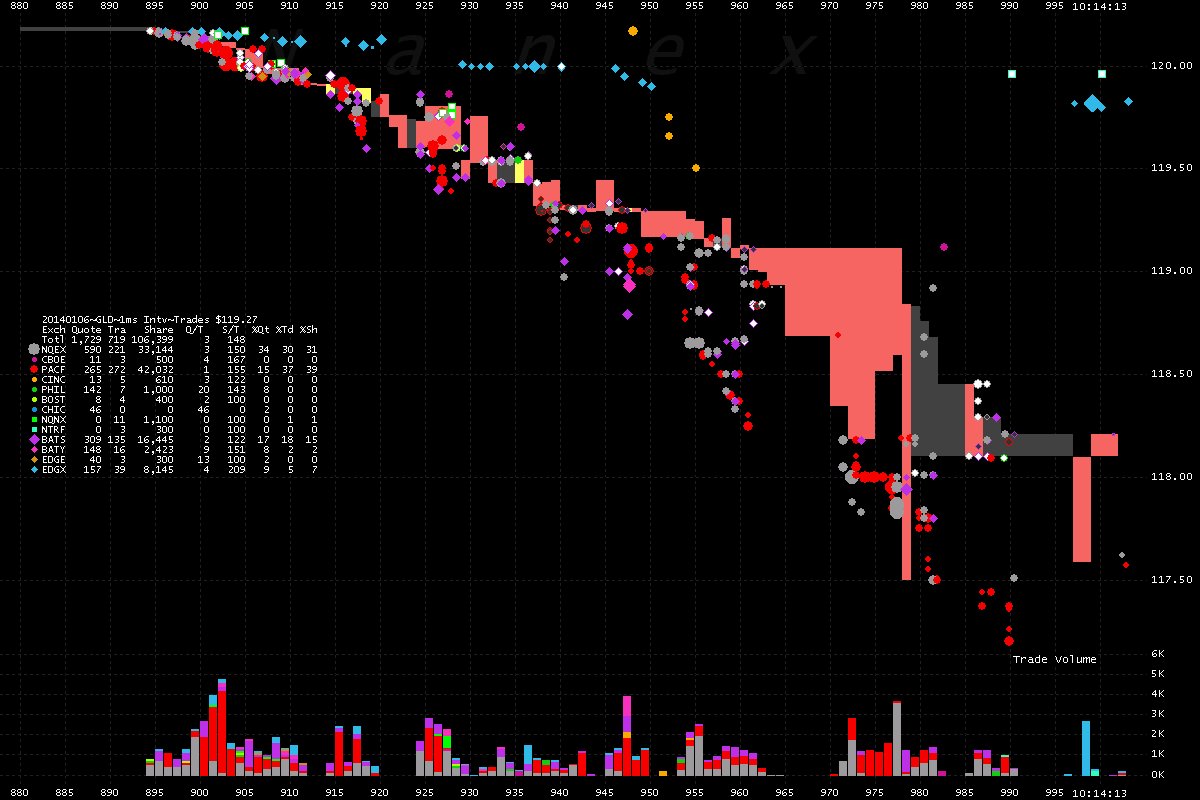
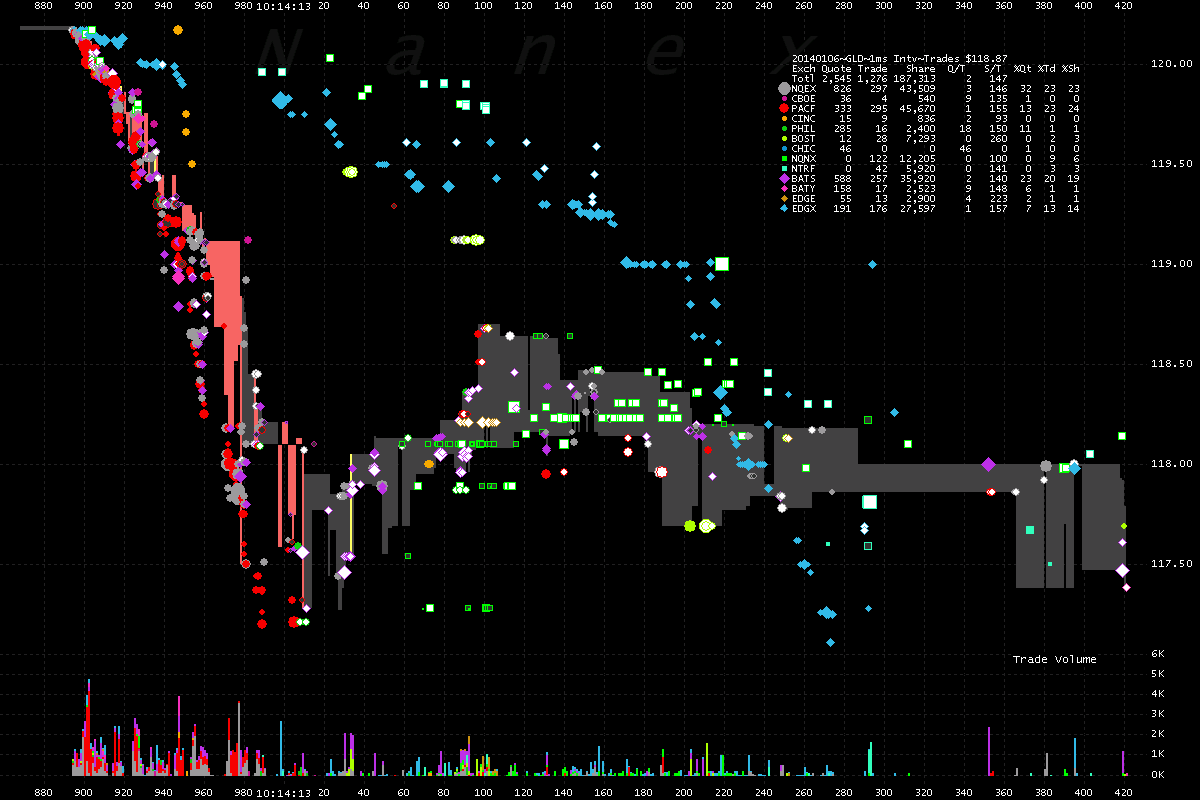
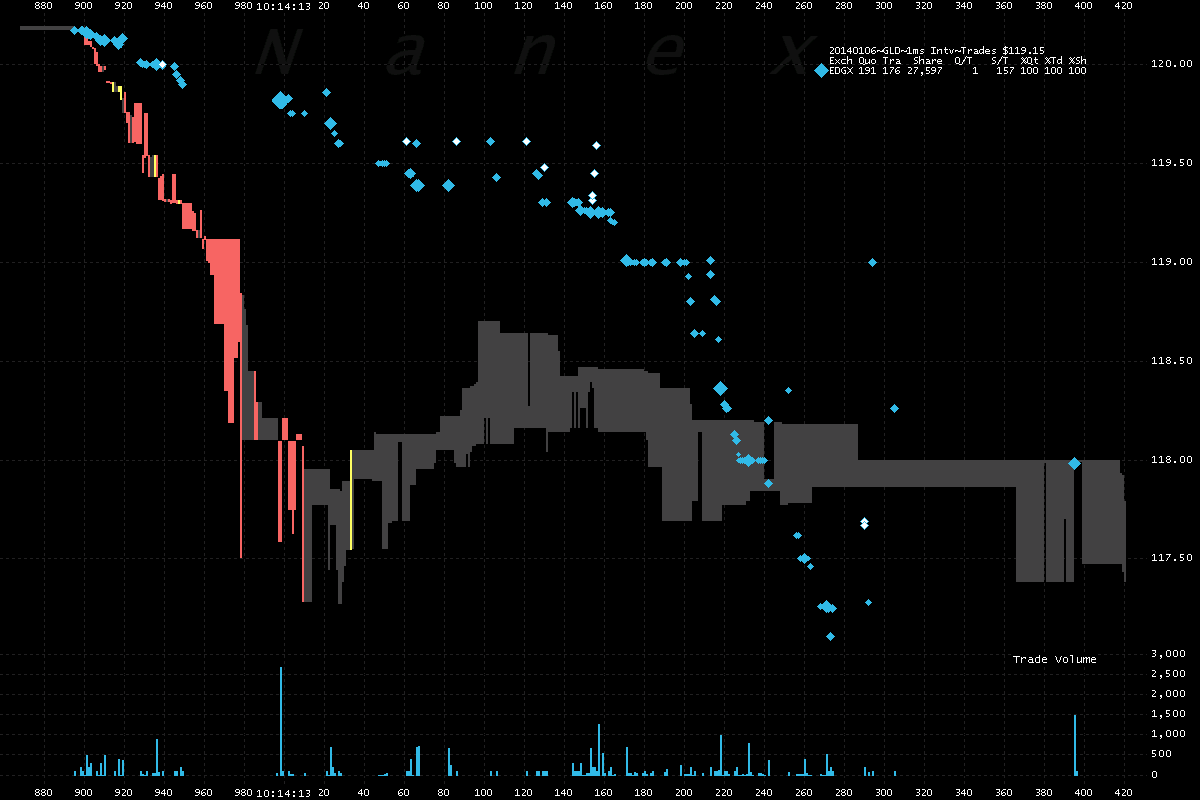
7. GLD ETF trades
Compare the next 4 charts which all zoom in on the first 1/10th of a second of activity (10:14:12.880 to 10:14:13) in Gold and Silver ETFs and futures. The futures trade in Chicago, while the ETFs trade in NY. It takes information about 4 to 5 milliseconds to travel between these two locations.
8. February 2014 Gold (GC) Futures – Zooming in on about 1/10th of a second.
9. GLD ETF trades – Zooming in on about 1/10th of a second.
Compare to Chart 8 above – note how the futures activity starts about 5 milliseconds earlier, indicating the move started in Chicago (futures) and not in NY (GLD).
10. March 2014 Silver (SI) Futures – Zooming in on about 1/10th of a second.
Trading didn't start in silver futures until a good 30 milliseconds after gold, which indicates silver was reacting and not part of the same strategy affecting gold.
11. SLV ETF trades – Zooming in on about 1/10th of a second.
Activity in SLV appears 5 milliseconds after activity in GLD. The silver ETF reacts faster to the the gold ETF (both in NY), than the silver futures reacts to gold futures in Chicago.
12. GLD ETF trades – Zooming in on about 1/2 second of time.
Note how trades from EDGX (blue diamonds), Dark Pools (squares) and BOST (light green circles) are reported significantly late.
13. GLD ETF – Direct Edge-X trades and NBBO
It's easier to notice the significant delay in trades reported from Direct Edge-X


via Zero Hedge http://feedproxy.google.com/~r/zerohedge/feed/~3/w9vZfEGLCTE/story01.htm Tyler Durden


