QE Defender – Stop The QE Insanity: Helicopter Money And The Risk Of Hyperinflation

QE Defender – Stop The QE Insanity: Helicopter Money And The Risk Of Hyperinflation

Submitted by BullionStar.com,

In 2016 at FreedomFest in Las Vegas, BullionStar first launched the QE Defender game.

With the central banks going all in on debasement of money by all means of quantitative easing and money printing, the QE Defender Game is more relevant than ever. We have therefore updated the characters of the game which can be played for free without registration here.

There’s an infinite amount of cash in the Federal Reserve” – Minneapolis Fed President Neel Kashkari, March 23

When it comes to this lending, we’re not going to run out of ammunition, that doesn’t happen” – Federal Reserve Chairman Jerome Powell, March 26

QE COVID

Over the last two months, major central banks and governments across the globe have unleashed a series of monetary and fiscal interventions on markets and economies which are unprecedented in their magnitude and which are bordering on the destruction of the current financial system.

While the global spread of coronavirus COVID-19 provided the trigger and the pretext for the current full-spectrum quantitative easing, money printing, asset purchases and economic bailouts, the size and scope of the current assault on free markets makes all previous central bank and government interventions look insignificance in comparison.

Markets are now officially broken. In some cases, the US Federal Reserve and the European Central Bank have become the markets, such is the scale of their asset buying, and their actions are making the bailouts of 2008 and 1998’s Long Term Capital Management (LTCM) look like a walk in the park.

From quantitative easing to zero bound interest rate cuts and beyond, from helicopter money to economy wide bailouts, the combined monetary and fiscal interference in markets and economies over recent weeks has now distorted everything from market prices to risk preferences to the time value of money, while shattering the concept of freely trading markets and free enterprise.

All of this in an environment of locked down economies, minimal economic activity, huge job losses, shrinking tax revenue and economic stagnation, as well as the impending approach of an unprecedented global recession, that if long lasting, will become a depression.

On the monetary side, the renewed and limitless quantitative easing – with central banks creating money out of thin air to buy up financial assets across all risk categories – combined with interest rate distortions, is both prolonging the very asset bubbles that the same central banks themselves created, while also leading to explosive increases in money supply. This in turn is leading to the destruction of currency values, and most worryingly, setting the scene for the real possibility of hyperinflation.

On the fiscal side, government stimulus packages of direct payments and loan and tax write-offs across vast swathes of economic sectors is not only creating a future dependence on income support and a pretext for the introduction of direct transfers to individuals, but is burdening the very same workforces with future tax burdens and even more debt.

Helicopter Drops

In this scenario, helicopter money, analogous to a helicopter dropping cash directly to the population, comes into play. Essentially helicopter cash represents direct methods of boosting consumer demand by the distribution of currency directly to the public into their bank accounts and into their pockets. Like quantitative easing, direct cash drops pave the way for destruction of currencies and can be the touch-paper to trigger hyperinflation.

Importantly, on both the monetary and fiscal fronts, the sheer flood of official interventions across markets and economies is now creating the largest moral hazard problem the world has ever seen, with investors and economic actors being conditioned to the expectation that central banks and governments will always come to the rescue by propping up asset prices and bailing out entire sectors (think banks, airlines and real estate), thus creating an environment that encourages a lack of individual consequences for future risky behavior, but at the same time creating dire consequences for the collective financial and economic system.

While the scale of what is happening right is daunting and difficult to keep track of, a ballpark estimate suggests that the total size of interventions from just some of the world’s largest monetary and fiscal authorities is currently more than US $10 trillion and counting. For a taste for how uncharted and dangerous this QE is becoming, a quick look at the US and Europe is instructive.

Quantifying QE – USA: Whatever it takes

After cutting interest rates to zero via two emergency decisions during March (March 3 here and March 15 here), the US Federal Reserve then announced on 15 March that over the coming months it would ramp up QE by buying at least $500 billion of US Treasury securities and at least $200 billion of agency mortgage-backed securities.

That’s $700 billion of Fed debt buying from banks and the Treasury across a cross section of widening of risk categories. At the same time, the Fed begun flooding the Fed system with credit in an attempt to boost liquidity, including $1 trillion in repurchase operations per day.

When this didn’t placate markets, the Fed then went ‘all in’ on 23 March and announced the start of open-ended quantitative easing (QE) in unlimited amounts, to buy an even wider range of debt from low to much higher risk classes, promising to:

 “purchase Treasury securities and agency mortgage-backed securities in the amounts needed…including purchases of corporate and municipal bonds.”

The Fed then also established swap lines with a whole range of major central banks around the world, providing these central banks with dollar funding in exchange for US Treasuries. This in essence expands the money supply of US dollars all over the world.

Then on 9 April the Fed was back, announcing another $2.3 trillion in QE, in the form of $600 billion purchases of bank loans of individuals and businesses, $500 billion buying of municipal bonds and loans (states, cities etc), and $850 billion in QE related to credit facilities of US corporates and asset-backed vehicles. Incredibly, this includes junk bonds and junk bond ETFs, with such market euphemisms as high yield, extended yield, and beyond investment grade. There is therefore, it seems, no limit to the depths the US Fed will go in its quest to prop up prices, bail out Wall St banks and hedge funds, and destroy financial markets.

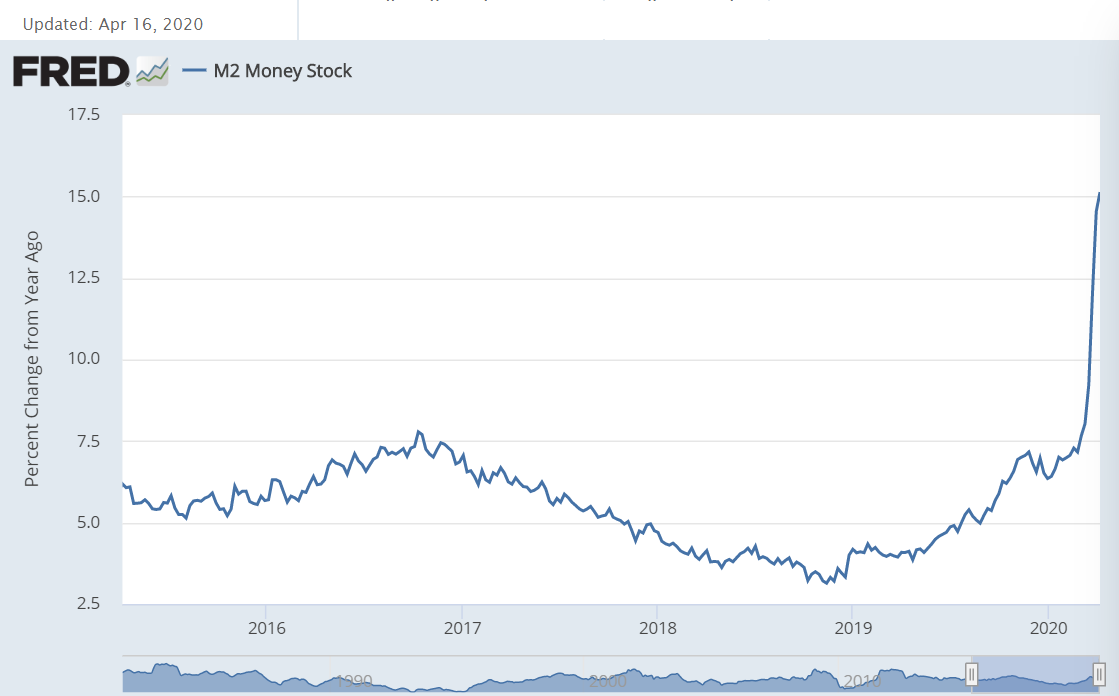
Not surprisingly, this new unprecedented and unlimited QE by the Fed over March and April can already be seen in the huge explosion in US money supply, where the monetary aggregate measure M2 (which includes cash, demand deposits, time deposits and money market mutual funds) has rocketed higher from the new money “out of thin air” that has no bearing on underlying economic growth. This can be seen in the below Federal Reserve chart. As a closely watched indicator in forecasting future inflation, this M2 chart speaks volumes.

M2  – A broad money supply measure –  Date range 2016 -2020 – To infinity and beyond Q 1 2020. Source – Fed St Louis  

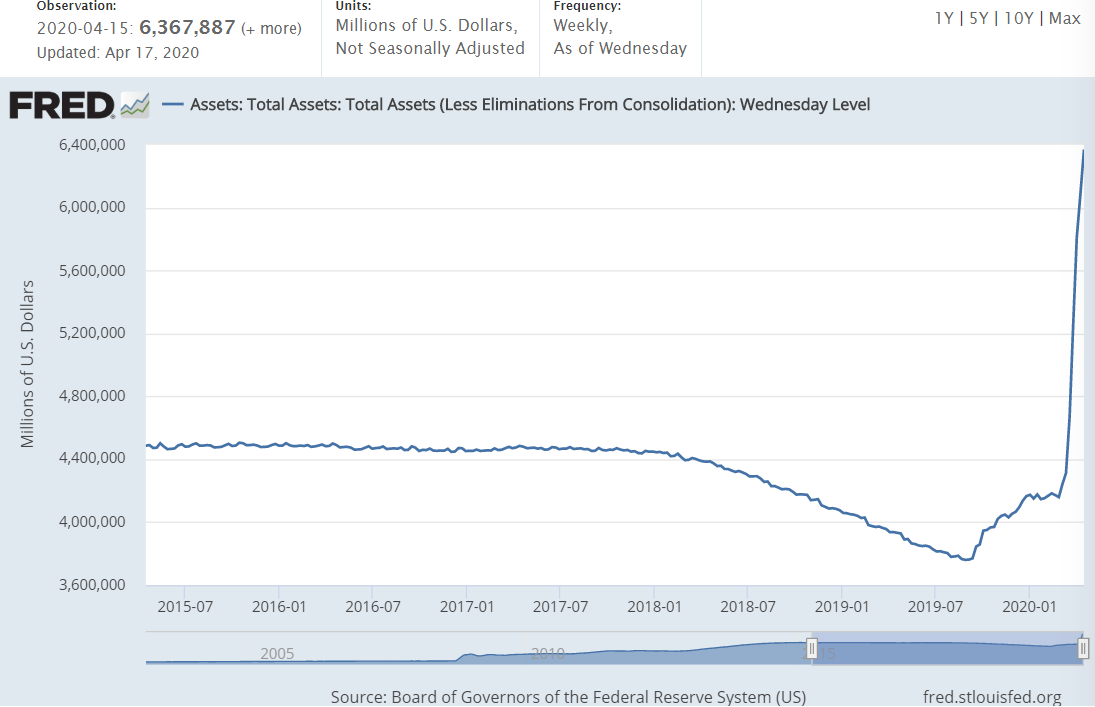
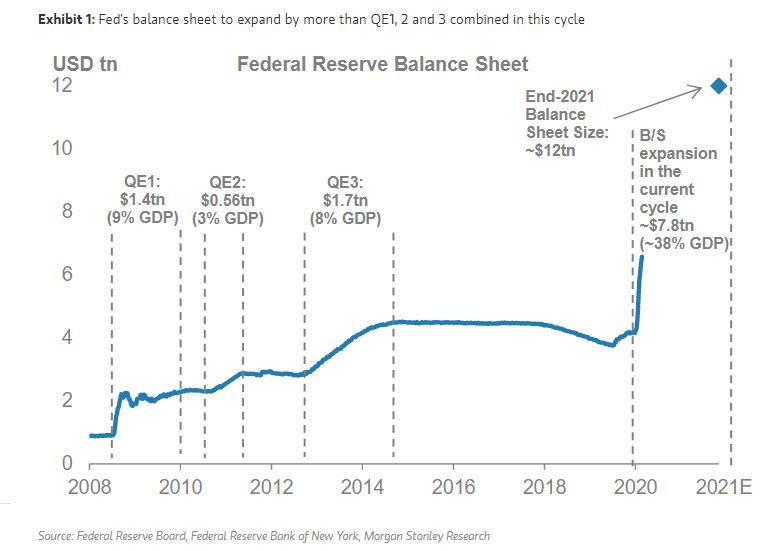
In the same vein, as architect of this rampant QE, the money out of thin air hits the Fed’s bottom line,showing up in the rapid expansion of the Fed’s balance sheet, which has ballooned from $ 4.17 trillion at the end of February to $6.4 trillion now. That’s an insane $2.2 trillion added since the start of March, or in other words, a 50% expansion in the Fed’s balance sheet since the end of February. This is neatly illustrated in the blow out of the Fed’s total assets since early March.

Balance sheet (total asset) of the US Federal Reserve – last 5 years. Source: Fed St Louis

Turning to US fiscal interventions, at the end of March the US federal government pushed through a staggering $2.2 trillion economic bailout package titled the Coronavirus Aid, Relief, and Economic Security Act (CARES Act), an intervention so large that it’s equivalent to 10% of US GDP. This CARES Act (which was ready and waiting in the wings) covers everything from loans to large and small corporations ($750 billion), the bailout of the US airline industry ($26 billion), loans to states and local governments ($340 billion), and most controversially, direct payments to individuals ($300 billion).

This last category is literally ‘helicopter money’, with every taxpayer in the US set to receive a $1200 payment, plus an additional $500 per child, with the transfers being made via stimulus checks (cheques) and direct deposits to bank accounts. The US IRS calls these Economic Impact Payments, but they are really direct cash injections, literally the long predicted helicopter cash drops. This money is printed out of thin air, directly distributed to the population, and most importantly raises the money supply while diluting the purchasing power of all existing currency.

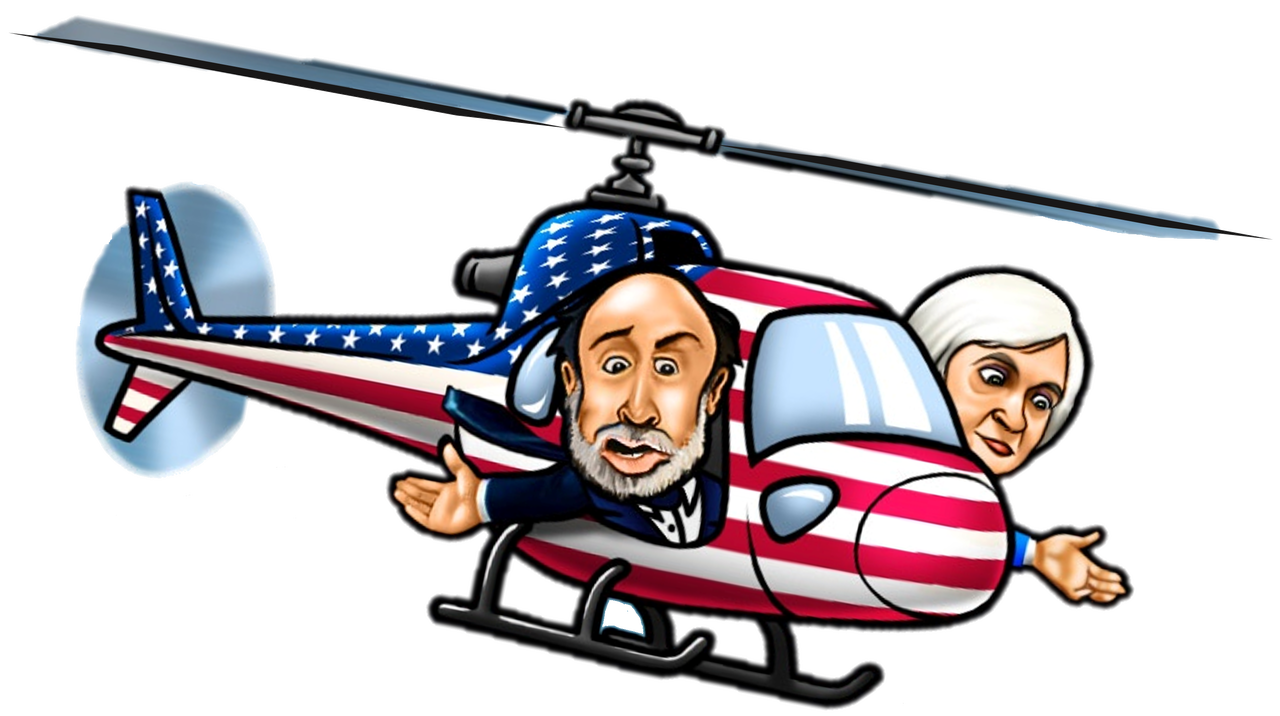
An image from the original version of BullionStar’s “QE Defender’ video game launched in 2016 and featuring the Fed chairs Ben Bernanke and Janet Yellen  


Quantifying QE: Europe – ECB 

After cutting one of its key refinancing rates to -0.75% in early March, the European Central Bank (ECB) then announced new monetary QE interventions on 12 March in the form of €120 billion of bond buying (quantitative easing) to complement its existing bond buying programme. On the same day, the ECB also announced an intent to flood cheap liquidity to European banks using longer-term refinancing operations (LTROs).

A week later on 18 March, the ECB ramped up the QE and went practically unlimited, announcing an enormous €750 billion Pandemic Emergency Purchase Programme (PEPP), a fancy name for even more QE that aims to buy government and corporate bonds (debt), including non-financial commercial paper (short-term loans). In total, that’s €870 billion in monetary QE interventions from the ECB.

On the fiscal side, Europe is leading the way with the largest fiscal bailout by any economic bloc so far,  totaling a massive €3.2 trillion in fiscal bailouts across the continent. This includes emergency packages of individual European countries such as Germany, Spain and France,  but also an EU wide bailout fund of €540 billion to which the European Union has agreed, consisting of €240 billion in credit for Eurozone countries via the European Stability Mechanism (ESM), €200 billion in loans for small businesses via the European Investment bank, and €100 billion in loans for job support.

The sheer scale and unprecedented nature of these European union interventions motivated one of its countless bodies, the European Economic and Social Committee, to proudly comment on 16 April that:

“In less than 4 weeks, the EU has done more than in the four years following the 2008 crisis, with interventions already decided that are estimated at over EUR 3 trillions.”

As to how the EU will pay for all of these bailouts, the EU Commission claims to have the answer, saying that it will, surprise, surprise, “propose borrowing to finance the recovery plan“.

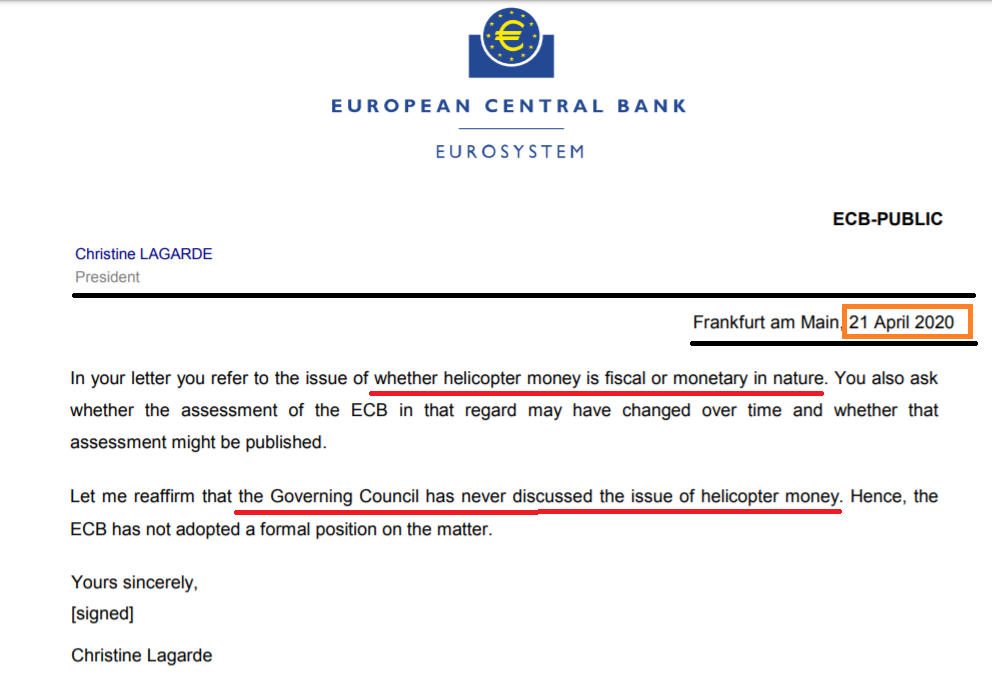
With the US government introducing helicopter money, can Europe be far behind? While the European Central Bank claims that helicopter money is not an option that’s being considered, would you believe them? In a recent letter responding to a member of the European Parliament (dated 21 April), the ECB’s Christine Lagarde avoids the question of whether helicopter money is a fiscal or monetary in nature, only saying that it has never been discussed by the ECB’s Governing Council. But in the infamous words of another fellow Europhile Jean-Claude Juncker, “When it becomes serious you have to lie.

Helipad – Letter dated 21 April 2020 from Christine Lagarde, president of the European Central Bank, about helicopter money

Beyond the Fed and the ECB, all other major monetary authorities and governments around the globe are also engaging in massive QE and economic bailouts, from the Bank of Japan and Bank of England to the Chinese and the International Monetary Fund (IMF), from Australia to Brazil and from South Korea to Singapore.  For example, the Bank of England has its own £645 billion QE programme buying UK government bonds and sterling corporate bonds, and has now moved to directly finance the spending the UK Treasury, a form of helicopter money.

Meanwhile, the Bank of Japan has just announced that it will now consider unlimited bond buying of government and corporate bonds – “Bank of Japan mulling unlimited bond buying at next meeting: Nikkei“. Everywhere one looks, the evidence is there, it’s QE to infinity, buying up all debt of all types and all risk categories at any price, in the process destroying the financial system and setting the scene for hyperinflation.

100 trillion Zimbabwean dollars

Hyperinflation

In an interview in 2010, then Fed chairman Ben Bernanke tried to dissuade concerns over Fed money printing, QE and market interventions, saying that:

This fear of inflation I think is way overstated …What we’re doing is lowering interest rates by buying Treasury securities. And by lowering interest rates, we hope to stimulate the economy to grow faster.

The trick is to find the appropriate moment when to begin to unwind this policy. And that’s what we’re going to do.

Fake words then from Bernanke, fake words now. There was no real unwind. Tapering was trick and a distraction. This is the same Bernanke who explained how the Fed’s lending is merely electronic printing, creating money out of thin air, and in so doing, inflating the money supply.

Quantitative easing, despite the complicated name, is a simple case of massively expanding the money supply. Helicopter money ditto, is also a simple case of massively expanding the money supply.

By artificially boosting demand in a scenario of lower production and constrained supply using the printing press and its electronic equivalent (QE and helicopter money), more fiat currency is entering the existing system. This can lead to product shortages, hoarding, and higher consumer prices, i.e. rising inflation, which is the economic textbook situation of too much money chasing too few goods.

Rising inflation in turn leads to lower purchasing poor and eroding value for a paper currency, loss of confidence in that currency, and in a downward spiral, faster spending to get rid of the increasingly worthless currency, which in turn leads to even higher prices, hoarding and inflation. And all this in an environment of economic stagnation and recession. This then leads to higher inflation expectations, and ultimately hyperinflation.

And what are we seeing right now in the global economy, led by the large central banks and the largest economies? Explosions in money supply brought on by quantitative easing. Increasing experiments of directly transferred helicopter money to artificially boost consumer demand. Supply side shortages and hoarding. Economic turmoil and economies in stagnation due to covid-19 lock downs with massive unemployment and economies slipping into recession and possible depression.

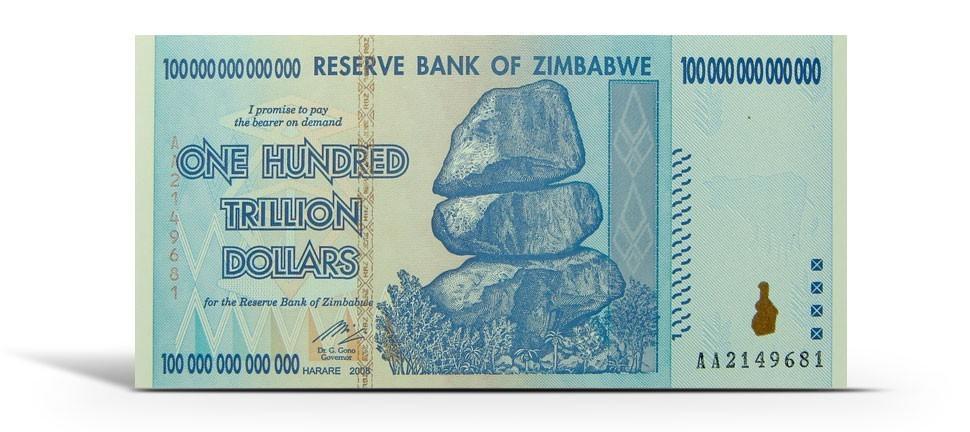
Hyperinflation is essentially a rapid and accelerating inflation amid a collapsing currency value, and it can arrive rapidly in an environment where frequent price rises have already begun to take hold.  In such scenarios, national cash becomes worthless and precious metals and reserve currencies become stores of values. For some of the more prominent hyperinflationary events in recent times just look at the hyper inflationary experiences of Argentina, Zimbabwe and Venezuela. See “The Power of Gold in Times of Crisis” for details.

For example, in 1989, prices in Argentina rose by an annualized 500 percent. In 2008, Zimbabwe’s annual inflation rate at one point reached 231 million percent. Annual inflation in Venezuela, which is still in the midst of hyperinflation, is currently over 2300%.

But what if hyperinflation hits major economics such as the US and Europe and their  ‘strong’ fiat currencies in the form of the US dollar and Euro? In the current environment of full-scale quantitative easing and the emerging popularity of helicopter money, this is something which populations may soon be about to find out.

Under this possible scenario, physical gold will become one of the few trusted assets to remain a secure store of value and wealth preservation when paper currencies crash and burn. Universally trusted as a safe harbor in times of crisis and emergency, physical gold is both the proven last man standing and the go to asset in a world at risk of hyperinflation.

This article was originally published on the BullionStar.com website under the same title “QE Defender – Stop the QE Insanity | Helicopter Money and the Risk of Hyperinflation”


Tyler Durden

Sun, 05/03/2020 – 21:30

via ZeroHedge News https://ift.tt/2Yw1lEQ Tyler Durden

Watch: Video Of NYPD Officer Brutalizing Bystander During ‘Social Distancing’ Arrest Sparks Outrage

Watch: Video Of NYPD Officer Brutalizing Bystander During ‘Social Distancing’ Arrest Sparks Outrage

We’ve been covering the NYPD’s ‘War on Barbecuing’ since news first broke that the NYPD – presumably at the behest of Mayor de Blasio – was ordering 1,000 more cops to patrol the city’s parks and public space to crack down on any ‘social distancing’ violations with tickets, summonses and arrests.

The same mayor who once dismissed the threat posed by the virus is flexing his muscles after the ultra-orthodox Jewish community in Williamsburg openly defied him last week by gathering for the funeral of a Rabbi, prompting Hizzoner to threaten a crackdown (eliciting an immediate backlash and accusations of anti-semitism).

On Sunday, ABC 6 shared a video of a New York City cop arresting a man and violently taking him down over an alleged social distancing violation.

The video, filmed by a bystander, showed the plainclothes officer, who was not wearing a protective face mask, slapping 33-year-old Donni Wright in the face, punching him in the shoulder and dragging him to a sidewalk after leveling him in a crosswalk in Manhattan’s East Village.

Wright was allegedly filming the officer making an arrest for a social-distancing violation before he turned on the bystander instead and threatened to taze him then attacked him, while another bystander filmed the incident.

De Blasio called the video “unacceptable” and said the officer involved has been placed on “modified duty” while internal affairs investigates

NYC is of course the hardest hit area in the entire US, with as many as 20% of the city’s population suspected of having been infected with the virus. We suspect the mayor will announce tomorrow that he plans to “ease up” on ticketing and arrests for these types of violations.


Tyler Durden

Sun, 05/03/2020 – 21:05

via ZeroHedge News https://ift.tt/3ffZwBS Tyler Durden

Epstein Had Extensive Ties With Harvard University

Epstein Had Extensive Ties With Harvard University

Authored by Zachary Stieber via The Epoch Times,

Sex offender Jeffrey Epstein had extensive ties with Harvard University, which admitted him as a Visiting Fellow and later gave him his own office, according to a review conducted by Harvard attorneys and an outside law firm.

Epstein was awarded the title of Visiting Fellow, which goes to independent researchers, in 2005 despite the fact he “lacked the academic qualifications Visiting Fellows typically possess and his application proposed a course of study Epstein was unqualified to pursue,” according to the review (pdf).

Dr. Stephen Kosslyn, the chair of the Psychology Department at the time, recommended Epstein’s admission. Epstein donated $200,000 to support Kosslyn’s work between 1998 and 2002.

Epstein told the university in his application that he wanted to “study the reasons behind group behavior, such as ‘social prosthetic systems,’ and their relationship to a changing environment,” using a term invented by Kosslyn.

“That is, other people can act as ‘prosthetics’ insofar as they augment our cognitive abilities and help us to regulate our emotions—and thereby essentially serve as extensions of ourselves. I wish to understand how the brain both allows such relationships to develop and how those relationships in turn take advantage of key properties of the brain,” Epstein wrote.

Jeffrey Epstein appears in court in West Palm Beach, Fla., on July 30, 2008. (Uma Sanghvi/Palm Beach Post via AP)

Epstein paid tuition and fees to become a Visiting Fellow but “did very little to pursue his course of study,” according to the review. He was readmitted for a second year after saying in an application he wished to “find a derivation of ‘power’ (Why does everybody want it?) in an ecological social system” but withdrew following his arrest in 2006.

Epstein was accused of molesting dozens of underage girls that year. He ended up pleading guilty to one count of soliciting minors for prostitution in 2008.

Kosslyn admitted to the attorneys conducting the review that Epstein wasn’t qualified to conduct the research outlined in the application. Epstein’s educational background, lacking a college degree, was highly unusual for a Visiting Fellow.

Kosslyn in his recommendation for Epstein called the financier “extraordinarily intelligent, broadly read, and very curious.”

“Jeffrey has been a spectacular success in business, and it is clear why: He’s not just intelligent and well-informed, he’s creative, deep, extraordinarily analytic, and capable of working extremely hard,” he added.

Harvard University in Cambridge, Massachusetts, on April 22, 2020. (Maddie Meyer/Getty Images)

Had His Own Office

Epstein’s involvement with Harvard didn’t stop with his criminal conviction.

The sex offender was given an office with his own telephone line in Harvard’s Program for Evolutionary Dynamics (PED), which he helped establish in 2003 with a $6.5 million donation. He also received a keycard and passcode access to the program’s offices.

Epstein is believed to have visited Harvard offices dozens of times between 2010 and 2018 after being released from jail.

“Epstein was routinely accompanied on these visits by young women, described as being in their 20s, who acted as his assistants,” the review states. According to prosecutors, many women who spent time with Epstein were underage.

Epstein would give Martin Andreas Nowak, a professor of biology and mathematics, the name of professors he wanted to meet with. Either Epstein or Nowak would invite the academics to meet with Epstein at the PED offices.

The meetings usually took place on weekends.

“Taken as a whole, the documents suggest that Epstein viewed the PED offices as available for his use whenever he wished to gather academics together to hear scholars talk about subjects Epstein found interesting,” lawyers wrote in the review.

Nowak, who lawyers said took no steps to conceal Epstein’s activities, was placed on paid administrative leave on May 1 after the review was published. Officials are probing whether Nowak violated university rules.

The visits came to an end only after a number of PED researchers objected to the situation.

Not only Epstein, but his “assistants” received cards and keypad codes that let them access PED buildings whenever they wanted. When Harvard tightened security in 2017 by installing a different card reader system, several cards designated for temporary visitors were mailed to an assistant of Epstein.

Nowak’s chief administrative officer (CAO) informed the professor of the arrangement, calling it “easier” because Epstein “would have go go get photo [sic] taken” if he instead was given different, more specific type of card.

“Epstein’s permanent possession of a visitor keycard; his knowledge of the passcode to the PED offices; and his possession of a key to an individual Harvard office all gave him unlimited access to PED. It appears that this circumvented rules designed to limit access to Harvard space to individuals with legitimate reasons to be there,” the review stated.

“In effect, Professor Nowak and his CAO permitted Epstein to use PED’s offices as his own whenever he came to campus. Moreover, they did so without due regard for Harvard’s security rules.”

A protest group called “Hot Mess” hold up signs of Jeffrey Epstein in front of the federal courthouse in New York City on July 8, 2019. (Stephanie Keith/Getty Images)

Gifts, Links

Harvard accepted four gifts after Epstein’s arrest but no further donations were accepted after his conviction, under a decision by President Drew Faust. Several faculty members, including Nowak, tried to convince Faust to revise the order.

Epstein bypassed the order by getting others to donate to the university. Those donations included $7.5 million to support the work of Nowak. Leon Black, who donated millions with his wife or through their foundation, told lawyers he was introduced to the professor through Epstein.

Nowak also allowed links to the websites of Epstein’s foundations on PED’s website at the request of Epstein’s publicist. A full page featuring Epstein was also published on PED’s website. It was removed in 2014 after complaints from a sexual assault survivor’s group.

Epstein also regularly received communications from Harvard’s development offices, including an invitation to attend the start of the university’s Capital Campaign in 2013.

The review of Epstein’s ties with Harvard was conducted by Diane Lopez, the university’s general counsel, Ara Gershengorn, a Harvard attorney, and Martin Murphy of Foley Hoag LLP.

They recommended to Harvard President Lawrence Bacow that Harvard develop clearer procedures for reviewing potentially controversial donations, revise its procedures for appointing Visiting Fellows, and consider whether any further actions should be taken based on Epstein’s unfettered access to PED.

Bacow said in a letter to the Harvard community that he’s instructed members of his team to begin implementing the recommendations “as soon as possible.”

“The report issued today describes principled decision-making but also reveals institutional and individual shortcomings that must be addressed—not only for the sake of the University but also in recognition of the courageous individuals who sought to bring Epstein to justice,” he concluded.


Tyler Durden

Sun, 05/03/2020 – 20:40

via ZeroHedge News https://ift.tt/2ynvRpD Tyler Durden

Data Shows World Rejecting Governments’ Shelter-In-Place Tyranny

Data Shows World Rejecting Governments’ Shelter-In-Place Tyranny

People across the Western world have already started to revolt against government-enforced lockdowns that have now continued for at least the seventh week in some places. Apple’s Mobility Trends and Foursquare payments data illustrates how shelter-in-place is becoming a distant memory for some as they try to restore their lives to what it was in pre-corona times. 

The latest data from Apple’s Mobility Trends shows iPhone users in the US, Germany, UK, and Italy began to ignore stay-at-home orders around mid-April. While activity is still well below average trends from January 13, the recent rebound suggests more people are violating the orders 

Apple’s Mobility data shows driving and walking in the US has surged since mid-April but still below average. Public transportation use remains troughed and has yet to rebound. 

While mobility tracking data shows an uptick, payments company Foursquare is also showing increased visitations at stores. 

“People are feeling the itch to get back to the real world. As officials begin the process of relaxing some business restrictions, we’re starting to see upticks in foot traffic to various places. This is true across regions, regardless of state-specific policies,” Foursquare said in a blog post. 

In the second half of April, Foursquare notes that foot traffic at various types of stores started to move higher. Here’s what they found: 

  • Fast food and gas station visits have returned to pre-COVID-19 levels in the Midwest, and in rural areas across the nation. Though still below ‘normal’, visits in suburban and urban areas have shown substantial growth (>15%) since their end of March lows. Even casual dining restaurants are starting to show recent upticks, likely driven by new delivery and curbside options.

  • Men — and generally people between the ages of 35-64 — have shown more moderate declines across different types of places, and are also showing greater propensity to return

  • Visits to trails and home improvement stores — both allowable destinations in most states — are up substantially versus our February benchmark (31% and 56% respectively). While some portion of this is certainly seasonality, the growth in the last two weeks has been particularly notable; home improvement store visits, for instance, are up nearly ~20% in the last two weeks versus just ~6% in the period prior.

  • The midwest and rural areas across the country have shown more moderate declines across different types of places, and are also showing a stronger inclination to get back to normal.

Foursquare shows foot traffic at fast-food chains across all major US regions have bounced back to around baseline. 

Gas station visits have also reverted in all regions to near baseline, slightly higher in the Midwest. 

Note the mid-March surge in traffic at grocery stores was the panic hoarding period

People in all regions are returning to big box stores, but as we all know, they’re wearing masks and gloves

Slow return to convenience stores in all regions. 

A surge in traffic to warehouse stores has been seen in the second half of April.

And while in lockdown, Americans in all regions rushed to hardware stores in late April to buy things for their homes – may be spring remodeling? 

Liquor stores in all areas remained somewhat above trend during the lockdowns. 

One place people aren’t going to is restaurants. 

Dozens of states are attempting to reopen. Americans are panic searching “when can I leave my house.” 

Apple and Foursquare data suggests many Americans are fed up with stay-at-home orders as they now venture out into a post-corona world. Such activity could be enough to spark a second coronavirus wave, and with a record amount of deaths seen on Friday, the virus crisis could be worsening.


Tyler Durden

Sun, 05/03/2020 – 20:15

via ZeroHedge News https://ift.tt/2z5MOou Tyler Durden

The Fed’s Balance Sheet Will Expand By 38% Of GDP, More Than Double QE1, 2 And 3 Combined

The Fed’s Balance Sheet Will Expand By 38% Of GDP, More Than Double QE1, 2 And 3 Combined

Authored by Chetan Ahya, chief Morgan Stanley economist and global head of economics

The 1Q GDP data releases for the US and euro area this week provide official confirmation of what we have known for some time – the recession has started. However, we remain of the view that this downturn will be sharper but shorter than the GFC.

To begin with, the trigger for this recession is an exogenous shock in the form of a public health crisis, rather than the classic, endogenous adjustment triggered by rising imbalances. This also did not start out as a financial crisis, and the banking system is in better shape today than prior to the GFC. Moreover, this recession has prompted the most coordinated and aggressive monetary and fiscal easing that we have witnessed in modern times. For the G4 and China combined, fiscal deficits as a percentage of GDP will be 1.5 times GFC levels. Similarly, G4 central banks are aggressively expanding their balance sheets. The Fed’s balance sheet will expand by 38 percentage points of GDP, more than the 20 percentage points during QE1, 2 and 3 combined.

Hence, while global growth will trough at -7.5%Y in 2Q20 on our estimates (far below the -2.4%Y in 1Q09), global and DM output will reach pre-recession levels in four and eight quarters, respectively, as compared with six and fourteen quarters during the GFC.

A number of the high-frequency indicators we track suggest that the global economy is in the process of bottoming out. Consumers’ future expectations have improved, mobility trends have moved up from their troughs and consumer spending is contracting more slowly than in the early weeks of the outbreak. In the US, our IT services & payments analyst James Faucette highlights that credit card transactions data indicate that both transactions and sales have picked up in the past two weeks. Our read is that China’s economy bottomed in February, and we think the euro area has likely troughed in April with the US following suit from late April. Other regions such as CEEMEA and LatAm will bottom out later.

As economies reopen, allowing more workers to return to work, mobility trends and production levels will likely improve further, as should end demand with a lag. A phased reopening in the US and Europe is in the works for the coming weeks. In the US, some states have begun to reopen, and our US economics and biotechnology teams estimate that, by mid-May, 54% of the economy will be in a meaningful reopening phase. This estimate assumes that states will be able to reopen 28 days (Phase 2) after the peak in new confirmed coronavirus cases. European economies will also progressively reopen from early May onwards.

As we move towards this gradual reopening in parts of the world outside China, we have been closely observing developments in China to see how various sectors of the economy are normalising and how this experience may inform our outlook for the rest of the world. To be sure, our views are shaped by the path but not the duration and magnitude of recovery, considering the differences in the severity of the outbreak as well as the underlying composition of economic activity between the US, Europe and China.

In China, the manufacturing, infrastructure and construction sectors recovered relatively quickly. The manufacturing PMI is back in expansionary territory, while steel and cement demand and property sales are growing again in year-over-year terms, just ten weeks after the peak in new cases. Supply-side disruptions have eased quickly, and production levels have experienced a V-shaped recovery, which suggests that the manufacturing sectors in the US and Europe should be on a similar path post-reopening.

However, as the US and Europe are more consumption-based economies, it is the experience of the Chinese consumer that is drawing the most investor attention. Consumption in China is also showing signs of progress, but the pace of recovery has varied across different segments, and the phased relaxation of social distancing measures has dampened the overall pace to some extent.

As you might expect, sales in China’s online retail channels (which account for 30% of total sales) are back in positive territory YoY, while traffic to shopping malls sits at 70% of normal levels (even though malls are now fully open). Smartphone sales have seen a V-shaped recovery and demand for tech products has improved on a broad front according to our Asia technology analyst Shawn Kim, but spending on other consumer discretionary products is still lagging somewhat. Consumer goods (staples, home appliances and apparel) companies expect normalisation by the end of June (i.e., moving back towards normal levels of YoY growth in 2H20). Restaurants have 50-80% of their customer base back, but night life venues are still closed in Tier 1 cities and cinemas remain dark until early June. Our China consumer analyst Lillian Lou expects these channels to fully reopen by the end of June/beginning of July, and traffic to normalise in 3Q20. For the US, our branded apparel & retail analyst Kimberly Greenberger expects that some US retail discretionary spending stores will open in May but a full reopening is likely only in June. She expects a 78-85% decline for the discretionary retail segment in April, but this will materially improve to a 30-45%Y decline for the May-July period and further to a 10-15%Y decline in August-October.

The reopening of economies has prompted concerns about a second wave of infections and potential double dip in the economy. We readily admit that many unknowns concerning the virus remain, but we do expect additional waves of infections to occur. However, we take comfort that the phased reopening, the scaling up of public health authorities’ ability to test and trace on a meaningful level, the development of medical solutions to treat and prevent the disease and the awareness of the population at large mean we have a much better chance to reduce the size and scope of future outbreaks.


Tyler Durden

Sun, 05/03/2020 – 19:50

via ZeroHedge News https://ift.tt/2W040oA Tyler Durden

There Is Now A Record 375 Million Barrels Of Oil Stored On Tankers

There Is Now A Record 375 Million Barrels Of Oil Stored On Tankers

Last weekend we showed that as oil storage on land was rapidly filling up, a familiar sight was seen off the coast of Asia’s oil hub in Singapore: a record surge in tankers on anchor used as seaborne storage, and taking advantage of the supercontango just waiting for oil prices to rebound so they can deliver their (formerly) precious cargo.

So as more and more storage moves offshore, here is an update from Bank of America on the current status of the oil market as the “oil glut moves from tanks to tankers.”

In the last five weeks, onshore inventories held in floating top tanks climbed 180mn bbl, suggesting that builds have averaged roughly 4.3mn b/d since mid-March. These inventory increases reduce BofA’s estimates for available onshore crude storage capacity from roughly 910mn bbl to 730 mn bbl (Chart 2), although the bank still believes that this capacity is unlikely to be fully utilized due to logistical constraints and other issues.

How did we get here? As has been extensively reported here and elsewhere, WTI timespreads signalled a massive build in Cushing inventories and stocks would likely reach their operational limits within a few weeks (Chart 3). More recently, the expiration of the May WTI contract demonstrated the lack of available capacity at the hub. Cushing inventory builds are set to slow dramatically as much of the remaining capacity may be needed as an operational backstop for pipeline issues and blending needs (Chart 4). Over the coming weeks and months, US inventory trends could even reverse as producers in Canada and the Bakken shut-in output and refiners increase runs on the back of the re-opening of the economy.

As Bank of America adds, land based crude oil inventories first surged in China, where the coronavirus outbreak originated (Chart 5). Since then, China’s inventories have stagnated while stocks in the US and elsewhere ticked higher. There is room for incremental builds in China going forward, especially if the government uses more commercial tank space for strategic petroleum reserves (Chart 6). Elsewhere, inventories in Europe and the Middle East remain relatively lower. In Europe, this may be due to the mothballing of some tank storage at refiners and terminals. So, actual storage utilization rates may be higher than the data suggests. In the Middle East, inventories have climbed in GCC countries but may also remain lower on average as these countries prefer to sell oil as exports before storing domestically. In the US, producers have leased 23mn bbl of the roughly 70mn bbl of available SPR capacity and added 1.1mn bbl to SPR storage last week.

Of course, in addition to land based storage, the market also uses tankers for crude oil storage as a spillover outlet. Crude oil on the water has risen by roughly 150mn bbl since the start of the year, to more than 1.2bn bbl (Chart 7). This is due to a combination of higher crude in transit stemming from OPEC’s oil price war and from increases in crude oil floating storage. Since mid-March, crude oil floating storage has grown by an estimated 91mn bbl, or roughly 2.2mn b/d (Chart 8). Asia and Europe saw the largest increases in floating storage, climbing 36mn bbl and 20mn bbl respectively over the same period.

According to data from Clarksons, there are more than 350 vessels currently being used for floating oil (crude and product) storage globally (Chart 9). Of this total, roughly 100 are very large crude carriers (VLCC) and ultra-large crude carriers (ULCC). Total oil held in floating storage has risen to 375mn bbl, up 220mn bbl from mid-March and 230mn bbl from the start of the year (Chart 10). A majority of this storage has occurred on VLCCs and ULCCs, followed by Suezmax and Aframax vessels.

The first vessels booked for floating storage were primarily VLCCs and ULCCs, but demand for Suezmax and Aframax vessels has also increased dramatically since April (Chart 11). As traders utilize more of the smaller vessels, the average amount of floating storage per vessel has decreased, implying an increase in the average cost for floating storage. Since the beginning of the year, the average level of storage per vessel have collapsed from more than 1.5mn bbl to just 1mn bbl. (Chart 12). This rise in tanker rates for each ship type, combined with crude increasingly being stored on smaller vessels at the margin, is a double positive whammy on the marginal cost of crude storage and thus on the contango in the crude curves.

The abrupt demand contraction has forced crude oil forward curves into steep contango (Chart 13), with Brent 1-13 spreads widening to -$16/bbl at times to facilitate floating storage. As demand for freight picked up, dirty tanker rates spiked. The shape of the forward curve for the TD3 dirty tanker route (Middle East to Japan) was very flat just eight weeks ago (Chart 14), but the increase in demand from Saudi Arabia and from floating storage pushed front month rates up nearly 400%. More recently, rates have subsided somewhat but still remain exceptionally high compared to historical levels.

Freight rates have been exceptionally volatile, with VLCC 12 month time charters spiking to $80,000/day in early April and falling to around $65,000/day recently (Chart 15). The increase in smaller vessels has been less dramatic, with Suezmax and Aframax vessels peaking at $45,000/day and $34,000/day respectively. The very steep contango in the front of the Brent curve (e.g. 1-3m) has allowed for floating storage to be economical. Yet the 12 month contango in Brent was recently lower than the going rate for 12 month time charters for Suezmax and Aframax vessels. Additional pressure on Brent timespreads will be needed in order to encourage more floating storage using these types of vessels (Chart 16).

Refining margins have been exceptionally volatile since lockdowns began on a global scale (Chart 17). As refiners cut runs or shut down completely, margins experienced short term rebounds, but margins continue to trend towards zero on a spot basis as refined product inventories surge. In the US, product inventories have risen counter-seasonally and are now nearly 70mn bbl above year ago levels and 26mn bbl above previous five-year highs from 2016. It is no surprise that refined product markets have also developed their own supercontango (Chart 18), as prompt prices plummeted. Refiners have attempted to take advantage of the significant price improvement for forward product prices by storing products on land on and the water.

Estimates for floating storage vary depending on methodology. Some trackers classify floating storage as vessels that have remained idle for 10 days and others assume 14 days. The types of vessels tracked may also vary, leading to higher or lower floating storage levels. Nonetheless, all estimates point to rising volume on the water (Chart 19). Refined product floating storage is not well tracked, but Clarksons does track total tankers used for floating storage. Combining Clarksons data with other crude oil only floating storage data from Vortexa implies that refined product builds have been exceptional (Chart 20). Even if total levels of implied refined product floating storage are off, there is little doubt that product storage is on the rise.

The oil surplus was initially visible in dirty tanker freight rates, but clean tanker rates are now beginning to surge as refiners and traders seek to float unsold product volumes (Chart 21). With refined product prices like Singapore gasoline falling to $0.50/gal, shipping has become a disproportionately large component of the all-in cost of delivered fuel, making fuel movements exceptionally expensive. The economics for floating product storage varies dramatically depending on the contango of each product market and on the density of individual products. The recent surge in clean product tanker rates has challenged floating storage economics (Chart 22), but volatility in product forward curves should continue to offer opportunities for traders to float cargoes.

Another round of run cuts could bring renewed crude weakness. The global oil rout likely peaked in April as oil demand contracted by nearly 25mn b/d YoY. Now, countries are emerging from lockdown, boosting oil demand just when OPEC+ cuts are kicking in and producers elsewhere are cutting output. Even so, the market should remain in surplus for the remainder of 2Q20, resulting in continued, albeit slower crude oil and product builds. The oil market is forward looking and market balances look much better in 2H20 which should be supporting of prices. That said, with so much product moving into floating storage, we see risk of additional pressure on refining margins, even as global refinery outages hit record levels (Chart 23). Any further reduction in refinery demand for crude could ultimately result in renewed weakness for crude oil prices (Chart 24) and would likely warrant steeper contango.


Tyler Durden

Sun, 05/03/2020 – 19:25

via ZeroHedge News https://ift.tt/2YufYIt Tyler Durden

Stocks, Yuan, Oil Are All Tumbling As Asia Opens

Stocks, Yuan, Oil Are All Tumbling As Asia Opens

No Buffett buying spree, and no Federal bailout #4 (or is it 6?)… and the result – in admittedly thin liquidity – is US equity futures, crude oil futures, and offshore yuan are all dumping as Asian markets open…

Dow futures are down over 350 points…

WTI Crude is down over 5%…

And offshore yuan is ugly…

Gold is also under pressure and the dollar rallies, with futures testing $1700…

But, Bonds are modestly bid (futures open, cash closed)…

Somebody wake up Kudlow… stat!


Tyler Durden

Sun, 05/03/2020 – 19:01

via ZeroHedge News https://ift.tt/2VXhr8H Tyler Durden

“Passive Aggressive Flows”: The Oil Whale

“Passive Aggressive Flows”: The Oil Whale

Authored by Ryan Fitzmaurice of Rabobank

Passive aggressive flows

Summary

  • The recent and erratic moves in oil prices have highlighted the growing influence and significant impact passive funds can have on commodity and financial markets
  • The rise of commodity ETFs over the past decade has led to a surge in retail participation in what was once difficult to access commodity futures markets
  • The USO fund has attracted a great deal of regulatory scrutiny in the wake of the negative oil price settlement given its whale-like status in nearby Nymex WTI futures contracts
  • USO, the exchange traded fund was forced to restructure its holdings in an effort to reduce systemic risk to markets

The rise of commodity ETFs

This year is off to an unbelievable start on so many fronts and across all asset classes. While most of our time and effort is spent tracking and modelling the directionally dynamic money flows of CTA and managed futures strategies – the recent and erratic moves in oil prices – has shifted our attention back to the ever growing influence and significant impact passive funds are having on markets. This phenomenon has been long in the making and the last decade has witnessed the rise of more and more financial commodity products in the market place. In fact, the rise of commodity exchange traded funds (ETFs) and even exchange traded notes (ETNs) has led to a surge in retail participation in what was once difficult to access commodity futures markets. For clarity, these commodity products trade on various stock exchanges throughout the day and provide wide ranging access to underlying futures contracts but without the need for a futures trading account. Many of these passive funds simply go out and buy the equivalent notional amount of futures contracts per dollar that is invested and then roll those contracts on a predetermined schedule to avoid taking physical delivery. The futures contract roll is transacted in a very transparent manner but without any work on the investors’ part which is one of the huge benefits ETFs provide to institutional investors. On the flip side, this dynamic can also result in retail investors piling into a product they don’t fully understand the mechanics of. This issue is playing out in real time as a surge of investment dollars have poured into passive oil ETFs but without fully understanding key dynamics. This has led to significant losses and even unprecedented regulatory intervention in the wake of last month’s negative WTI oil settlement.

USO: Fund Details

The publicly traded USO fund has attracted a great deal of regulatory scrutiny in the wake of last month’s negative oil price settlement given its whale-like status in nearby Nymex WTI futures contracts. For readers unfamiliar with the fund, the USO oil ETF is traded on the New York Stock Exchange and available to pretty much anyone with a standard stock trading account. The exchange traded fund is a packaged up version of an underlying futures based index with key details listed here:

The oil whale

The speculative retail interest in USO, the supposedly passive oil fund, has shot up dramatically in recent weeks and months as crude prices have cratered to all-time lows and even unheard of negative spot prices. In fact, the fund currently has net assets north of 3.5 billion USD after starting the year with 1.2 billion USD. The exchange traded fund caught the ire of US regulators last week though due to its out-sized share of open interest in the Jun-20 WTI contract which was fast approaching 30% of open positions. This raised a lot of eyebrows given that the May-20 WTI contract had just settled in negative territory. For clarity, USO was not in the May-20 Nymex WTI contract when it settled in negative territory last week as it has already rolled to the Jun-20 contract but nonetheless the risk of negative prices occurring again in the Jun-20 contract was and is very real and apparent. This scenario posed a real threat to the market as potential losses on the ETF holdings could dwarf the net assets of the fund if prices were to fall deeply into negative territory again while USO was invested. Who would be on the hook in this case? Well, the regulators and exchanges did not want to wait to find out the hard way and instead took decisive action to greatly reduce ETF and investor products holdings of nearby crude oil contracts.

Too big to fail

While we all know there are plenty of fundamental drivers pressuring crude prices at the moment, it’s really been money flows that have been driving the price action in recent days. In fact, we learned that last Tuesday’s major collapse in the Jun-20 WTI contract was largely a result of the USO fund liquidating a large portion of its holdings in the Jun-20 contract and shifting further out the curve into the Jul-20 and Aug-20 contracts to avoid the risk of prices going negative again as expiration approaches. The publicly traded fund reported that is had sold roughly 90k contracts of Jun-20 Nymex WTI on Tuesday as a result of orders from the exchange and regulatory bodies to roll contracts away from spot. This forced liquidation had serious market implications and the overwhelming selling pressure was enough to send the Jun-20 WTI contract nearly $10/bbl lower, losing over half of its value in a single trading day. The move took the ETF share of open interest for the Jun-20 Nymex WTI from roughly 25% to just over 10%, a much more manageable level but the story doesn’t end there. The fund was forced to sell even more in subsequent days until its entire Jun-20 position was liquidated. The selling pressure clearly pushed the Jun-20 contract lower and we have even seen the Jun-20 rally in recent days as the forced liquidation ended. The same footprint can be seen when looking at the calendar spread price action. Ironically, the USO fund was only able to buy roughly half the equivalent exposure in Jul-20, Aug-20, and beyond given how steep the curve is at the moment and the fact that the fund invests on a dollar basis. While the situation is still fluid, the near-term risk to the system appears to have been sufficiently reduced as USO and others have taken action to reduce position sizes and stay out of nearby expiring futures contracts, at least for the foreseeable future. On top of that, USO can no longer issue new shares until otherwise notified which should prevent it from growing too big again.

Looking Forward

The recent oil price dynamics have certainly challenged conventional wisdom leading into this year which assumed oil prices had a zero floor bound. The move into negative commodity prices has also highlighted the systemic risk that ETFs and passive funds can pose to overall markets during periods of market stress. In this case, the risk of a worst case scenario occurring has been greatly reduced but not totally eliminated. Furthermore, the disorderly May-20 pre-expiry liquidation resulted in massive retail losses which has shined a light on the dangers of financial engineering derivative products for retail clients. It has been reported that retail clients at a Chinese bank lost over 1 billion USD in a product linked to WTI crude oil. There are also reports of significant losses for retail clients of a well-known US trading platform. Perhaps more than anything though, this recent liquidation driven price action in oil markets has highlighted the importance of understanding money flows and in this case what was supposed to be “passive” flows turning into “active” flows, at least temporarily.


Tyler Durden

Sun, 05/03/2020 – 19:00

via ZeroHedge News https://ift.tt/2z3VsDZ Tyler Durden

Watch: Park Ranger Thrown Into Lake In Texas Over ‘Social Distancing’ Enforcement

Watch: Park Ranger Thrown Into Lake In Texas Over ‘Social Distancing’ Enforcement

There’s been an increasing number of incidents between law enforcement and antsy Americans eager to get back outdoors after being sick of ‘stay at home’ and state-wide lockdown measures. But often individuals’ desire for a rapid return to normal is butting up against continuing social distance measures still in place in most states, even those already opening up their economies. 

A viral video showed one such recent tense encounter in Texas, when a park ranger attempted to break-up a large group of young partiers at a state park. It happened at the Commons Ford Metropolitan Park in Austin, Texas. A group on Lake Austin was reportedly unlawfully drinking and smoking on the grounds when a ranger approached and ordered them to “disperse” also due to people were not standing six feet apart.

That’s when things got physical, resulting in the officer being pushed or thrown into the water, according to widely circulating footage:

Though the laughing group of what appeared to be college students took it as a prank, police later apprehended and arrested a 25-year old man for assault on the ranger. The man initially tried to run away as the ranger struggled to get out of the water.

It illustrates a rising trend of frustrated citizens coming up against local law enforcement eager to see safe distancing between patrons. 

The Austin-American Statesman described the scene

“Keep that 6 feet of distance with each other,” the ranger says.

Some in the crowd are heard saying “will do” and “I got you, man” before the ranger is pushed into the water.

Hicks could have “caused the ranger to strike his head on the dock as he was falling,” the affidavit says.

Other onlookers came to the ranger’s aid even apologized for the young man’s behavior.

The culprit was later charged with a felony for assault on a law enforcement officer.

Likely there will be many more such encounters in various contexts across states in the coming days, as more and more Americans begin taking matters into their own hands and defying state and local distancing orders. 

Though we might also note that fiercely independent Texans typically lead the way when it comes to such drastic actions signaling anger and defiance. 


Tyler Durden

Sun, 05/03/2020 – 18:35

via ZeroHedge News https://ift.tt/2Wkatti Tyler Durden

David Stockman On The Three Nations Of COVID, & A Windbag Named Fauci

David Stockman On The Three Nations Of COVID, & A Windbag Named Fauci

Authored by David Stockman via Contra Corner blog,

If you don’t think our so-called mainstream rulers has gone off the deep end, just consider New York Mayor Bill de Blasio’s recent menacing tweets to the orthodox Jewish community in Brooklyn, which has insisted on holding funerals, including one Monday for a revered 73-year old Rabbi attended by upwards of 2,000 mourners:

“Something absolutely unacceptable happened in Williamsburg tonite: a large funeral gathering in the middle of this pandemic,” the mayor said in one post. “When I heard, I went there myself to ensure the crowd was dispersed. And what I saw WILL NOT be tolerated so long as we are fighting the Coronavirus.”

My message to the Jewish community, and all communities, is this simple: the time for warnings has passed. I have instructed the NYPD to proceed immediately to summons or even arrest those who gather in large groups. This is about stopping this disease and saving lives. Period.

Well, NYC is nearly a ghost town and now its idiotic ruling pols are suggesting that, apparently, only ghosts may attend funerals without governmental permission!

But actually, this photo from the offending funeral is another picture worth a thousand words.

That’s because by now, everyone, and we mean everyone, knows that the Covid-19 strikes the elderly, the frail and the already disease-afflicted; and that these vulnerable populations need to not only “social distance”, but actually stay home and keep out of harm’s way completely.

That appears to be exactly what happened at Rabbi Mertz’ funeral. If you can spot an octogenarian in this crowd, or even a grandfather, your eyesight is better than Clark Kent’s.

And besides being preponderantly way under 50-somethings, they congregated outdoors and virtually all were wearing masks. Yet claiming to speak for some latter day “Committee of Public Safety”, Mayor Robespierre actually threatened to bring in the gendarmes.

Hundreds of people gathered in Williamsburg, Brooklyn, for a massive funeral Tuesday evening

As to whether the above pictured citizens should be jailed or fined, let’s start with a tale of two Lockdown Nations – New York City and the semi-socialist Republic of California.

Both have imposed severe stay-at-home and business shutdown orders almost from the day the Donald issued his unfortunate March 16 guidelines. Yet here are the results 45 days later with respect to their mortality rates, which is ostensibly the reason officialdom issued these draconian “cease and desist” orders in the first place.

To wit, the mortality rate as of April 28 was 143 per 100,000 in New York City and 4.6 per 100,000 in the state of California. Essentially the same public health policy lockdown, but night and day differences in the outcome.

Yes, New York is more dense than California on average, but that doesn’t even remotely explain the difference. That’s because by now there is overwhelming evidence that the severity of the quarantine regime has essentially zero impact on the mortality metrics.

And folks, even the Virus Patrol hardliners don’t claim their lockdown orders are designed to prevent 3-day hospital stays by people who get an unusually stubborn case of the winter flu. This is about death prevention and that’s why they run the Chyron of Death across the CNN screen day and night.

But there is zero correlation:

  • California: Heavy lockdown, 4.6 deaths per 100,000;

  • Iowa: No lockdown, 4.3 deaths per 100,000;

  • Texas: Light lockdown, 2.4 deaths per 100,000;

  • Washington state: Heavy lockdown, 10.0 deaths per 100,000;

  • Colorado: Inconsistent lockdown, 12.2 deaths per 100,000;

  • Georgia: Late Lockdown now lifted, 10.0 deaths per 100,000;

  • Maine: Heavy Lockdown, 3.8 deaths per 100,000;

  • Massachusetts: Heavy Lockdown, 45.7 deaths per 100,000.

We call attention to Washington state, Maine and Massachusetts especially because even though they all have severe statewide lockdown regimes and their overall mortality rates very widely, from 3.8 per 100,000 in Maine to 45.7 per 100,000 in Massachusetts, they do share one thing in common. To wit, 40-60% of their Covid-fatalities have been in nursing homes.

In Maine, 53% of Covid deaths were in nursing homes, meaning that the actual Covid-mortality rate for the general population is just 1.8 per 100,000 and in Massachusetts 56% are nursing home fatalities, meaning the general rate is 21 per 100,000.

Ironically, Sweden has one of the least restrictive lockdown regimes in the world – schools, businesses, restaurants and retail remain open–yet its mortality rate of 22 per 100,000 is virtually the same as the lockdown state of Massachusetts.

Self-evidently, what matters is not how economically suicidal the lockdown regime is from one jurisdiction to the next, but the age, health status and general frailty/vulnerability of the populations at issue. In the case of Washington state where the first corona cases occurred, upwards of 40% of the 690 deaths to date have been in nursing homes, meaning that its general population mortality is just 6.0 per 100,000.

As we amplify below, these single-digit rates are rounding errors on the scheme of things, even as all deaths are both regrettable and inevitable. But by what rational calculation does Governor Inslee insist on keeping the state in Lockdown and its economy heading into the the drink?

Someone might dare inform him that the general mortality rate from all causes for his citizens is 900 per 100,000 annually, and that, therefore, he is imposing the economic mayhem evident in these charts below owing to a risk of Covid death for the general population of his state that so far has been 0.7% of the normal average.

Stated differently, had Patient Zero (aka the Donald) not been the victim of malpractice by his doctors led by Fauci and the Scarf Lady, he might have been advised to dial in on day #1 to the heart of the Covid-threat. Namely, the 15,600 nursing homes in America, which domicile some 1.5 million residents, of which one-quarter (425,00) are over the age of 80 years.

In the case of Massachusetts, where the majority of deaths have occurred in nursing homes, the average age of Covid-deaths has been 82 years.

Needless to say, you did not need to be entombed in the infectious disease tunnel at the NIH for 52 years like Dr. Fauci, a pretentious 79-year old windbag who should have himself been put in a retirement home years ago, to realize that nursing homes are dense-packed with the frail, disease-afflicted elderly.

So rather than wipe out $4 trillion of GDP via Lockdown Nation they might have started with say $25 billion of incremental money for Medicare/Medicaid and the state public health agencies to zero-in on protecting, isolating and treating the nursing home residents.

After all, we find it easy to believe that spending $20,000 per nursing home resident might have saved or extended a lot more lives than the WHO/CDC/DR. Fauci blunderbuss assault on the entire US economy.

Indeed, with each passing update, the CDC data itself becomes an ever more dispositive indictment of the madness the Donald’s doctors have imposed on the nation. It is now strikingly clear, in fact, that when it comes to Covid-19 there are three nations in America, and that the attempt to shoe-horn them into a one-size fits all regime of state control is tantamount to insane.

There is first the Kids Nation of some 61 million persons under 15 years, where even by the CDCs elastic definitions there have been just 5 WITH Covid deaths thru April 28. You needn’t even bother with the zero-ridden fraction of 1 per 100,000 (its actually 0.008) to make the point.

That is to say, last year there were about 44,000 deaths among the Kids Nation – so corona-virus accounts for just 0.011% of the total, and in no sane world would it be a reason for shutting down the schools.

Of course, the Virus Patrol insists that the school closures are an unfortunate necessity because otherwise the Kids Nation would take the virus home to the Parents/Workers Nation. That is the 215 million citizens between 15 and 64, who account for the overwhelming share of commerce, jobholders and GDP.

Yet according to the CDC, there have been just 8,267 deaths WITH Covid in this massive expanse of the population, which figure represents a mortality rate of, well, 3.6 per 100,000.

But here’s the thing. The normal total mortality rate for the 15-64 years old population is 335 per 100,000. So we are talking about shutting down the entire economy owing to a death rate to date which amounts to 1.1% of normal mortality in the Parents/Workers nation.

Finally, we have Grandparents/Great Grandparents Nation, comprised of 52 million citizens. But they account for 32,000 or nearly 80% of the WITH Covid deaths as of April 28 – with 15,000 of these being among those 85 years and older.

By way of computation, that’s 61 deaths per 100,000 for the group as a whole and 230 per 100,000 for the 85 years and older.

Stated differently, the risk of death posed by Covid-19 is 7,600X greater for Grandparents/Great Grandparents Nation overall than for Kids Nation, and 29,000 times greater for the several million Great-Grandparents afflicted with severe comorbidity and likely as not to be in the care of a nursing home.

Needless to say, it did not take a catastrophic experiment with Lockdown Nation to figure this out. It was already known from China and the history of other coronaviruses.

If there were any reason or justice left in America, Dr. Fauci and the Scarf Lady and the whole CDC/WHO lobby that brought about this disaster would actually be headed for their own quarantine – the kind that doesn’t happen at home and which can’t be lifted by the whims of the Cuomo brothers or Mayor Robespierre.


Tyler Durden

Sun, 05/03/2020 – 18:10

via ZeroHedge News https://ift.tt/3fi6Dtc Tyler Durden