Here Are The Top 5 Consensus Trades As We Enter 2021

Here Are The Top 5 Consensus Trades As We Enter 2021

At the start of every year, the Wall Street consensus is infatuated with a set of ideas, narratives and trades, which shape markets for the next few months, quite often repricing violently especially since so many of them end up being dead wrong. 2021 is no exception, and as Reuters summarizes among the top trades which investment banks and asset managers believe will dominate financial markets in 2021, are: i) Dump the dollar!; ii) Buy emerging markets! iii) Stay sustainable… oh and pray that central banks bail you out when everything blows up.

1. King Dollar (Keeps) Falling

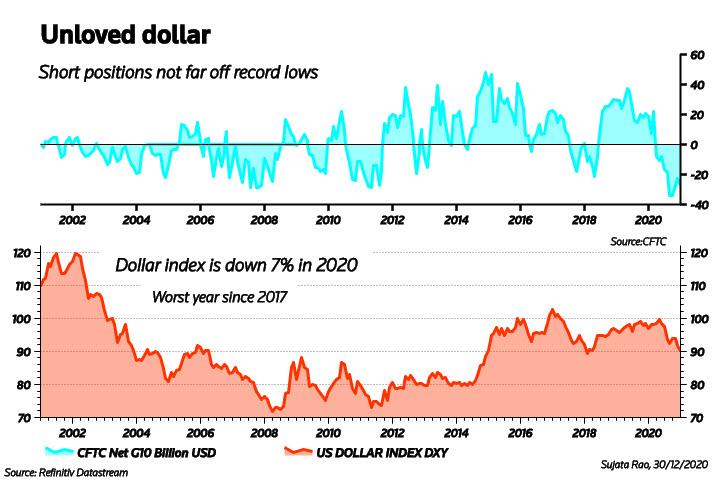
Covid ended a decade of dollar strength (after first creating a supernova surge in the value of the greenback as a $12 trillion dollar short squeeze shockwave which was short circuited by the Fed printing trillions), and expectations are for 2021 to bring more greenback pitfalls. BofA’s December investor survey showed ‘shorting’ the dollar was the second most crowded trade. Another gauge – U.S. Commodity Futures Trading Commission data – shows $30 billion in net dollar shorts, swinging from last December’s $17 billion net long.

The reasoning, says Peter Fitzgerald, chief investment officer for multi-asset and macro at Aviva Investors, is that no central bank can “out-dove the Fed”. In other words, when the Federal Reserve cut interest rates near 0%, it kicked away the dollar’s yield advantage over peers. And it still has room to ease policy.  Any future reduction in trade and political tensions, likely under a Biden administration, would also be dollar-negative

How much and for how long will the dollar fall? Analysts polled by Reuters predict weakness to endure until mid-2021, capped by COVID-19 uncertainty. But PIMCO notes dollar declines are fastest after deep recessions, with five instances of 8%-10% annual depreciations recorded between 2003 and 2018. Vaccines and rebounding economies will “hasten the dollar’s fall from grace”, PIMCO predicted.

2. Re-emerging markets

With developing economies seen benefiting from recovering global trade, tourism and commodities, a weaker dollar and a more predictable White House, Morgan Stanley’s message is: “Gotta Buy EM All!” The bank is recommending currencies from China, Mexico, Brazil, South Africa and Russia, alongside bonds from Ukraine and Mexican oil firm Pemex. Goldman Sachs and JPMorgan are also backing EM for 2021, with the BofA survey showing the sector the main overweight. Pictet says EM currencies have 25% of undervaluation to recoup.

Additionally, debt in emerging market currencies will net investors 6.2% next year, more than the S&P500, BofA expects. The sentiment swing towards a sector that’s languished for a decade is driven of course by hopes of a China-led growth recovery but also the lure of higher emerging market interest rates, given 0% or negative yields across richer countries.

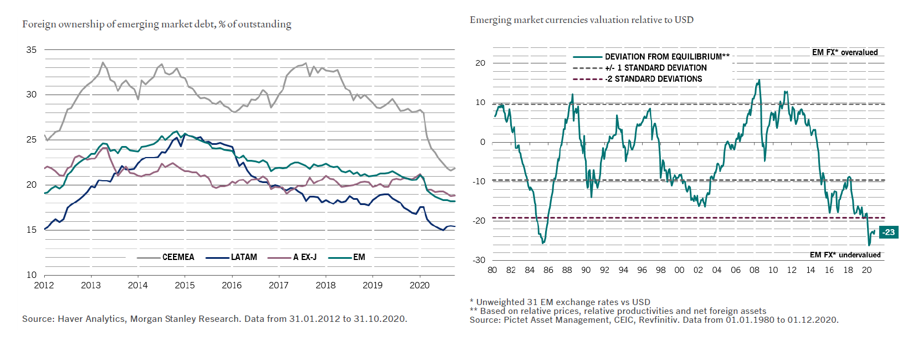
Understandably, according to the Institute of International Finance (IIF) investors are shovelling money into EM assets at the fastest rate in nearly a decade. But some remain wary. Higher Treasury yields could spark a 2013-style “taper tantrum”, Citi suggested. Investment-grade credit ratings are at risk in some countries such as Romania or Mexico, while more debt defaults are likely in weaker nations.

3. (Central) Banking on It

Perhaps we should have started with this one because underpinning virtually all 2021 bets is the view that the Federal Reserve, European Central Bank, Bank of Japan, Bank of England and People’s Bank of China will keep the cheap money flowing. As we reported previously, central banks worldwide spent $1.3 billion an hour since March on asset purchases, according to BofA. There were also 190 rate cuts in 2020 year – roughly four every five trading days. But with global GDP seen expanding 5.4% next year – the most since 1973 – it might be hard to justify pushing the pedal further to the metal, especially if inflation creeps higher.

And not much policy room is left anyway. JPMorgan estimates that over 80% of sovereign bonds from richer nations pay negative yields after factoring in inflation. Many investors including BlackRock are now underweight the sector. Still, the Big Five’s asset purchases should total $3 trillion, Pictet predicts, down from this year’s $8 trillion but enough to keep bond yields extremely low.

A note of caution from JPMorgan – consensus forecasts in the past 10-15 years have correctly called the direction of Treasury yields only 40% of the time. Which means that the most likely outcome is for sharply lower yields by year end.

4. ESG – Here For “Good”

The assets of funds investing in environmental, social and governance (ESG) principles doubled this past year to over $1.3 trillion, and the IIF predicts the pace will accelerate in 2021, especially if U.S. President-elect Joe Biden pursues a greener agenda (the irony, as we explained in September, is that most “ESG” investments are really just a handful of mega-cap tech stocks). Virtue signaled “concerns” about pollution, climate change and workers’ rights (by corporations whose bottom line is to literally minimize workers’ rights) are the main drivers. But the IIF also points out 80% of “sustainable” equity indices outperformed non-ESG peers during the pandemic-linked selloff, while renewable energy has been the runaway outperformer since then.

BlackRock describes ESG as “the tectonic shift transforming investing” (perhaps referring to the impact its own top-line is expected to see), forecasting “persistent flows into sustainable assets in the long transition to a less carbon-intensive world.” In any case, for now it’s working: two-thirds of ESG fund assets are in equities, but sustainable debt has grown 20% in 2020 to more than $620 billion. Governments are stepping up green debt issuance while central banks are eyeing more sustainable bond-buying and reserve strategies

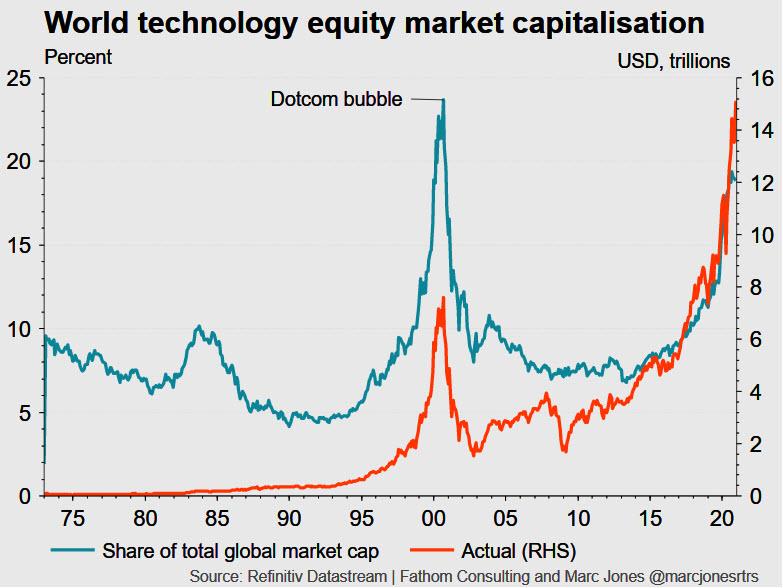
5. Biden Time on Tech

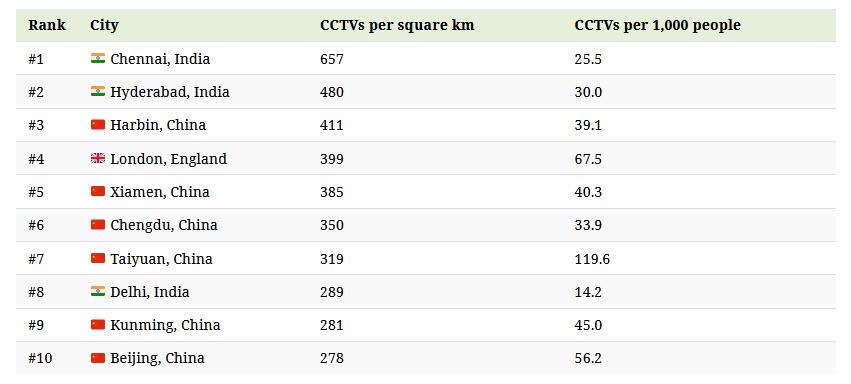
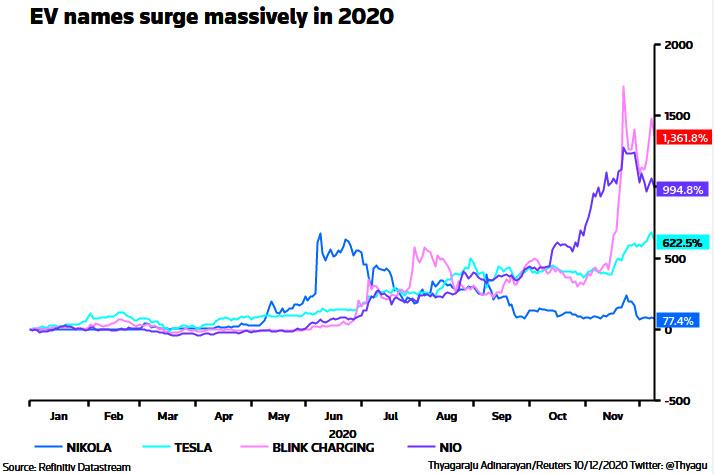
According to Reuters, many of the above investment strategies are premised on a very different approach to trade and geopolitics under Biden. He has vowed the United States will be “ready to lead” again on the global stage, but BofA cautions that China, North Korea or Iran may look to test him early on with “provocative actions”. In some areas – big data, 5G, artificial intelligence, electric vehicles, robotics, and cybersecurity – Biden’s policies might be just as combative as Trump’s.

That may speed up the move towards what’s dubbed ‘splinternet’, with dual or multiple tech systems. Tech and e-commerce companies account for a quarter of U.S. corporate profits, while tech comprises 40% of MSCI’s emerging equity index. So watch this space.

Tyler Durden
Tue, 01/05/2021 – 08:00

via ZeroHedge News https://ift.tt/3pTigvw Tyler Durden

Proud Boys Leader Arrested In Washington Ahead Of Wednesday Protest Rally

Proud Boys Leader Arrested In Washington Ahead Of Wednesday Protest Rally

The leader of the Proud Boys, the group that has vocally supported President Trump’s efforts to overturn the election results, was arrested on Monday on charges of destruction of property after he arrived in Washington to protest the congressional certification of the election later this week, the NYT and WaPo reported.

The chairman of the Proud Boys – a Latin man by the name of Enrique Tarrio – was arrested by Metropolitan Police on suspicion of burning a Black Lives Matter banner torn from a historic Black church in Washington during protests last month that led to several violent clashes, including stabbings, around the city.

Enrique Tarrio, center, the leader of the Proud Boys

Police stopped a car Tarrio had been in shortly after it entered the District, said Dustin Sternbeck, a D.C. police spokesman. He said it is believed that Tarrio, who lives in Miami, was coming into the District from the airport. Sternbeck said Tarrio is charged with one misdemeanor count of destruction of property in connection with the Dec. 12 burning of a banner stolen from Asbury United Methodist Church.

A spokesman for the Metropolitan Police Department confirmed that Tarrio, 36, had been arrested on charges of destruction of property, stemming from a mid-December incident in downtown Washington. Police said Tarrio, who was in custody Monday evening, also was charged with two felony counts of possession of high-capacity ammunition feeding devices, which is a legal term for a firearms magazine that allows guns to hold additional bullets. The devices were found during the arrest, police said.

Members of the Proud Boys are planning a rally in the District on Wednesday in support of President Trump and his efforts to overturn the election outcome. Trump has urged his supporters to descend on Washington to express their dismay with the certification of the election for President-elect Joseph R. Biden Jr. On New Year’s Day, he promoted what he described as “the BIG Protest Rally” in Washington.

Tarrio had told The Washington Post last month that he was among those who burned the banner. The church banner was ripped down after a similar rally last month.

According to WaPo, Tarrio could appear Tuesday in D.C. Superior Court. Prosecutors with the U.S. attorney’s office in the District could modify the charges brought by police. Authorities had described the burning of the banner as a potential hate crime. Sternbeck said it would be up to prosecutors to determine whether to file hate crime charges, which could increase the penalty.

Tarrio last month told The Post that he would plead guilty to destruction of property, pay the church the cost of the banner and surrender to authorities if a criminal charge was filed. “Let me make this simple,” he said. “I did it.”

However, Tarrio said he would not admit to committing a hate crime. He said he was not motivated by race, religion or political ideology, but because he believes the Black Lives Matter movement “has terrorized the citizens of this country.”

The Proud Boys, along with members of antifa were caught in protests and marches in mid-December that gave way to violent clashes between Trump’s supporters, antifas and law enforcement, as well as vandalism and destruction of property at churches in the city, including historic Black churches. The local police said at the time that it would investigate the church attacks as potential hate crimes.

The banner that Tarrio said he participated in burning was taken from Asbury United Methodist, one of the oldest Black churches in the city. DC police have classified the burning as a destruction of property, a misdemeanor when damage is under $1,000. It is punishable by up to 180 days in jail and a $1,000 fine.

Tarrio previously said he does not know who tore down the banner, and that neither he nor his members knew the church is predominantly African American. “We didn’t Google the church and go, ‘Oh, it’s a Black church, let’s target it,’ ” Tarrio said. “The sign was taken down because of what it represents.”

Washington is bracing for another round of protests on Wednesday, when the Senate convenes to certify the results of the Electoral College. Pro-Trump groups including the Proud Boys are expected to protest, and law enforcement officials are preparing for more violence.

Tarrio had said on Parler that the Proud Boys would “turn out in record numbers on Jan 6th,” but that they would fan out across the city “incognito.”

Tyler Durden
Tue, 01/05/2021 – 07:00

via ZeroHedge News https://ift.tt/2XdnG8c Tyler Durden

Andurand Hedge Fund Returns 154% In 2020 Amid Historic Oil Turmoil

Andurand Hedge Fund Returns 154% In 2020 Amid Historic Oil Turmoil

2018 was a very bad year for one-time commodity trading wunderkind, Pierre Andurand, who back in April of 2018 bet oil could soon hit $100 a barrel (and even said $300 oil is “not impossible“), but watched as his billion Andurand Commodities Fund suffered its largest monthly loss ever just a few months later as oil closed the year at just half of his target price. And while his performance in 2019 was better, the energy trader who runs one of the last big oil-focused hedge funds again failed to generate a positive return in a year when oil staged only a modest rebound.

Well what a difference a year makes: after being short in early 2020 when WTI did the unthinkable and on April 20 traded as low as a negative $40/bbl, Andurand redeemed himself following losses in the previous two years, and according to Bloomberg, his hedge fund stormed back in 2020 to post its biggest-ever gain.

The flagship Andurand Commodities Fund, which mostly bets on rises and falls in oil prices, was up 68.6% for the year, according to a Bloomberg source, while the Discretionary Enhanced Fund, which was launched in 2019 without pre-set risk limits, surged 154%. That made it not only the best performing commodity fund, but also one of the year’s best-performing hedge funds across all products and sectors.

As we reported at the time, most of the funds’ gains came in March (up 63.5%) and April when energy prices collapsed amid the covid lockdowns, and when Andurand was uncharacteristically – if 100% spot on correct – bearish on oil (we warned just weeks before the infamous price implosion that negative prices could be coming, and one month later that’s precisely what happened) .

According to Bloomberg, Andurand’s returns were the best since his main fund made 38% in 2014. The solid 2020 performance is reminiscent of his strong gains during the last financial crisis at his previous firm BlueGold, which he co-founded with Dennis Crema in 2007 and launched the following year. He made more than 210% in 2008.

The solid performance could not come any sooner for the fund which has emerged as one of the very few commodity hedge funds still trading. Many of the biggest names have exited the market, including Astenbeck Capital Management, Blenheim Capital Management and Clive Capital, each of which managed billions of dollars at its peak, but which were forced to shutdown following major losses in recent years as oil cratered on several occasions in the past 6 years.

Tyler Durden
Tue, 01/05/2021 – 06:30

via ZeroHedge News https://ift.tt/3bmQFyP Tyler Durden

2021: The Alternative View

2021: The Alternative View

Authored by Sven Henrich via NorthmanTrader.com,

As promised some views and chart perspectives on the upcoming year of 2021.

I’m titling this 2021: The Alternative View simply because Wall Street consensus is again entirely bullish for 2021 driven by the presumed view of a strong economic recovery to come along with continued aggressive central bank intervention. Fair enough and let’s assume this to be the base case.

In fact let’s just get the bullish case out of the way to start with.

Since most seem to be projecting $SPX north of 4,000 I’ll offer a technical chart that suggests a move toward $SPX 4000 or beyond is technically possible if nothing matters and that’s a basic fib extension of the current move:

That’s 4156, the 1.618 fib. That’s the technical upside risk that presumes record valuations and the farthest disconnect from equity valuations and the economy doesn’t matter. Let’s not forget that markets closed 2020 at 186% market cap to GDP an all time history high. Typically one does not start a recovery with all time bubble valuations. But hey.

That’s what Wall Street presumes and projects. I however want to at least offer a varying perspective, especially in context of the big macro video (The Ugly Truth) I had put out this weekend. It’s long I know, but if you haven’t seen it I’d encourage you to watch it when you have time as it offers a big in depth view of the larger state of affairs:

One of the points I make in the video is that all projections by everybody have been wrong in the past few years and liquidity has been really the only key deciding factor:

At the end of 2017 Wall Street predicted tax cuts would result in expanding economic growth to produce higher asset prices, instead we got little new growth but buyback fueled earnings growth yet lower asset prices due to the Fed tightening. For 2019 Wall Street predicted earnings growth and higher yields but none materialized yet asset prices flew higher anyways on the heels of 3 rate cuts and the Fed’s repo operations and related balance sheet expansion of several hundred billion dollars.

In 2020 Wall Street came out with higher $SPX price targets again with the view of again further expanding earnings growth. For reference these were the most aggressive $SPX targets outlined in December 2019 for 2020 presuming positive earnings growth:

Instead $SPX closed 2020 at 3755, much higher than even the most aggressive price targets, but not on positive earnings growth, but rather on -14% earnings growth. Ha ha. Joke on everybody. Where we’re going we don’t need earnings growth. I jest but the message is clear: Everything is disjointed and disconnected.

Fact is predictive efforts to use earnings growth as a justification for higher asset prices have become a mockery as during the past 3 years price moves have been completely detached from developments in earnings growth. Fact is in the past 2 years $SPX has gained over 50% on aggregate negative earnings growth (a temporary 35% crash in early 2020 notwithstanding).

Like it or not the market action is entirely driven and distorted by one key factor:

And what is needed for markets to continue to rally? One factor alone:

So can we please stop with the facade of using earnings growth to justify higher price targets?

As it stands Wall Street presumes positive earnings growth for 2021 to the tune of +22% (which is possible) and again even higher price targets based on continued efficacy of central banks to maintain and/or expand the historic disconnect between asset prices and the economy.

Given this backdrop I wanted to offer a few select technical charts that leave room for an alternative path to 2021.

Before I do that a simple observation: In 2020 markets indeed rallied right through year end, this was the melt up scenario I outlined in Greed is Back at the beginning of December based on the 1999/2000 $NDX scenario:

In December I also suggested selling to occur in early January: “The chart shows a sizable decline in early January. Why? Tax loss selling. When people have a lot of gains in stocks they typically don’t want to sell until the next tax year.”

Indeed we can observe similar behavior so far on this first trading day of January:

So from this perspective early year weakness could well set up for buying opportunities for either lower highs or new highs yet to come. Indeed late year price jam ups can well translate into more strength at the beginning of the following year.

After all in 2000 markets didn’t peak until March, in 2020 we didn’t top out until February 19 before the crash. In 2018 we didn’t top out until January 29.

But there are some key differences to previous years and they inform the potential for the alternative view.

For example, this year we’re entering the year with the highest MA disconnects ever in many index charts:

There is no history of such MA disconnects to be sustainable and in my view 2021 will see key MA reconnects at some stage. Whether these will then posit buying opportunities or will be signs of a breaking bull market will have to be assessed then.

We’re also seeing a market with most open gaps ever, example $NYSE:

Never has been a rally sustained with so many open gaps below. I expect major gap filling action at some stage in 2021. Not all gaps may get filled, but initially the entire gap action from the November rally may get filled at some point and that too may set up for a buying opportunity.

Of larger concern for bulls however:

What if all the price advances in 2020 came in context of another round of larger bearish rising wedges rising into key resistance?

See the $DJIA:

See $SPX, also in context of massive negative divergences in money flows previously outlined in Mystery:

Indeed see this much larger wedge on $ES:

These larger patterns, as long as not invalidated, have potential for higher prices still, but should they technically break they leave the possibility for massive downside in equities, especially on context of a market trading at 186% market cap to GDP.

In addition to these wedge patterns note the corollary structure in the US dollar. Much of the rally in 2020 has been dependent on a declining dollar and this trend has continued even into early 2021 but note the pattern is similarly bullish dollar as it was in 2018:

All of these charts suggest a completely bearish outcome to 2021 is at least a possibility with massive volatility to come at some point:

Indeed one of the biggest unspoken mysteries of 2020 has been the inability of the $VIX to fill its February 2020 gap despite trillions in interventions, vaccines introduced and new record market highs with many days seeing the price action dominated by price gaps with little intra-day volatility.

Not to scare anybody here, but this larger $VIX structure is of a potential cup & handle pattern and as long as it’s not invalidated, it has the potential for $VIX 130. Yes you are reading right. Ridiculous? So was my wife’s $VIX 90 call in the fall of 2019 when $VIX was trading in the low teens (see the Big Short):

But it happened.

And hey Robinhooders, anybody remember $VIX 172? Oh yea that happened once too in a market far far away:

The $VIX was called $VXO then, but it’s still trading today.

Nobody is saying $VIX 130 tomorrow or next week and it may never happen. These are big structural charts and they could take months to play out, but they all suggest potential massive risk to the current uniform bullish narrative.

In context everybody seems to have forgotten about the yield curve:

We had the initial inversion which everybody ignored, then the recession and now the steepening. And typically a steepening of the yield curve brings about much lower asset prices.

What if 2020 was all a liquidity mirage, a perversion of the market cycle and this cycle is to now assert itself and bring about a process of rebalancing and price discovery made worse by the artificial price extensions brought about by central bank overindulgence in intervention?

A rhetorical question. For now.

Final thought: We live in this fantasy world of permanent asset price inflation:

$NDX closed the year 2020 49% above it yearly 5 EMA. That’s ridiculous, only surpassed by the tech bubble in 2000 and it suggests major reversion risk in 2021 for yearly 5 EMA reconnects some stage.

Bottomline: These are historic times and we’re witnessing artificial market influences the likes we have never seen before. 2021 will be very much about a reconciliation of historic never before seen valuations, an unfalsifiable belief in a strong recovery and continued central bank efficacy versus technical disconnects and structural patterns that leave room for the alternative view.

This reconciliation process will take months to sort itself out and will offer astute and flexible traders plenty of opportunities to partake in large price ranges to the upside as well as to the downside. Indeed we may see a blow-off top first in the early part of the year followed by a complete reversal in the second half. Or perhaps markets already topped. Or nothing happens and central banks remain in control and the magic asset price inflation fairy will continue to sprinkle multiple expansion dust on this market.

I can’t tell you how the year 2021 will turn out nor will I pretend to throw out price targets, rather I want to suggest humility in face of the reality that everybody has been wrong about their earnings growth, economic growth and yield forecasts over the past 3 years. Yes, central banks have been able to bail out bad forecasts yet again. But that lack of predictive ability by the entire spectrum of Wall Street and central banks should give everyone pause or it at least suggests to keep a watchful eye on some of the charts I outlined above for these charts may offer important guideposts as the year progresses.

*  *  *

For the latest public analysis please visit NorthmanTrader. To subscribe to our market products please visit Services.

Tyler Durden
Tue, 01/05/2021 – 06:00

via ZeroHedge News https://ift.tt/3hI53ma Tyler Durden

China’s First Mars Mission Begins Next Month As Tianwen-1 Approaches Red Planet

China’s First Mars Mission Begins Next Month As Tianwen-1 Approaches Red Planet

China’s first Mars mission could begin as early as next month. Tianwen-1 is expected to enter the red planet’s orbit in February, according to the China National Space Administration (CNSA).

On Sunday, CNSA released a statement that read Tianwen-1 has traveled more than 400 million km (249 million miles) from Earth since its launch in July. 

The spacecraft is now 8.3 million km (5.2 million miles) from Mars. Chinese state-controlled broadcaster CCTV, citing CNSA’s statement, said:

The space probe is “functioning stably and is scheduled to slow down before entering Mars orbit in more than a month and preparing itself to land on the red planet.”

Tianwen-1 probe has three parts: an orbiter, a lander, and a rover. The sequence of the Mars’ mission will begin with orbiting, landing, then roving. 

The orbit phase of the mission will be conducted for two to three months to decide on possible landing sites. 

Once the landing site is chosen, the landing and rovering will begin sometime in May. Upon landing, the rover has 90 Martian days (about three months on Earth) to conduct scientific experiments. 

A space competition with the US is unfolding as a race to send space probes to Mars, and the moon has been China’s latest mission. 

In December, CNSA declared its “Chang’e-5 successfully landed on the near side of the moon.” 

The probe’s mission included using a robotic arm from the lander to drill into the lunar surface to collect about four pounds of moon rocks, storing them in a container on the ascent module on top of the lander, before returning to Earth. 

The US and Soviet Union competed for space supremacy in the 1960s and ’70s, as it now appears the ’20s will be between China and the US. 

Tyler Durden
Tue, 01/05/2021 – 05:30

via ZeroHedge News https://ift.tt/2MusHqF Tyler Durden

Statistician: Lockdowns Don’t Work Because They Force People To Congregate In Fewer Places

Statistician: Lockdowns Don’t Work Because They Force People To Congregate In Fewer Places

Authored by Paul Joseph Watson via Summit News,

Author and statistician William M. Briggs argues that lockdowns don’t work because they force people to gather in fewer places like supermarkets and therefore spread viruses faster than if people were allowed to spread out.

Writing on his blog, Briggs states, “A lockdown will spread this bug faster than allowing people to remain at liberty.”

The author notes that a lockdown is not the same as a quarantine. Under lockdown, people only have a limited selection of venues at which they are allowed to gather, meaning those locations are busier and therefore make a virus more transmissible.

“Lockdowns are merely forced gatherings,” writes Briggs.

“People in lockdown are allowed to venture forth from their dwellings to do “essential” activities, like spending money at oligarch-run stores. These stores are collection points, where people are concentrated. Some are allowed to go to jobs, such as supporting oligarch-run stores.”

Briggs notes that lockdown concentrates people into fewer areas outside before it “then it forces them back inside to mingle with a vengeance.”

“It’s clear that our 100% transmissible bug will spread much faster when people are forced to spend more time indoors with each other. Once one person gets it, he will spread it to those at his home immediately. If people were at liberty, and therefore more separated, the bug would still spread to everybody, but more slowly (the speed here is relative),” he writes.

“Lockdowns force people together. The venues they are allowed to venture to are restricted, and therefore concentrate contact, and they force people inside their homes where it’s obvious contact time increases. Lockdowns concentrate contact spaces and times,” concludes Briggs.

Briggs writes further that before 2020 it was obvious that lockdowns (with then only weather forcing people to gather inside for long periods) not only did not stop the transmission of bugs, but helped spread them. A look (below) at the all-cause death numbers peaking every single winter without exception (this year, too) proved that. It was in no way controversial. It was so well known that forced contact spread bugs that mentioning it was like saying the sun rose in the east.

Then came 2020 and the “expert” idea of lockdowns would do the opposite of what everybody had always known they would do. Suddenly, instead of spreading bugs, as they always did before, they would stop or at least slow the spread. Experts said so.

Why?

Models. Specifically, the two-step Model Circular Jerk.

It works like this. A modeler says “X is true.” He builds a model that assumes “X is true”. He runs the model, which output consists of “X is true” and its variants. He then announces, “X is true, confirmed by my sophisticated computer model.”

In our case, we have a Ferguson claiming some new variant of the coronavirus has a higher transmissibility, an assumption. He says to himself “Lockdowns slow and stop the spread of bugs”. He builds a model that assumes “Lockdowns slow and stop the spread of bugs”. He runs the models, which consists of “This lockdowns will slow and stop the spread of this new bug variant.” And he announced he has confirmed the efficacy of lockdowns via his sophisticated model.

And he is believed.

This happens everywhere, not just with coronavirus.

Briggs’ assertion is also backed up by how people spend their leisure time under lockdown. With most shops, cinemas and other entertainment venues closed, people in major cities pour en masse into parks or beaches where ‘social distancing’ is virtually impossible because there are so many people around.

In London, rates of COVID-19 infection were higher after the November lockdown than before it started.

*  *  *

New limited edition merch now available! Click here. In the age of mass Silicon Valley censorship It is crucial that we stay in touch. I need you to sign up for my free newsletter here. Support my sponsor – Turbo Force – a supercharged boost of clean energy without the comedown. Also, I urgently need your financial support here.

Tyler Durden
Tue, 01/05/2021 – 05:00

via ZeroHedge News https://ift.tt/38d0NYQ Tyler Durden

Tourism Tumbles To 1990 Levels As Pandemic Halts Travel

Tourism Tumbles To 1990 Levels As Pandemic Halts Travel

While few industries have been spared by the impact of the COVID-19 pandemic, even fewer have been hit as hard as the tourism sector.

As 2020 drew to a close with severe limitations to travel still in place, the World Tourism Organization (UNWTO) expects international arrivals to have declined by 70 to 75 percent compared to the previous year. As Statista’s Felix Richter writes, that equates to a decline of around 1 billion international arrivals, bringing the industry back to 1990 levels.

Infographic: Tourism Back to 1990 Levels as Pandemic Halts Travel | Statista

You will find more infographics at Statista

Prior to the coronavirus outbreak, the global tourism sector had seen almost uninterrupted growth for decades.

Since 1980, the number of international arrivals skyrocketed from 277 million to nearly 1.5 billion in 2019. As Statista‘s chart above shows, the two largest crises of the past decades, the SARS epidemic of 2003 and the global financial crisis of 2009, were minor bumps in the road compared to the COVID-19 pandemic.

Looking ahead, most experts don’t expect a full recovery in 2021, which started off with many countries still battling the second wave of the pandemic. According to the UNWTO’s estimates, it will take the industry between 2.5 and 4 years to return to pre-pandemic levels of international tourist arrivals.

Tyler Durden
Tue, 01/05/2021 – 04:15

via ZeroHedge News https://ift.tt/3pQOeZi Tyler Durden

This Russian Energy Giant Is Mining Bitcoin With Virtually Free Energy

This Russian Energy Giant Is Mining Bitcoin With Virtually Free Energy

Authored by Haley Zaremba via OilPrice.com,

Two things that seem futuristic: Bitcoin and energy efficiency. Two things that are diametrically opposed: Bitcoin and energy efficiency. Mining Bitcoin might not sound like a resource-intensive process, but in fact it requires almost unbelievably vast amounts of energy. In order to track the shocking energy footprint of Bitcoin mining, the University of Cambridge’s Centre for Alternative Finance created an online tool that measures this consumption to its best ability and compares it to the energy consumption of other entities to put the shocking quantities into perspective.

Thanks to the climbing price of Bitcoin, this week the cryptocurrency’s energy consumption topped that of Pakistan–a nation of more than 200 million people.

This spike in Bitcoin mining is thanks to an explosion in Bitcoin prices. The cryptocurrency’s value has jumped 276% this year alone, trading above $30,000 on Tuesday with a total market value over $500 billion. As MarketWatch points out, this could make Bitcoin not only more energy intensive, but less energy efficient, as the price spike “has made it more profitable to use less-efficient equipment.”

It’s not just Bitcoin’s energy footprint and market value that are gargantuan–its carbon footprint is worryingly large as well.

Last year, however, Bitcoin defenders rallied around a new study by cryptocurrency investment products and research firm CoinShares that found nearly 75% of Bitcoins were mined using clean energy. Unfortunately, that report has now come under great scrutiny by other researchers, who have found that estimate to be greatly exaggerated. After all, two thirds of all Bitcoin mining in the world takes place in China, where more than half of the nation’s power is coal-fired.

In recent months however, this dependence on coal has become a major issue for Bitcoin mining operations in China. As China has experienced an energy shortage in recent months, in large part thanks to Beijing’s decision to blacklist Australian coal imports, domestic Bitcoin mining has come under siege. While China is still far and away the world’s largest trader of Bitcoin, energy shortages and the increased production of other countries are quickly closing that cap.

As of now, two thirds of bitcoin production happens in China, followed by the United States which represents just 7% of all bitcoin production.

The U.S. is closely followed by Russia and Kazakhstan. But that ranking could soon change as Russia makes a power play to ramp up its mining operations in a venture led by Gazpromneft, the petro-based subsidiary of Russia’s state-owned natural gas giant Gazprom, the 10th biggest oil producer in the world.

Gazpromneft recently began a cryptocurrency mining operation based in one of its Siberian oil drilling sites, “unlocking the power of Russia’s oil and gas resources for the needs of bitcoin mining,” Yahoo! Finance reported this week. In slightly better news for Bitcoin’s carbon footprint, Russia’s new mining operation will be powered by natural gas from the oil field, located in the Khanty-Mansiysk region of northwestern Siberia, which has its own power plant to convert the gas into electricity for Bitcoin production. And there is another silver (and green) lining to this model:

“The CO2 that gets freed during the oil drilling is normally a liability for oil companies as they have to burn it into the atmosphere, which results in fines. However, there are ways to utilize it instead of wasting it, and electricity generation is one of them,” Yahoo! Finance reports.

The location of the new Russian Bitcoin farm also means that the costs of the operation will be relatively low. Instead of paying a premium to use energy from the grid, locating the cryptocurrency mining on-site at an oil field means that a steady supply of natural gas is virtually free.

All this is to say that China and the U.S. had better get ready for some stiff competition. 

Tyler Durden
Tue, 01/05/2021 – 03:30

via ZeroHedge News https://ift.tt/38ey7OW Tyler Durden

Mapping The World’s Most-Surveilled Cities (London Leads The West)

Mapping The World’s Most-Surveilled Cities (London Leads The West)

Since the world’s first CCTV camera was installed in Germany in 1942, the number of surveillance cameras around the world has grown immensely. In fact, as Visual Capitalist’s Avery Koop notes, it only took us 79 years to go from one camera to nearly one billion of these devices.

In the above interactive graphic, Surfshark maps out how prevalent CCTV surveillance cameras are in the world’s 130 most populous cities.

Big Brother is Watching

So how many of us are being watched? China and India are the countries with the highest densities of CCTV surveillance cameras in urban areas. Chennai, India has 657 cameras per square kilometer, making it the number one city in the world in terms of surveillance.

Here’s a closer look at the world’s top 10 cities by CCTV density.

London is the only non-Asian city to crack the list with 399 CCTV cameras per square kilometer.

Beijing ranks in tenth place. The Chinese capital has the highest number of CCTV cameras in total, at just over 1.1 million installed in the city.

Although CCTV cameras have become extremely prevalent in cities around the world, this does not mean these cameras are seeing and recognizing our every move. In most instances, cameras are in a fixed position—and some of the more invasive aspects of CCTV, like accompanying facial recognition technology, are not universal yet.

The Need for CCTV

The ubiquity of surveillance cameras can be unnerving to some, as they represent diminishing privacy. However, there are also those that feel the presence of cameras creates added safety.

While governments like China’s claim that having high amounts of surveillance cameras helps reduce crime, the actual data gets messy. For example, the Chinese city of Taiyuan has roughly 120 cameras per every thousand people and yet the city has a higher crime index than most.

Freedom vs. Security

As surveillance networks become more sophisticated and granular, there is increasing concern about breaches to personal freedoms.

China is doubling down with surveillance in its cities by pioneering the usage and exportation of facial recognition technology. This technology is integral to China’s proposed social points system. With a database of 1.3 billion pictures that can be matched to a face on a CCTV camera in seconds, troublemaking citizens can easily be identified.

In India, on the other hand, the amount of cameras can be attributed to mass urbanization, rising crime, and scarcity of urban resources. Overall, there is a rising middle class that wishes to protect itself with the use of CCTV cameras.

As we close in on one billion CCTV surveillance cameras globally by the end of 2021, we will undoubtedly continue to be monitored well into the future.

Tyler Durden
Tue, 01/05/2021 – 02:45

via ZeroHedge News https://ift.tt/3rUwmyj Tyler Durden

OPCW Chief Dodges Questions On Syria Cover-Up After New Leaks, Attacks On Whistleblowers

OPCW Chief Dodges Questions On Syria Cover-Up After New Leaks, Attacks On Whistleblowers

Authored by Aaron Maté via TheGrayZone.com,

For the first time, OPCW chief Fernando Arias was asked a series of direct questions at the United Nations about the cover-up of a Syria chemical weapons probe. He answered none of them.

Russia’s UN ambassador asked Arias about several damning leaks, some revealed by The Grayzone, as well as ongoing deceptive attacks on the veteran scientists who challenged the censorship of their investigation. Arias refused to answer in public session, and gave vague, non-substantive answers in private.

Aaron Maté recaps the unanswered questions to Arias, as well as recent attacks on the OPCW whistleblowers via Western state-funded outlets Bellingcat and the BBC.

Read more:

Draft debacle: Bellingcat smears OPCW whistleblower, journalists with false letter, farcical claims

Questions for BBC on new White Helmets podcast series attacking OPCW whistleblowers

OPCW executives praised whistleblower and criticized Syria cover-up, leaks reveal

Tyler Durden
Tue, 01/05/2021 – 02:00

via ZeroHedge News https://ift.tt/355Y5Cv Tyler Durden